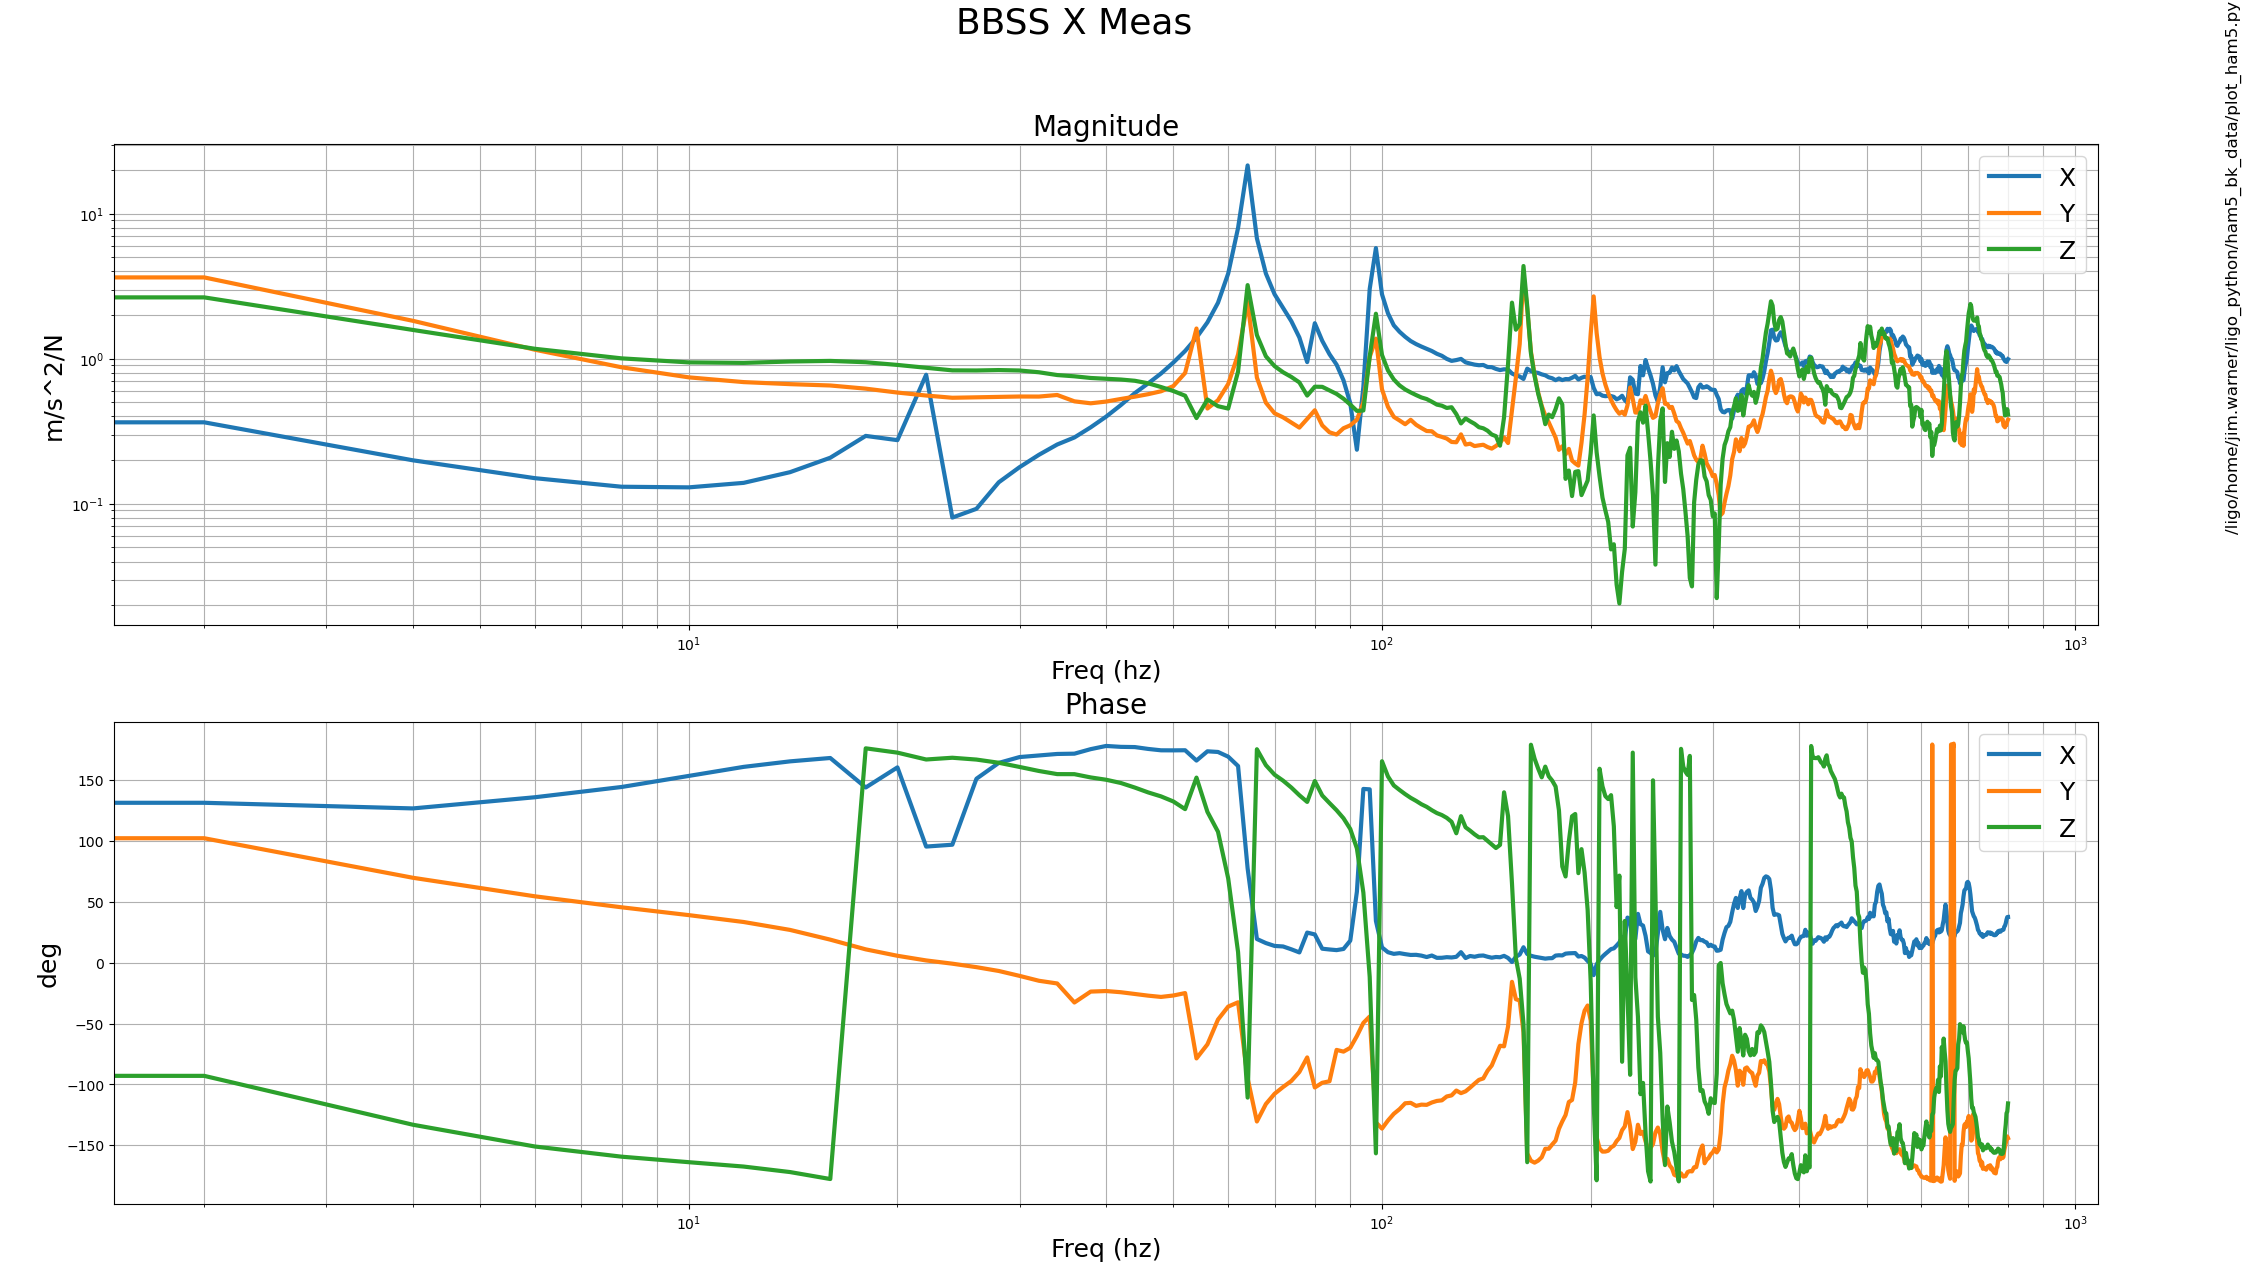
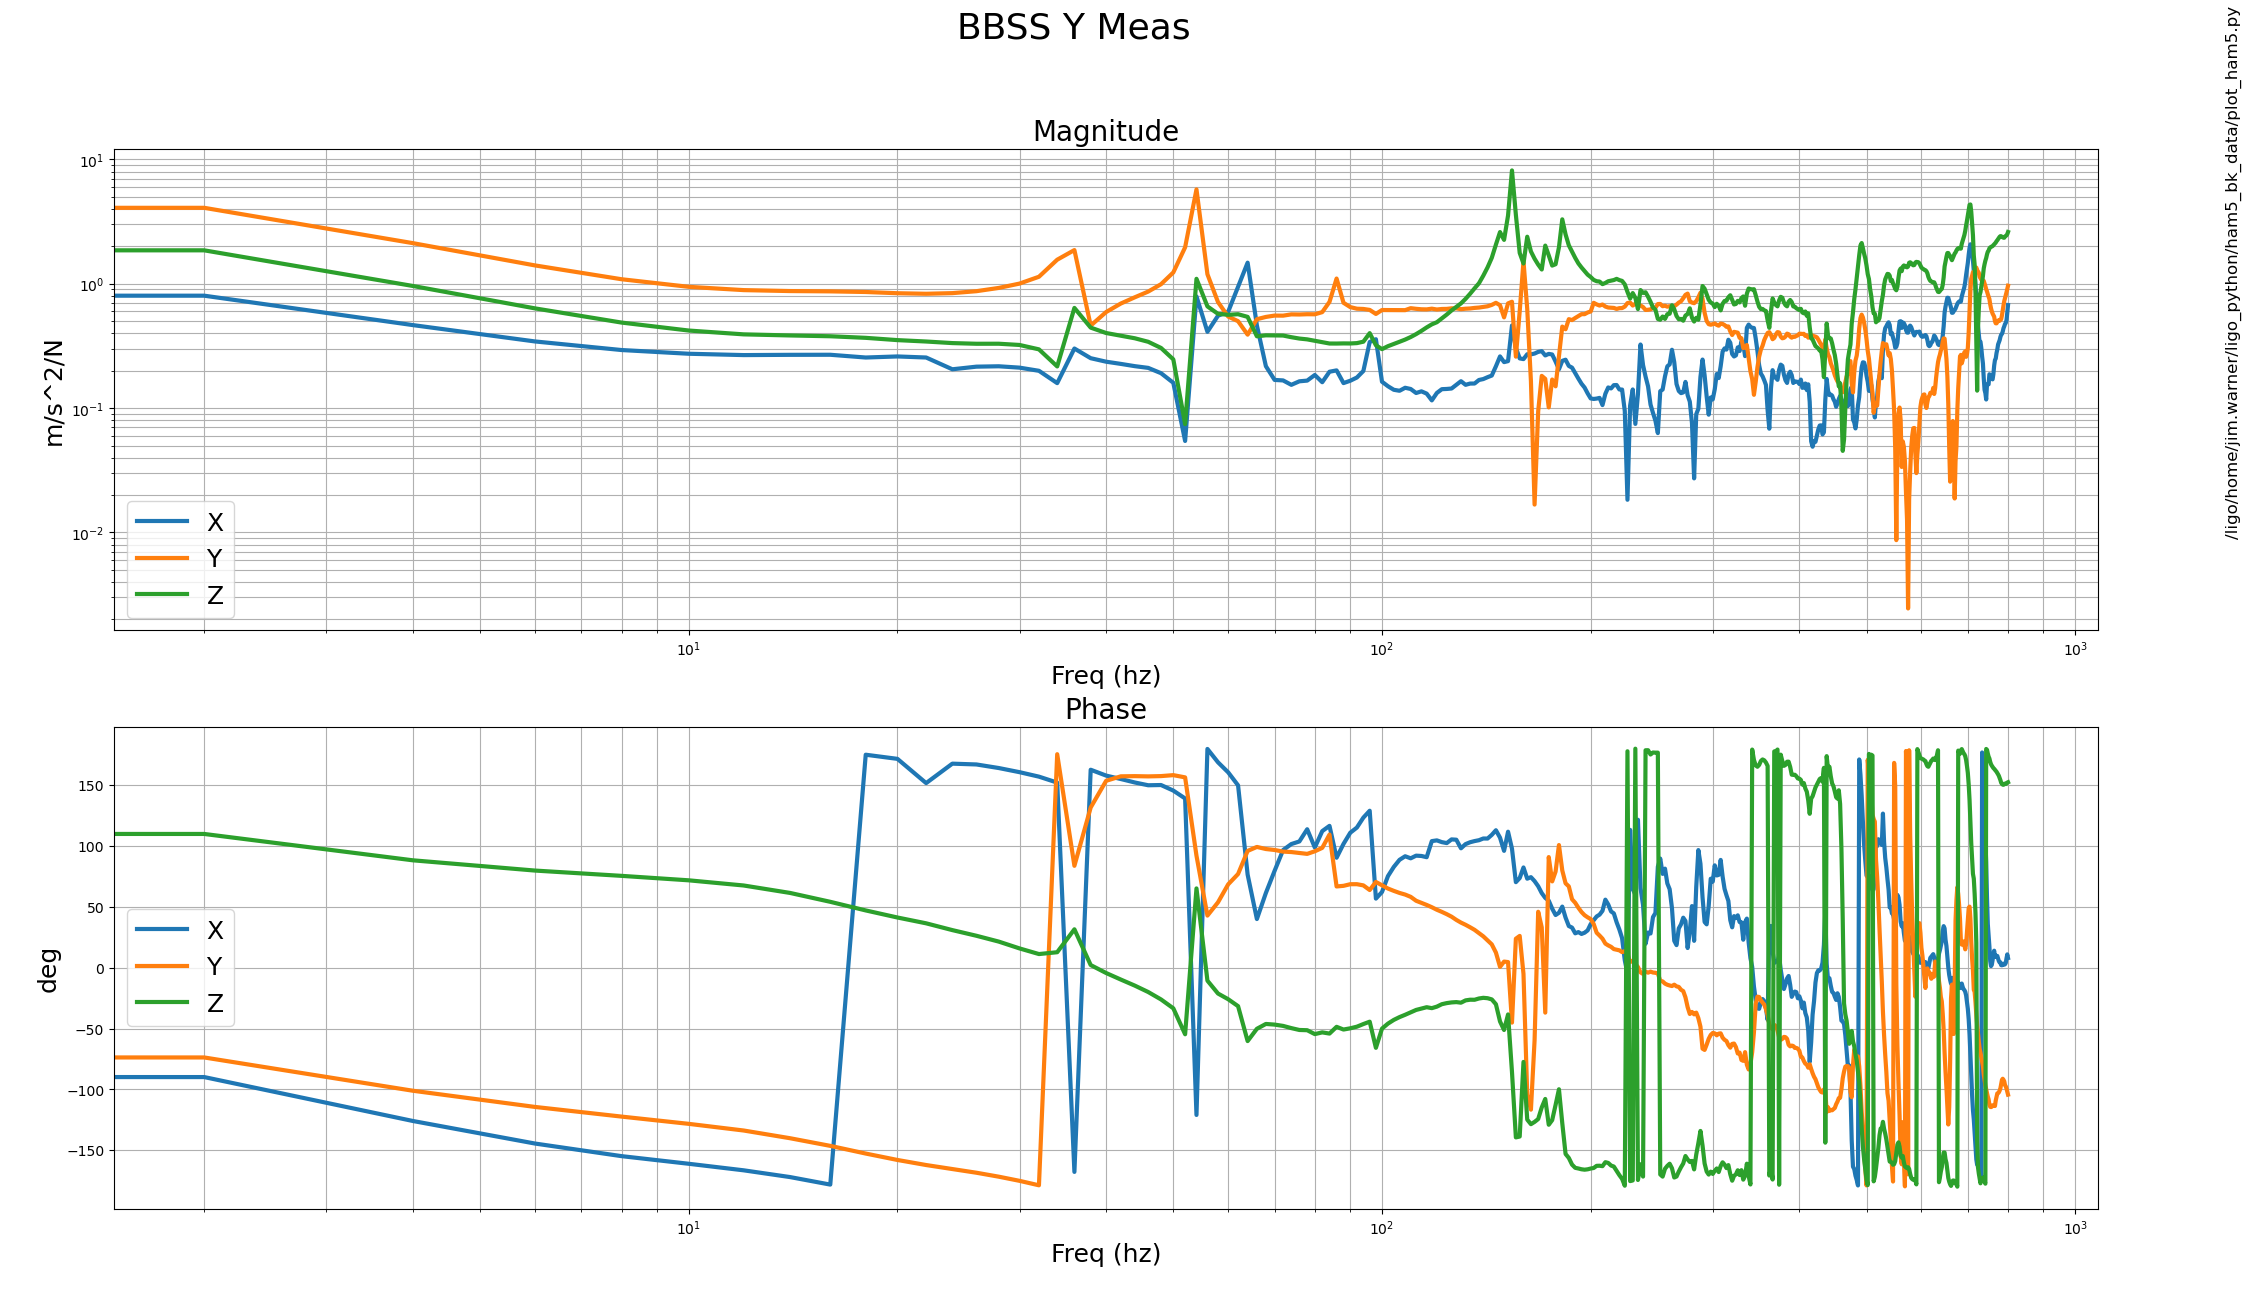
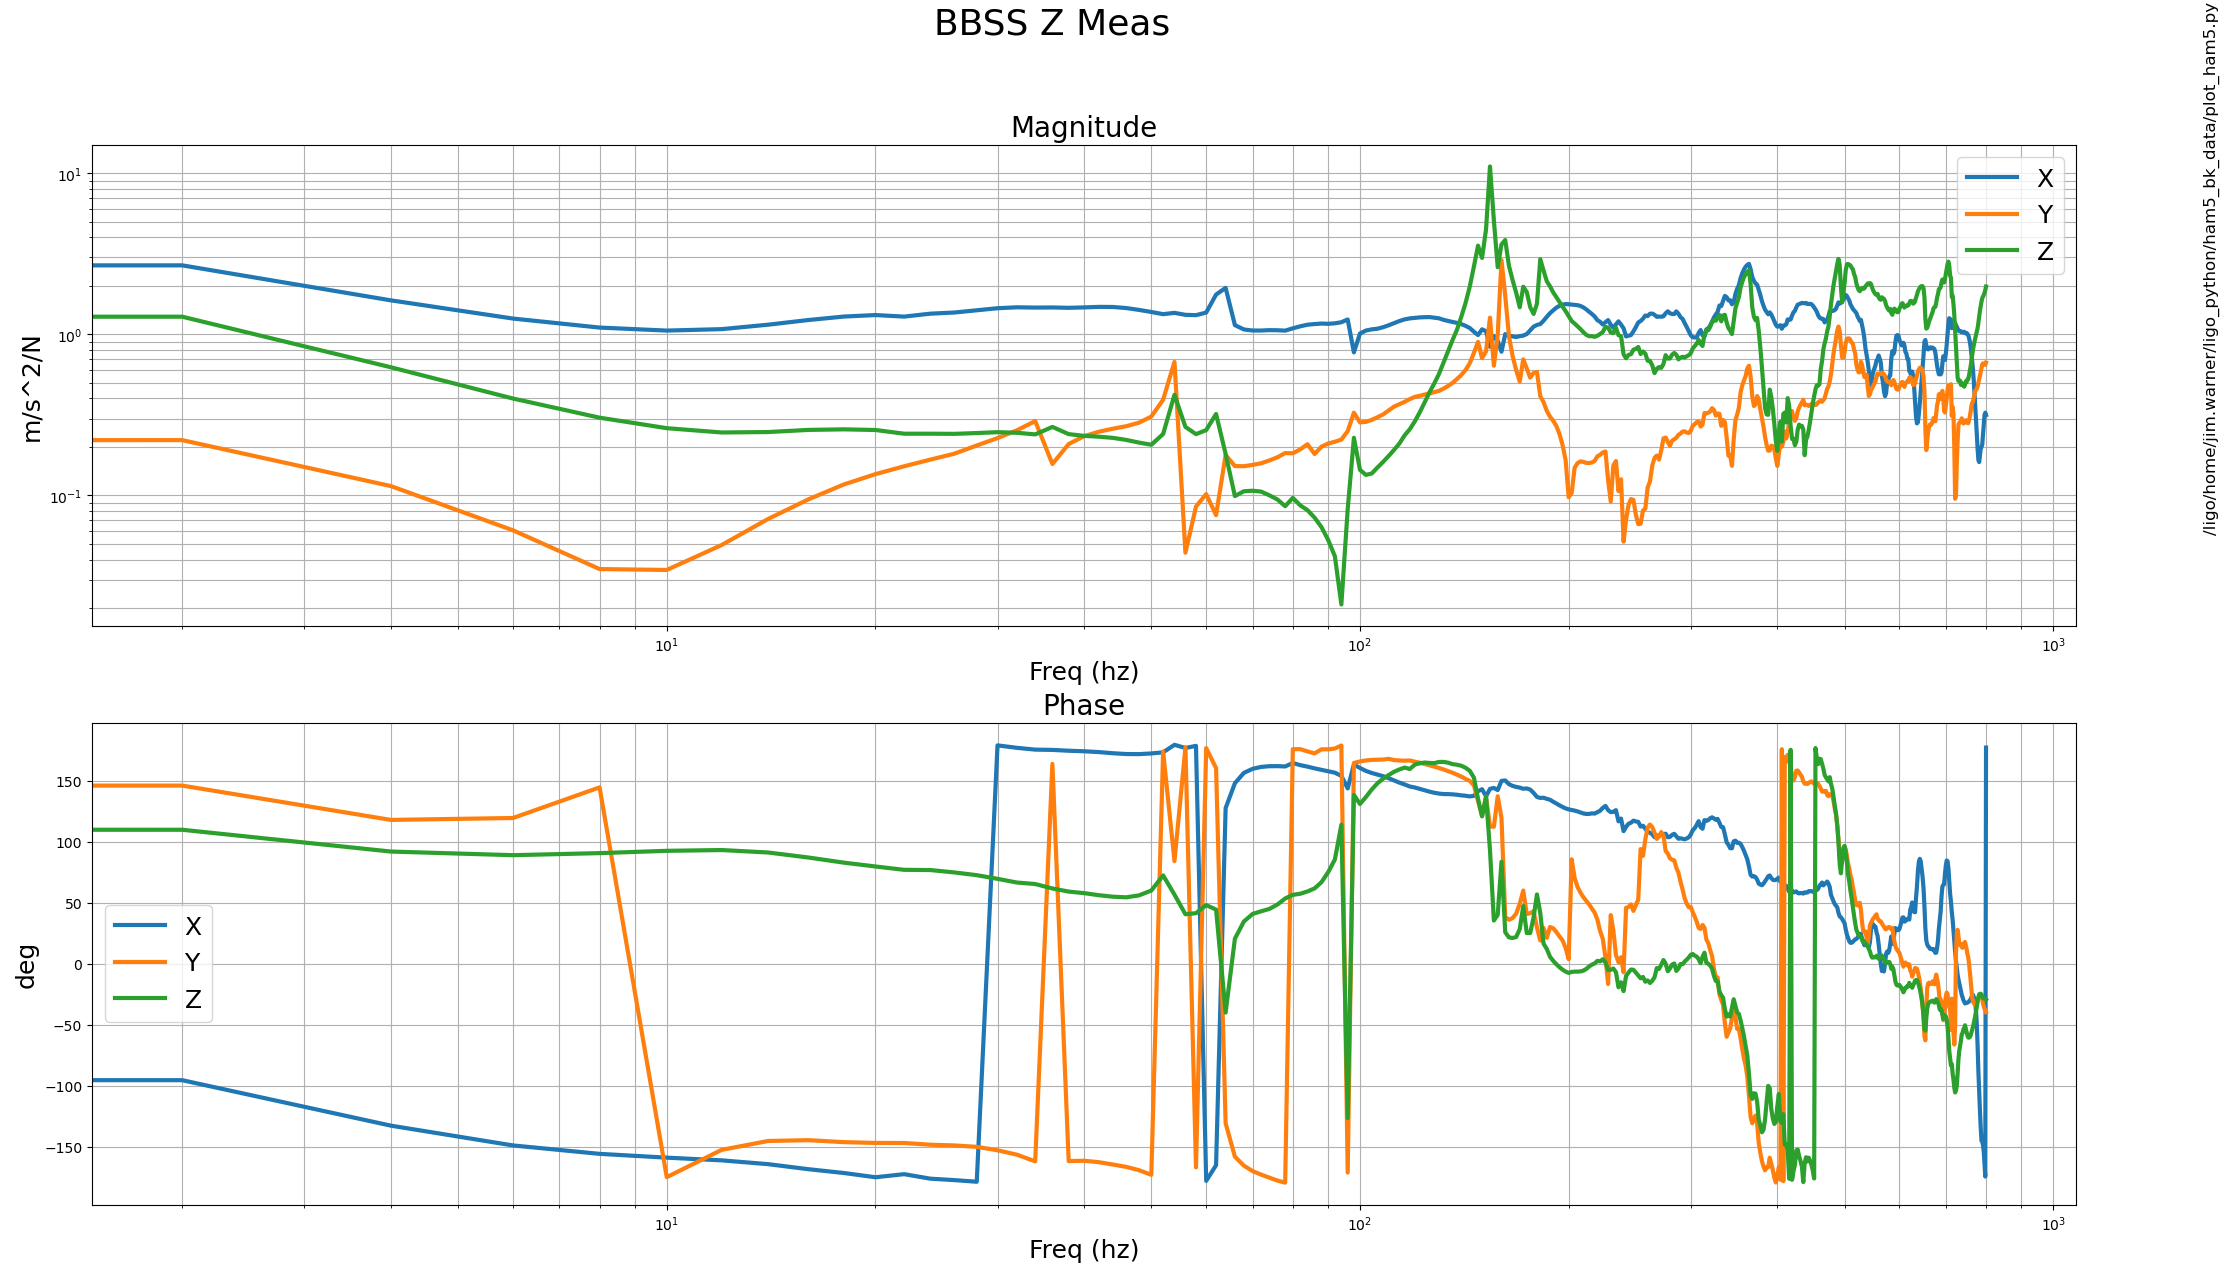
Betsy asked me to take a look at doing B&K measurements of the BBSS being assembled in the staging building, so I reminded myself how to use the B&K and took measurements this morning. I'll attach a photo shortly, but I put the accel on the very bottom of the cage, with +X axis aligned with optic longitudinal, Z aligned with is optic vertical, Y is optic transverse. Plots are titled with the accel axis that I hit on the suspension cage, while the legends are labeled with the accel axis response, so "BBSS X Meas" shows the X,Y,Z tf from hitting the cage along the accel X axis. These measurements are a kind of a mid point of the assembly, looks like most of the parts were there, but the bottom stage osems didn't have flags, I didn't see any vibration absorbers.
I think the most concerning thing I see is this 65-ish hz X mode on the first plot. It's the biggest peak and is in a band that could potentially really limit some of the ISI loop gains, if it's not well damped on the table.
A while ago I made a script to plot these measurements, but didn't explicitly say how to run it. Script is quick_plot.py is userapps/sys/h1/scripts/bruel_and_kjaer:
jim.warner@cdsws22:~ 0$ userapps
jim.warner@cdsws22:release 0$ cd sys/h1/scripts/bruel_and_kjaer/
jim.warner@cdsws22:bruel_and_kjaer 148$ ./quick_plot.py -t "BBSS Z Meas" -f "/path/to/data/BBSS_Z_meas.csv"