-Mattia, Sheila
We have written a python script to compute the full matrix of power spectral densities and cross-power spectral densities between a given channel, i.e., DARM, and a set of auxiliary channels. The code can be find at this repository https://git.ligo.org/mattia.emma/cross_psd which includes a README file describing how to run it.
The main arguments the user has to pass are the start time (in GPS time) and length of the data to retrieve from gwpy, a list of channel names and the starting frequency for the strain plots.
The code creates five different types of plots using the coherence and cross-power spectral density matrix. The final result of the code is a coefficient for each frequency value expressing the algebraic sum of the contributions of all the auxiliary channels to DARM considering the cross-power spectral density terms. It also computes the coherence between the single auxiliary channels and the DARM channel, which are the diagonal terms in the cross-power spectral density matrix.
The five kinds of plots are:
- The cumulative coherence. The sum of the coherence coefficients of the single auxiliary channels with DARM. As we add more and more channels to the sum, one can notice from the plot that the value of the cumulative coherence goes above one, which is unphysical. This motivates the inclusion of the cross-power spectral density terms to account for the correlation between the auxiliary channels.
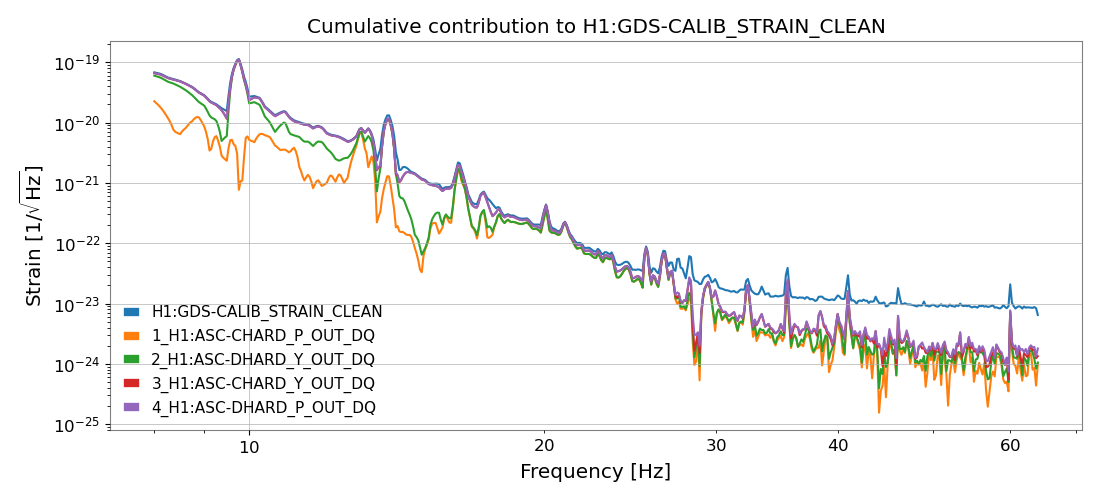
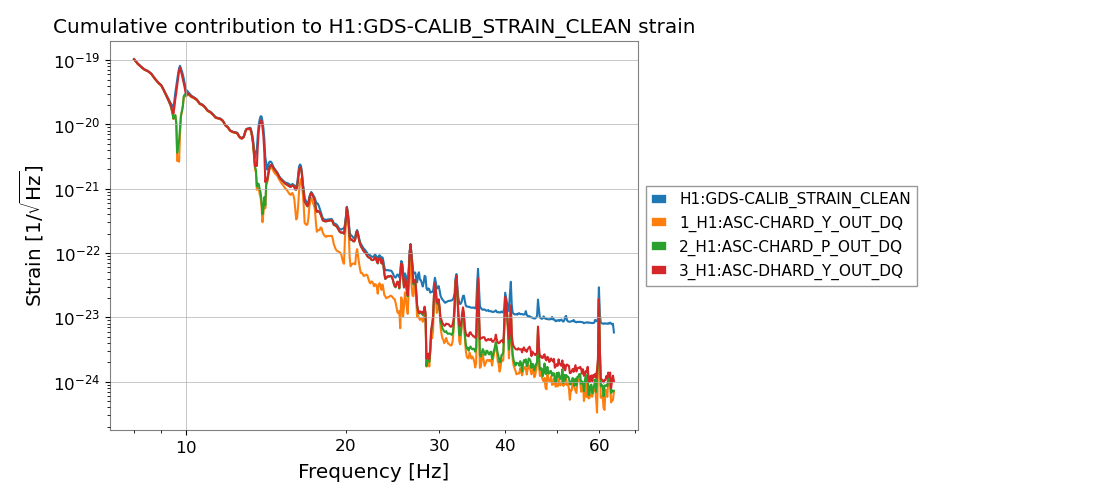
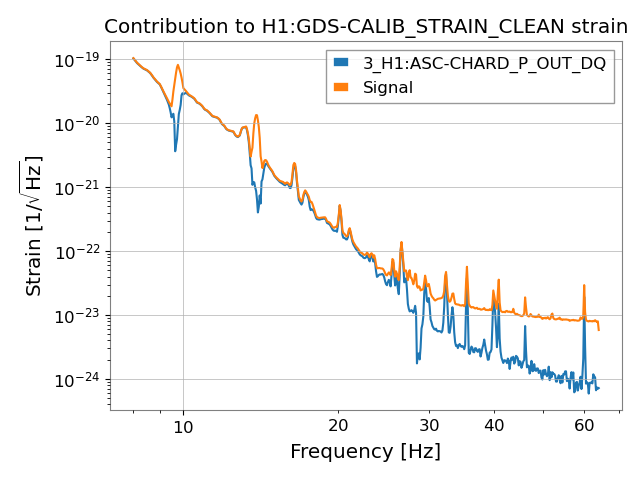
- The cumulative strain contribution. Plot of the DARM strain and the iterative contribution of the selected set of channels to the strain. For example 3_<Channel_name> means that the strain contribution was computed using three auxiliary channels and the added channel compared to the previous plot (2_<Channel_name>) is <Channel_name>. This plot has only two lines.
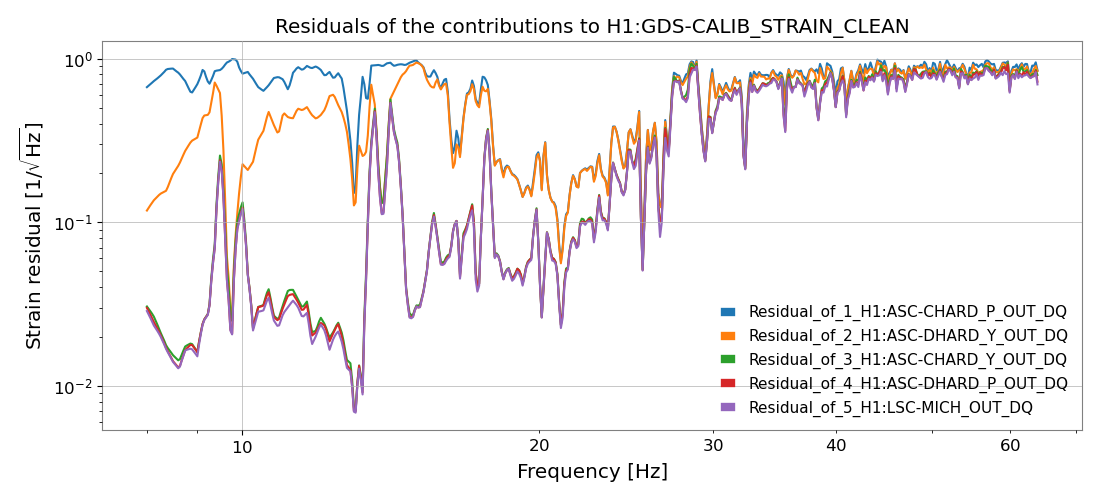
- Strain_<number>. Similar to 2 but with as many lines as in <number> plus the DARM strain to show how increasing the number of included channels saturates the DARM strain.
- Strain_comparison_<channel_name_1>_<channel_name_2>. Similar to 2 but including the DARM strain and only two lines. One showing the cumulative contribution to the strain until <channel_name_1> and one adding to this <channel_name_2>.
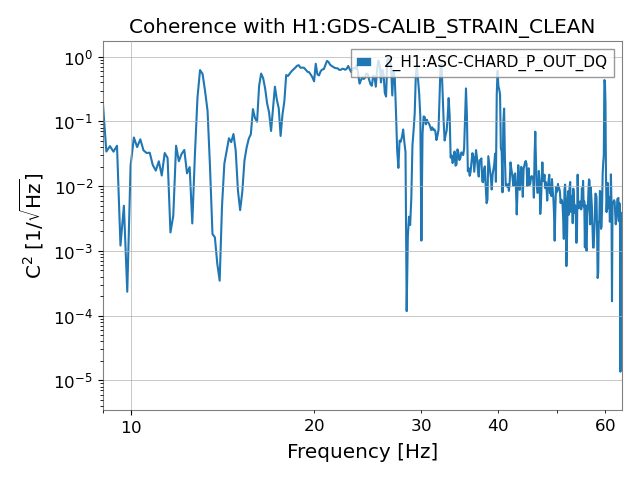
- Single_coherence_<channel_name>. A plot of the coherence between the DARM channel and the <channel_name>.
All of these plots can also be created using as a main channel any auxiliary channel instead of DARM, e.g., if one would like to study the correlation between auxiliary channels. Each plot name also includes the start and end GPS time of the data used for them.
Comments are welcome. As a next step we would like to implement interactive plots to allow the user to include/exclude lines from the plots.


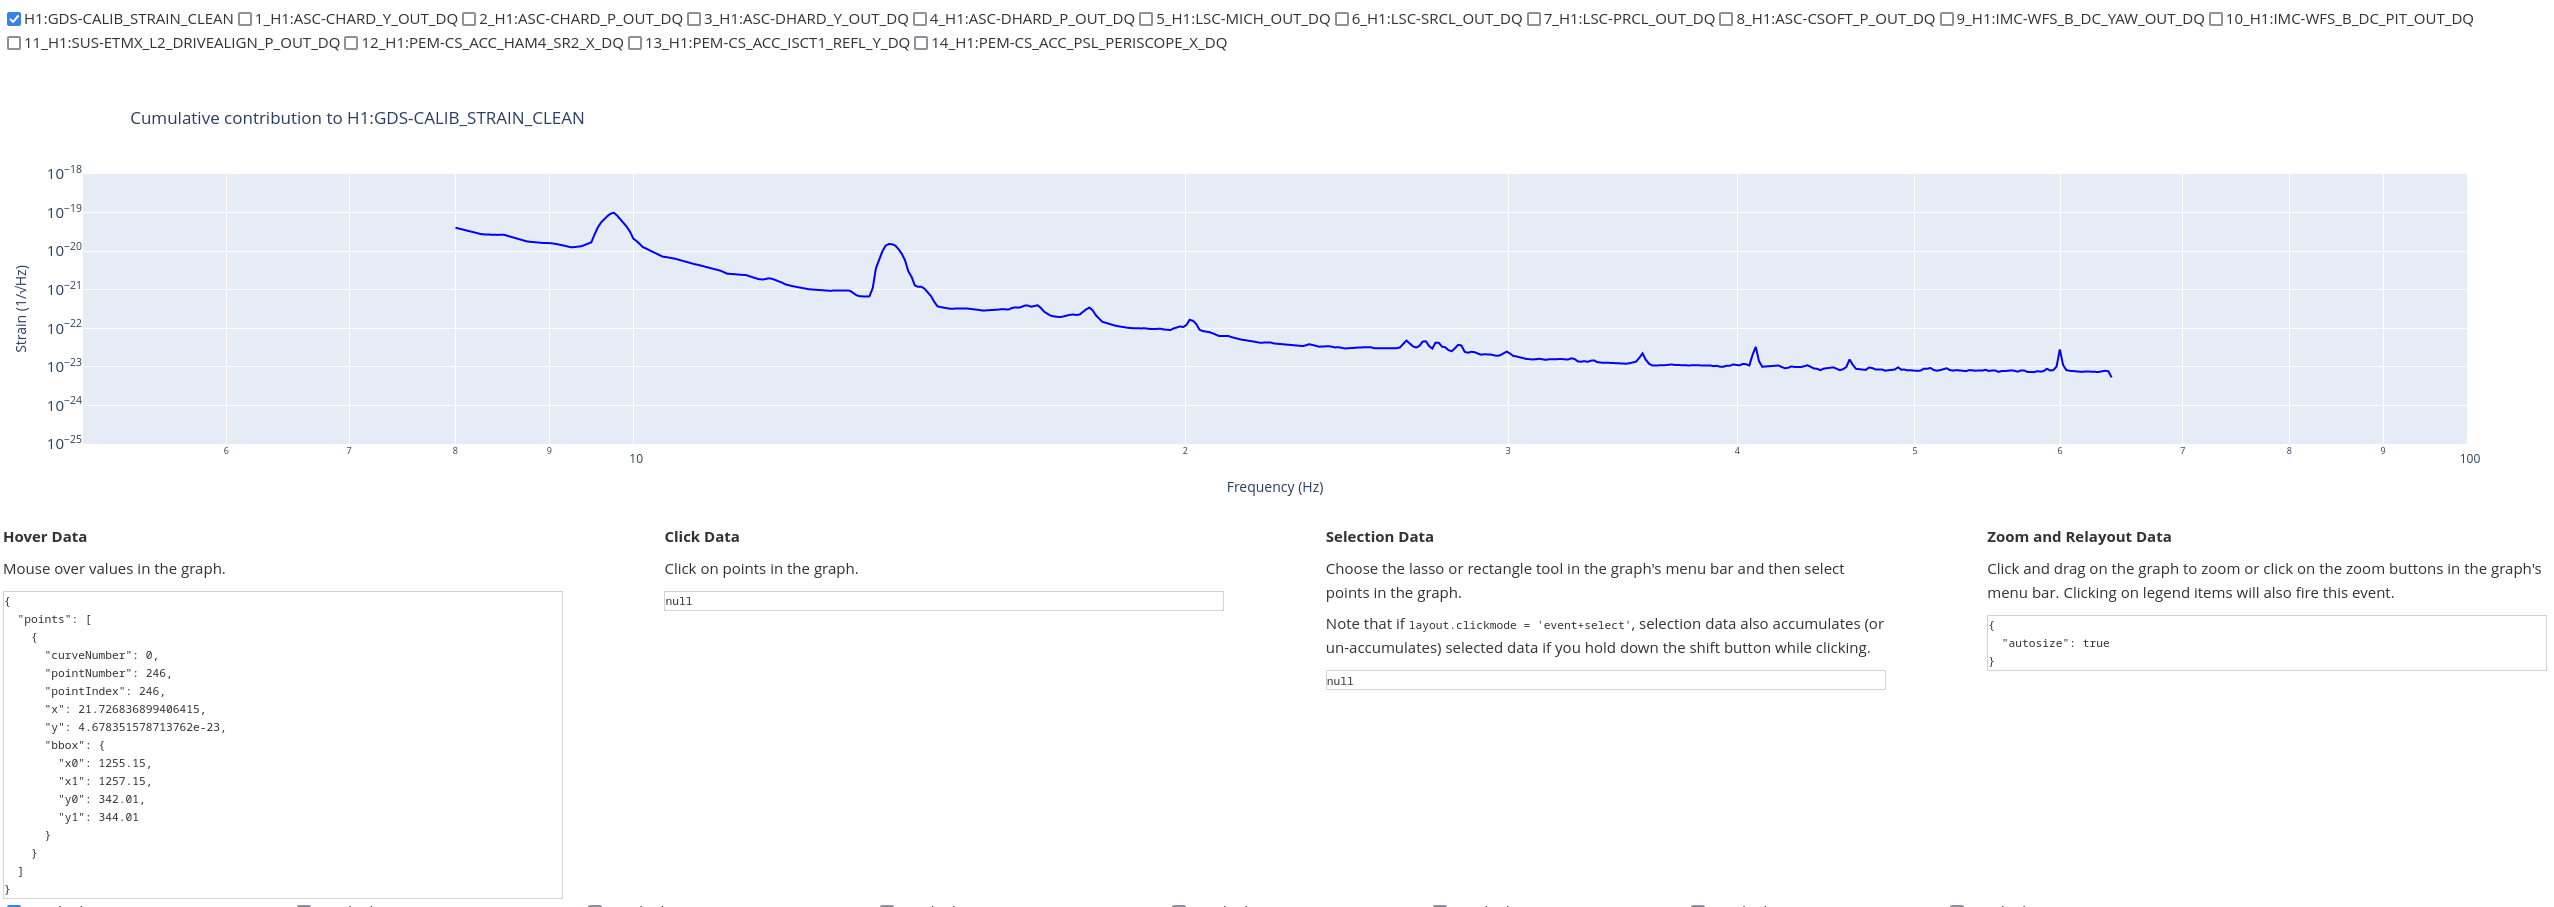
We have now added a code and instructions to the GitLab to obtain an interactive plot on one's local server.
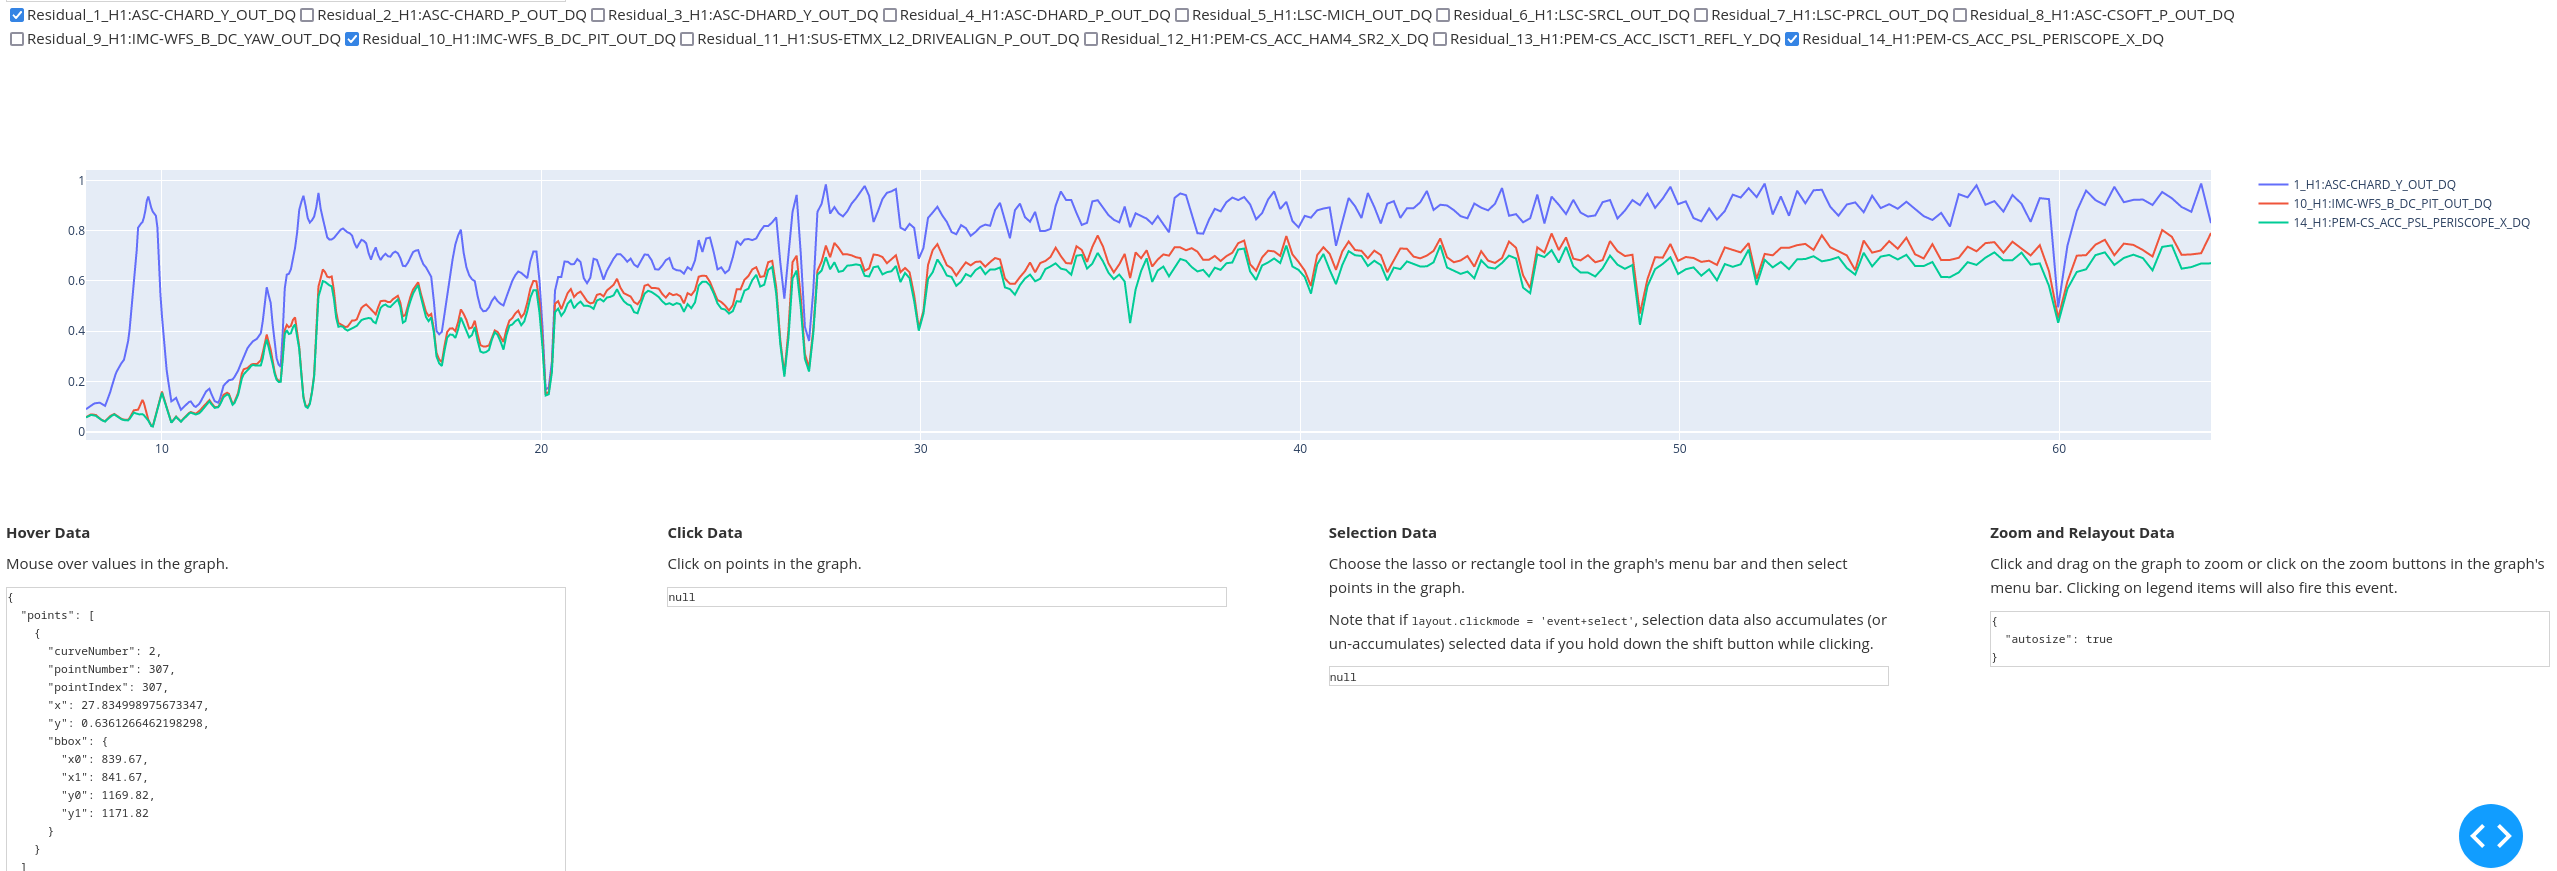
The webpage displays two plots as shown in the attached screenshots (third and fourth image) and allows the user to select which lines to show through a checklist. It is possible to save a screenshot of each plot, zoom-in and out, and hover over the data.
The two included plots are (1) a plot of the normalized residuals between the DARM noise and the cumulative strain contribution of the auxiliary channels , and (2) "Plot 2" from the above aLog, showing the cumulative contribution of the selected channels to the DARM noise.
The code is publicly accessible on GitLab at Cross_psd .