on Friday Kiwamu and stefan moved the tip tilts according to the calculation. Yesterday Stefan and I both remeasured these positions, what we got is that the distance from RM1 to RM2 is sqrt((17*2)^2+1^2)=34 inches. The distance from RM2 to M5 is sqrt((18*2)^2+6.5^2)=36.6 inches. We moved the BS for the refl LSC detector to 31 inches from M5.
When we first started making beam measurements we got some not repeatable results, because the beam was moving alot. With no one in the chamber or on the platform and the tip tilts damped we got repeatable results. With the mode master placed 22 inches from the beam splitter in this position we measured the beam using mode master ( we got a maximum gamma error). The result is in the attached photo P1000690.png. We also made measurements with the mode master 31 and 3/4 inches from the BS, this measurement is also attached as P1000689.png
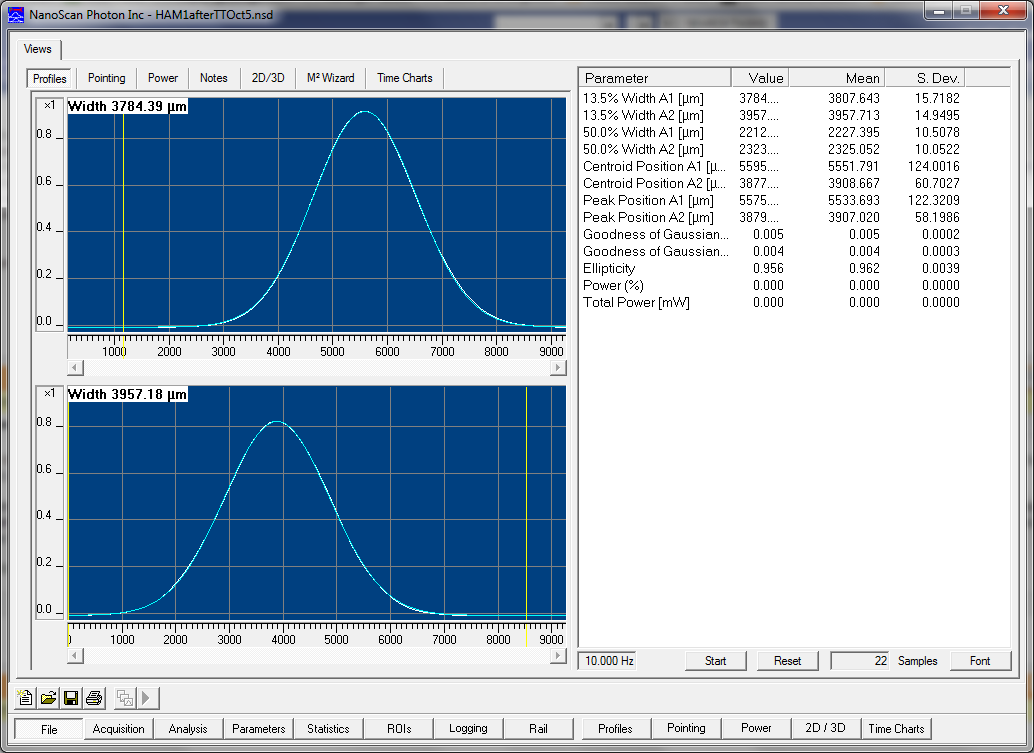
This afternoon we also used the nanoscan to measure the beam waist (with the BS in the same position). These are saved on the Nanoscan computer and I will add them to this post in the morning.
I have also attached some plots to help compare our measurements to each other and to Paul's calculated beam (and the script). Summary_Hor and Summary_Vert show Paul's calculation, our measurement before the TTs, and our two measurements after the TTs after we moved them to their current locations, with all of these beams propagated through the refl WFS path in HAM1. The magenta and green curves are the two mode master measurements made about a foot apart after the tip tilts, the green line is almost not visible because these two measurements agreed with each other. The plot shows each of these four beams propagated back to before any of the tip tilts, and compared to the nanoscan measurement we made before the tip tilts (the first tip tilt has been deleted to allow the comparison). The last plot shows all four of these beams compared to the nano scan measurements we made after the tip tilts (with L101 deleted). The nanoscan results are intermediate between Paul's calculation and our mode master measurement before the tip tilts.
The gouy phase separations based on each of these beams is:
| TT seperation hor | TT seperation vert | WFS seperation hor | WFS seperation vert | |
| Pauls calc | 85 | 84 | 89 | 90 |
| MM before TTs | 87 | 79 | 75 | 77 |
| MM after TTs1 | 57 | 43 | 88 | 81 |
| MM after TT2 | 57 | 42 | 88 | 81 |
So, although the agreement between our measurements (and calculation) aren't great, at least it seems clear that the gouy phase separations were improved by moving the tip tilts.