anthony.sanchez@LIGO.ORG - posted 14:32, Wednesday 09 October 2024 (80571)
Weekly In-Lock SUS Charge Measurements
FAMIS 28374 Weekly In-Lock SUS Charge Measurements
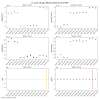
The nominal set of plots that the Famis task requests are plotted as usual.
ETMX looks fine
ETMY also looks fine
ITMX has a point on the plot that skews the plot so much that we cant really see any recent relative motion of the measurement.
Same thing happened with ITMY.
I'm not sure if this is actually useful.... so here are the same ones but only 4 months of data instead to get those really low ones off the plots.
4 Month ETMX
4 Month ETMY
4 Month ITMX
4 Month ITMY
Maybe this isn't useful to anyone but I was mildly interested.
Images attached to this report


