[Cheryl, Stefan, Sheila, Kiwamu, Joe, Paul]
The isolation ratio was calculated using both references for the rejected beam power (see Stefan's aLOG entry 7934), giving results different by 3dB.
Both are above the requirement of 30dB though.
The pick off beam splitter on the PSL table was characterized using power-meter measurements as follows:
Power in = 109.8mW
Power reflected = 38mW
Power transmitted = 67.8mW
R=0.3461
T=0.6175
L=0.0364
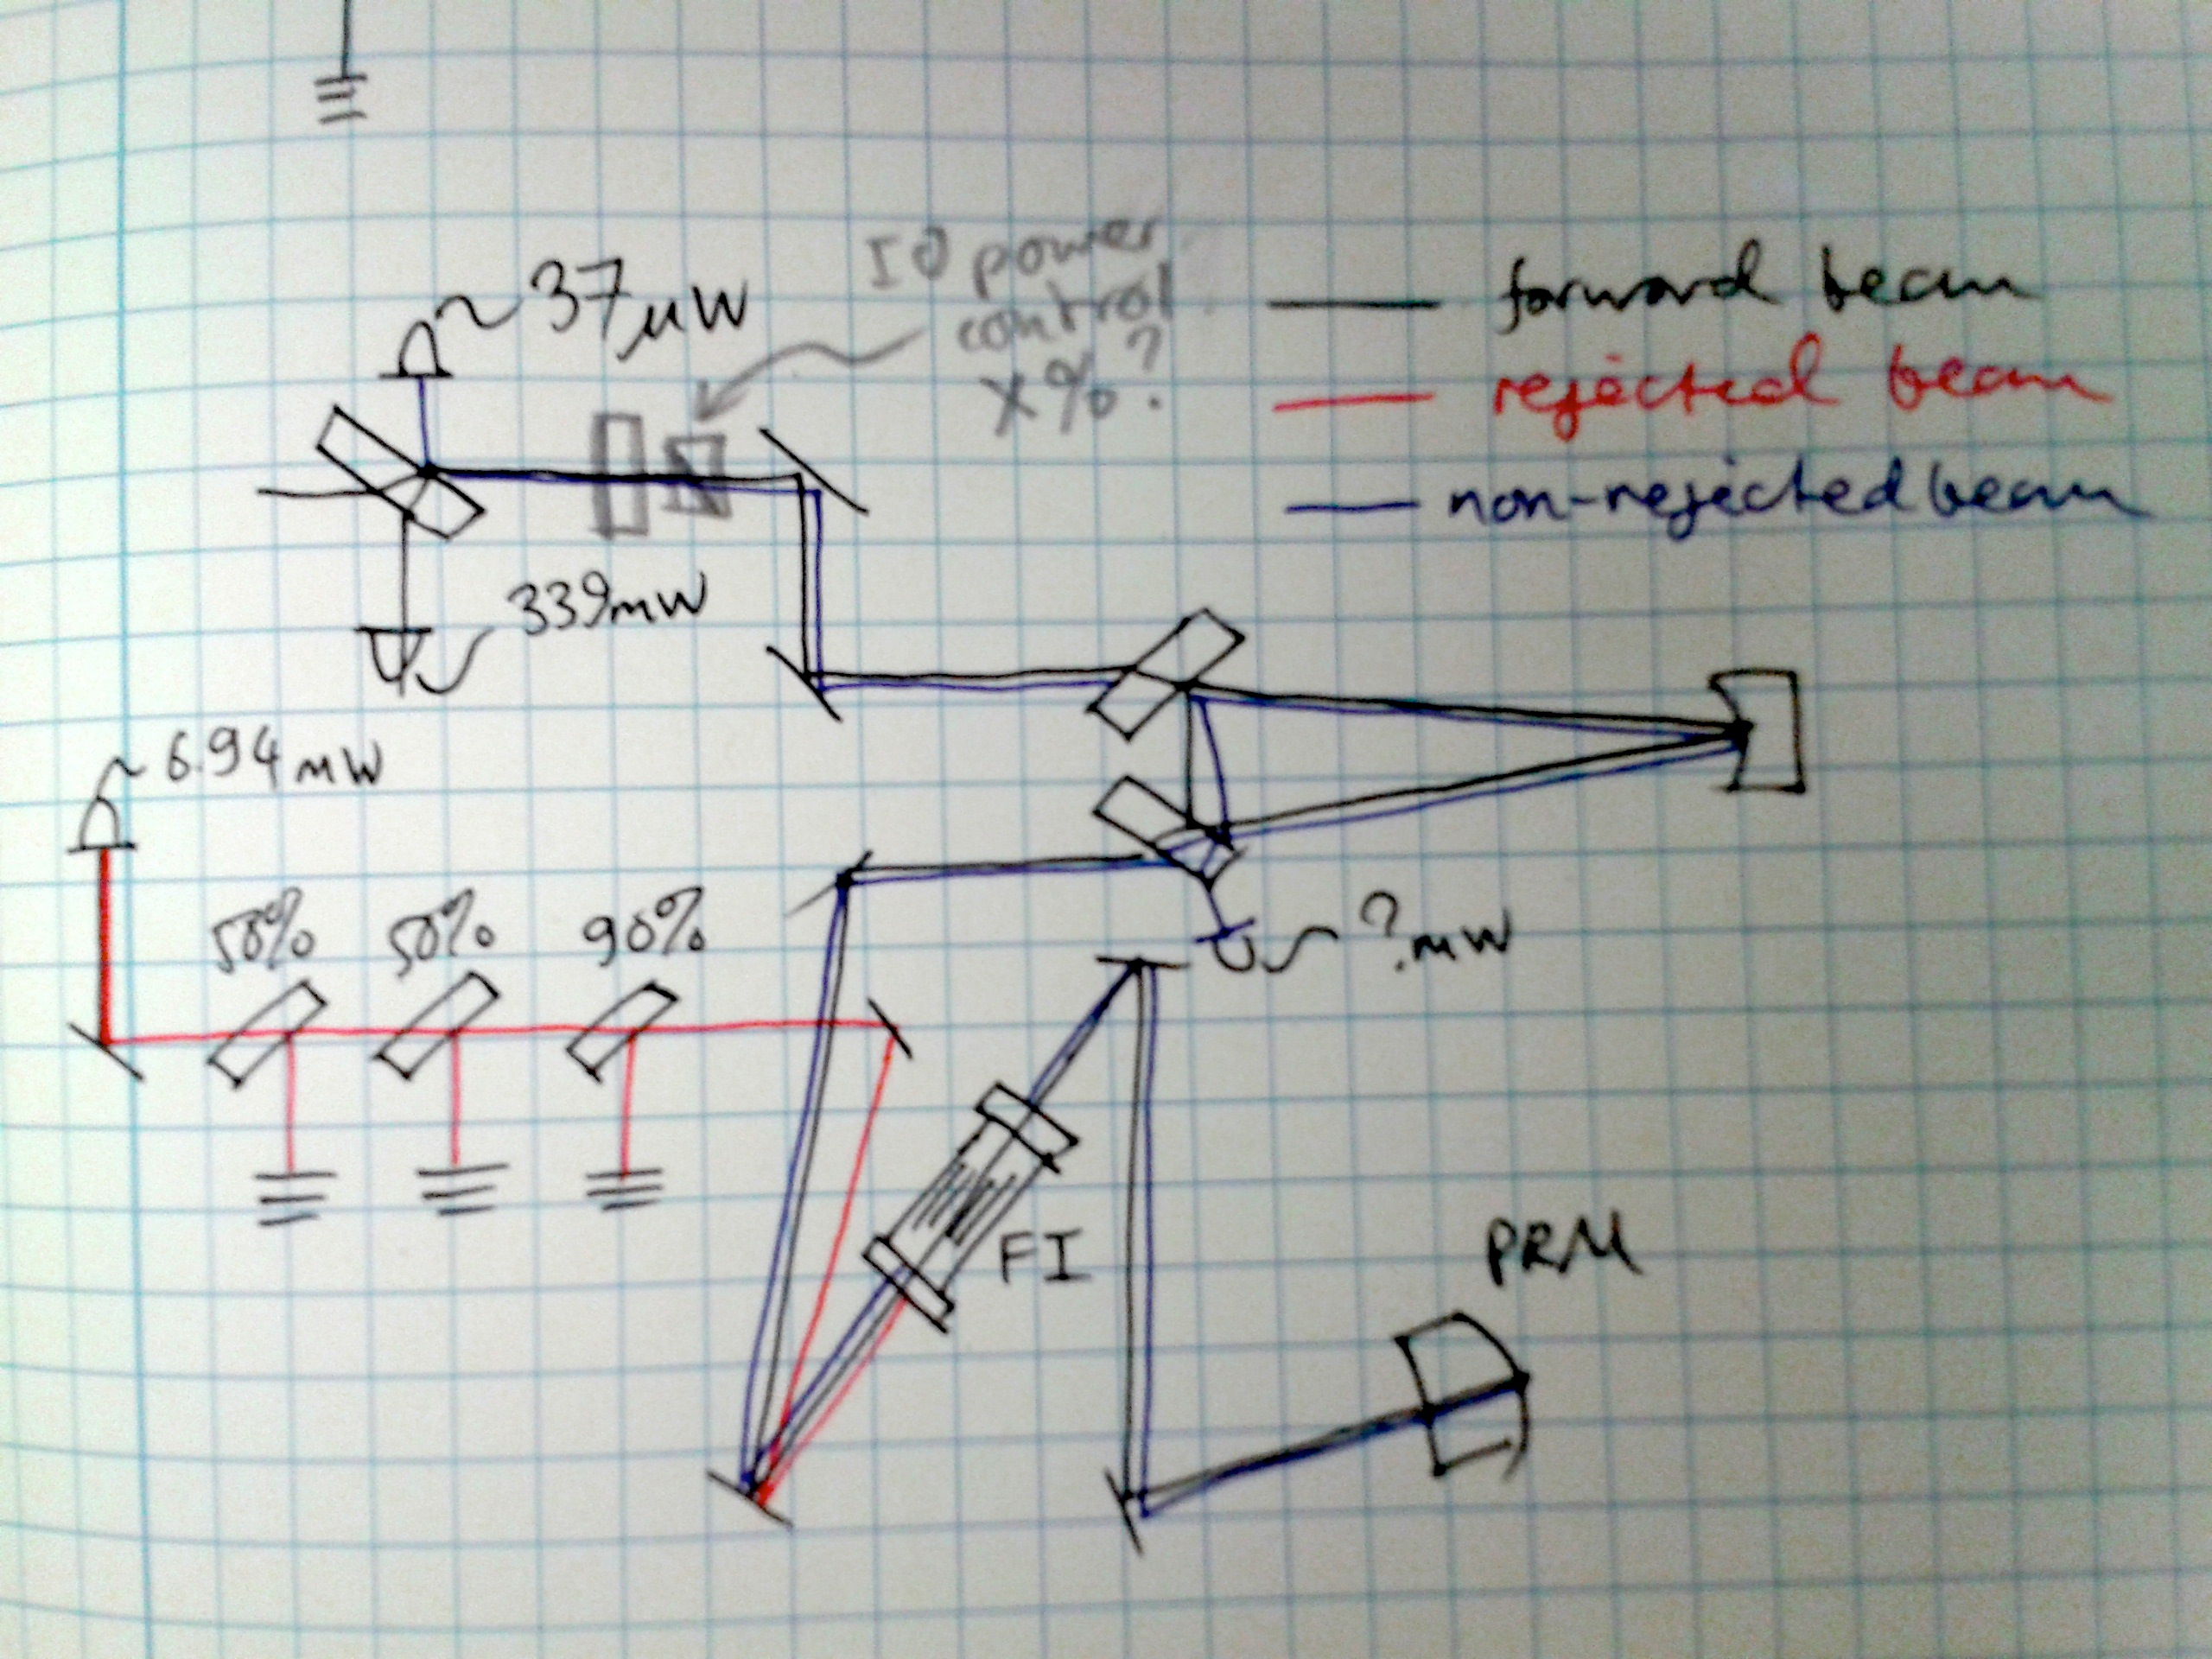
The first FI ratio calculation is made using the FI rejected beam power measurement on ISCT1 and the non-rejected beam power measurement on the PSL table.
In this case both measured beams pass forward through the IMC, through the FI, reflect off the PRM, and pass through the FI again before taking different paths (see attached drawing for measurement locations).
From this point, the rejected beam passes a R=90% BS and two 50% beam splitters before being measured on ISCT1. The power of the rejected beam just after the FI is therefore calculated as 6.94mW / 0.1 / 0.5 / 0.5 = 277.6mW. This is actually rather low considering that the power into the IMC should be around 555mW (1000mW*0.9*0.6175). Perhaps there was another 50% beamsplitter unaccounted for in the path somewhere? It's possible that some power is lost in the power control stage on the PSL just before the periscope, but I didn't think it shouldn't be as much as 50%. In this calculation, however, the isolation ratio inferred is unaffected by any loss at the power control stage because that stage is common to both the non-rejected and the rejected beams.
After returning through the FI, the non-rejected beam passes backwards through the IMC. The forward throughput efficiency of the IMC is taken as 94.25%, obtained from observing trends in the IMC REFL PD power (though this does not account for losses inside the IMC). The return efficiency is taken as the forward efficiency multiplied by the average x/y overlap of 94% between the measured mode in HAM1 (see entry 9750 and comments).
The beam then passes back through to the PSL and is reflected off the 34.6% reflective pick off BS. The beam does pass back through the power control stage, however it should have optimal polarization to pass this stage with high-efficiency, so this is not taken into account here.
The non-rejected beam power just after the FI is therefore calculated as 37uW / 0.9425 / 0.94 / 0.3461 = 123uW.
FI isolation ratio = -10*log10( non-rejected power / rejected power) = -10*log10( 123e-6 / 277.6e-3 ) = 33.5 dB
The second calculation is made using the other measurement of the input beam power on the PSL along with the non-rejected beam power measurement on the PSL table.
The non-rejected beam just after the FI is the same as before: 37uW / 0.9425 / 0.94 / 0.3461 = 123uW
From the PSL pick off beam splitter direct reflection point to just after the FI on the return path from the PRM, the rejected beam passes the pick-off BS (picking up a factor T/R = 1.7842 in power from the measurement point), the IMC in forward transmission (94.25% throughput), the FI (97.8%), reflects off the PRM (96.9%), and passes the FI again (97.8%).
The rejected beam power just after the FI is therefore calculated as 339mW / 0.3461 * 0.6175 * 0.9425 * 0.978 * 0.969 * 0.978 = 528mW
Calculating the isolation ratio with these numbers gives us:
FI isolation ratio = -10*log10( non-rejected power / rejected power) = -10*log10( 123e-6 / 528e-3 ) = 36.4 dB
This is quite a significant discrepancy between the two values for the isolation ratio. I am more confident in the 33.5 dB number though, because the measured beam paths have more in common in that case (especially the final power control stage). The 36.4 dB number is susceptible to any other losses in the IMC input beam path, such as the final power control stage before the periscope.