D. Davis, E. Capote, O. Patane
There was a discussion recently in the Detchar tools channel about how to interpret the cumulative range plots generated on the summary pages, such as today's cumulative range plot. Specifically, it seems incorrect that we could accumulate 30% of our range below 30 Hz.
Derek has pointed out that this is so misleading because the calculation of cumulative range in this manner is actually performed somewhat incorrectly. In short, range can be thought as analogous to SNR, which is a quantity that must be added in quadrature. Therefore, the order matters when calculating a cumulative range, i.e. the range acquired from 10-20 Hz, then 10-30 Hz, 10-40 Hz, etc. Therefore, the total cumulative range number, as in the one we think about all the time (160 Mpc, for example) is correct, but determining the range over a subset of the band (such as 10-30 Hz) needs to be done more carefully so it is not misleading.
Once we started discussing this, I pointed out that this means that the way we compare ranges is also misleading, as in when we run our DARM integral comparison scripts, we are subtracting the cumulative range of two different DARM PSDs, but we subtract it in amplitude (Mpc) and not in quadrature (Mpc^2).
Derek has created an improved way to calculate cumulative range, which they have coined to be the "cumulative normalized range". To get right to the point: it is better to normalize the cumulative range squared by the total range. This is an example plot showing how these two differ. This plot shows that for a given DARM PSD, the cumulative normalized range better estimates the sensitivity gained over a particular range of frequency. The low frequency portion is still very important (this results from the f^(-7/3) dependence in the range calculation), but indeed we gain very little sensitivity between 10-20 Hz, for example. You can also see that, when using the normalized method, the curve where you integrate up in frequency and the curve where you integrate down in frequency intersect at about 50% of the range, which is what you would expect.
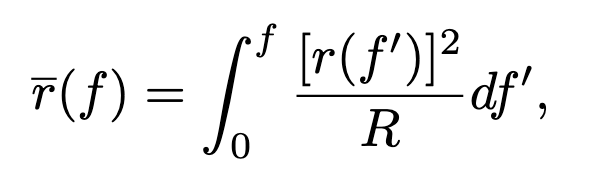
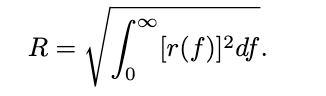
In equation form, this image attachment defines the total cumulative range, and this image attachment shows our defintion of the normalized cumulative range.
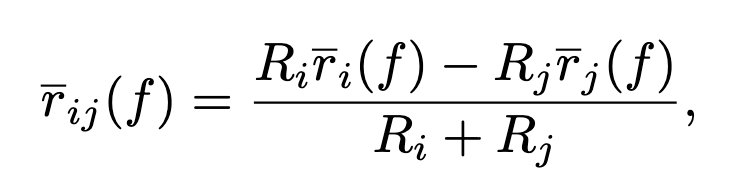
In order to more sensibly compare two sensitivities by frequency, we have also derived a way to calculate the cumulative normalized range difference. The derivation is slightly more complicated, but the result is that you subtract the two cumulative normalized quantities, and then normalize by the sum of the two ranges.
This image attachment shows the equation form of this.
To make sense of why this method is better than the method we use now, you can imagine that we have two PSDs, one with 100 Mpc of range, and one that is exactly the same, except that between 10-20 Hz there is an additional gain of 20 Mpc, such that the total range is now 120 Mpc. If you compare these two bizarre PSDs, you would expect that the cumulative range difference between the two from 10-20 Hz is 20 Mpc, and then zero thereafter. This is an example plot showing how the cumulative range difference would appear, using the method where you subtract the two cumulative ranges, and then the method where you apply this normalized range method. The normalized range calculation behaves as expected, while the method that straightforwardly subtracts the two cumulative ranges overshoots the range gain from 10-20 Hz, and then misleadingly indicates the range is decreasing above 20 Hz to make up for it.
There is a lot of information to grasp here, and Derek and I will be posting a document to the DCC soon with a fuller explanation and full derivations. Oli has taken the time to implement these new methods in our DARM comparison scripts, and they will follow up here with more information about that.


As a start, I've only corrected these things in the range_compare script that I previously made based off of the Hanford Noise Budget darm_integral_compare script (81015). This script that I made is a simplified version of the script used for creating NoiseBudget plots so I thought it would be a good start to making these changes. There are also plans to correct the the calculations in other places (summary pages and the official NoiseBudget scripts for example).
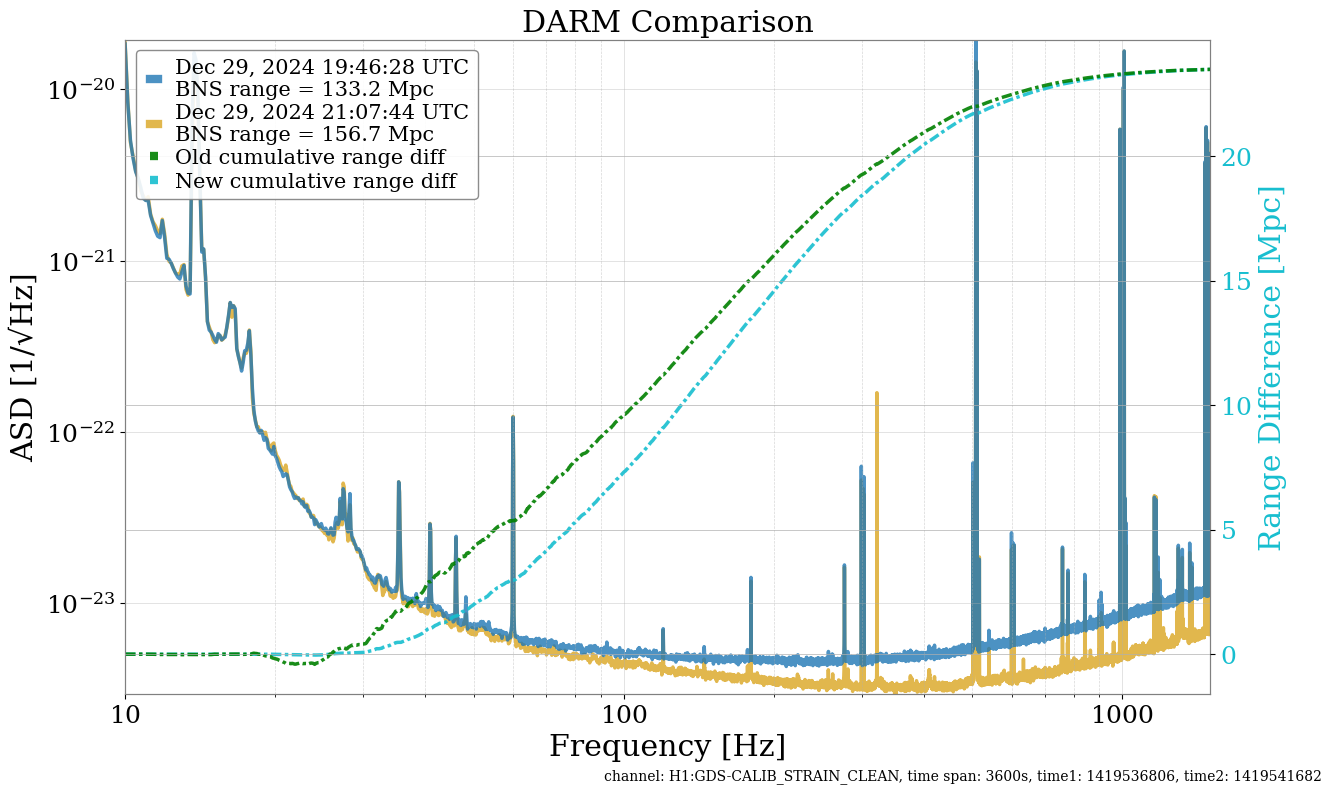
All changes have been committed to git and are up to date in gitcommon/ops_tools/rangeComparison/. In addition to the changes necessary to correct the cumulative range plots, I also swapped out the way we were grabbing data so it now uses GWPy, and I added in an additional plot that shows the cumulative sum of the range over frequency. Here's an comparison of the old vs new cumulative range
Derek and I have just updated a document to the DCC with a full workup of this change and some fun examples, see P2500021.