LHO EndX measurement made today.
python3 generate_measurement_data.py --WS "PS4" --date "2024-09-23"
Reading in config file from python file in scripts
../../../Common/O4PSparams.yaml
PS4 rho, kappa, u_rel on 2024-09-23 corrected to ES temperature 299.3 K :
-4.711436365635769 -0.0002694340454223 4.121866697713714e-05
Copying the scripts into tD directory...
Connected to nds.ligo-wa.caltech.edu
martel run
reading data at start_time: 1416675755
reading data at start_time: 1416676330
reading data at start_time: 1416676692
reading data at start_time: 1416677299
reading data at start_time: 1416677800
reading data at start_time: 1416678168
reading data at start_time: 1416678360
reading data at start_time: 1416679388
reading data at start_time: 1416679723
Ratios: -0.46161620922202573 -0.46631546727413287
writing nds2 data to files
finishing writing
Background Values:
bg1 = 9.175134; Background of TX when WS is at TX
bg2 = 5.161980; Background of WS when WS is at TX
bg3 = 9.165405; Background of TX when WS is at RX
bg4 = 5.151518; Background of WS when WS is at RX
bg5 = 9.191307; Background of TX
bg6 = 0.664785; Background of RX
The uncertainty reported below are Relative Standard Deviation in percent
Intermediate Ratios
RatioWS_TX_it = -0.461616;
RatioWS_TX_ot = -0.466315;
RatioWS_TX_ir = -0.456051;
RatioWS_TX_or = -0.461524;
RatioWS_TX_it_unc = 0.086881;
RatioWS_TX_ot_unc = 0.091151;
RatioWS_TX_ir_unc = 0.097094;
RatioWS_TX_or_unc = 0.089816;
Optical Efficiency
OE_Inner_beam = 0.988013;
OE_Outer_beam = 0.990086;
Weighted_Optical_Efficiency = 0.989049;
OE_Inner_beam_unc = 0.060350;
OE_Outer_beam_unc = 0.060428;
Weighted_Optical_Efficiency_unc = 0.085403;
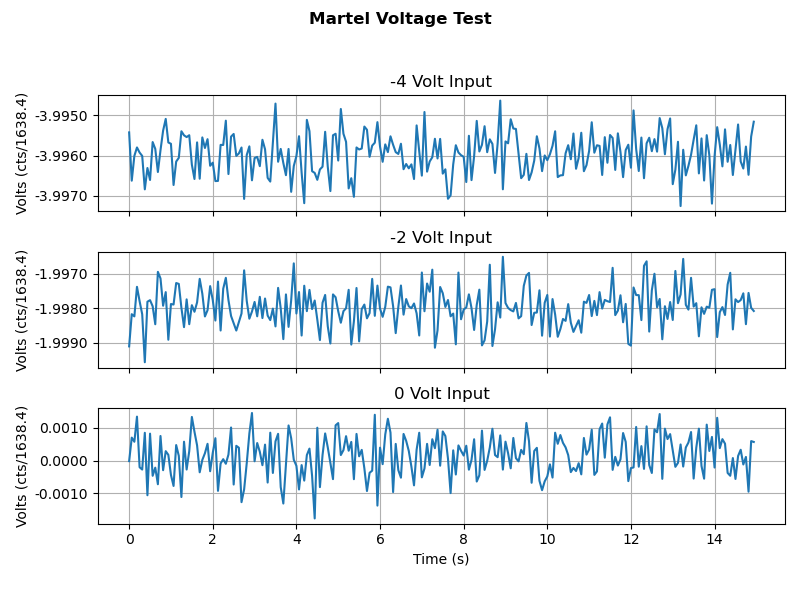
Martel Voltage fit:
Gradient = 1636.718975;
Intercept = 0.130679;
Power Imbalance = 0.989923;
Endstation Power sensors to WS ratios::
Ratio_WS_TX = -1.077666;
Ratio_WS_RX = -1.392000;
Ratio_WS_TX_unc = 0.054228;
Ratio_WS_RX_unc = 0.043548;
=============================================================
============= Values for Force Coefficients =================
=============================================================
Key Pcal Values :
GS = -5.135100; Gold Standard Value in (V/W)
WS = -4.711436; Working Standard Value
costheta = 0.988362; Angle of incidence
c = 299792458.000000; Speed of Light
End Station Values :
TXWS = -1.077666; Tx to WS Rel responsivity (V/V)
sigma_TXWS = 0.000584; Uncertainity of Tx to WS Rel responsivity (V/V)
RXWS = -1.392000; Rx to WS Rel responsivity (V/V)
sigma_RXWS = 0.000606; Uncertainity of Rx to WS Rel responsivity (V/V)
e = 0.989049; Optical Efficiency
sigma_e = 0.000845; Uncertainity in Optical Efficiency
Martel Voltage fit :
Martel_gradient = 1636.718975; Martel to output channel (C/V)
Martel_intercept = 0.130679; Intercept of fit of Martel to output (C/V)
Power Loss Apportion :
beta = 0.998895; Ratio between input and output (Beta)
E_T = 0.993960; TX Optical efficiency
sigma_E_T = 0.000424; Uncertainity in TX Optical efficiency
E_R = 0.995060; RX Optical Efficiency
sigma_E_R = 0.000425; Uncertainity in RX Optical efficiency
Force Coefficients :
FC_TxPD = 7.886467e-13; TxPD Force Coefficient
FC_RxPD = 6.173183e-13; RxPD Force Coefficient
sigma_FC_TxPD = 5.464959e-16; TxPD Force Coefficient
sigma_FC_RxPD = 3.784130e-16; RxPD Force Coefficient
data written to ../../measurements/LHO_EndX/tD20241126/
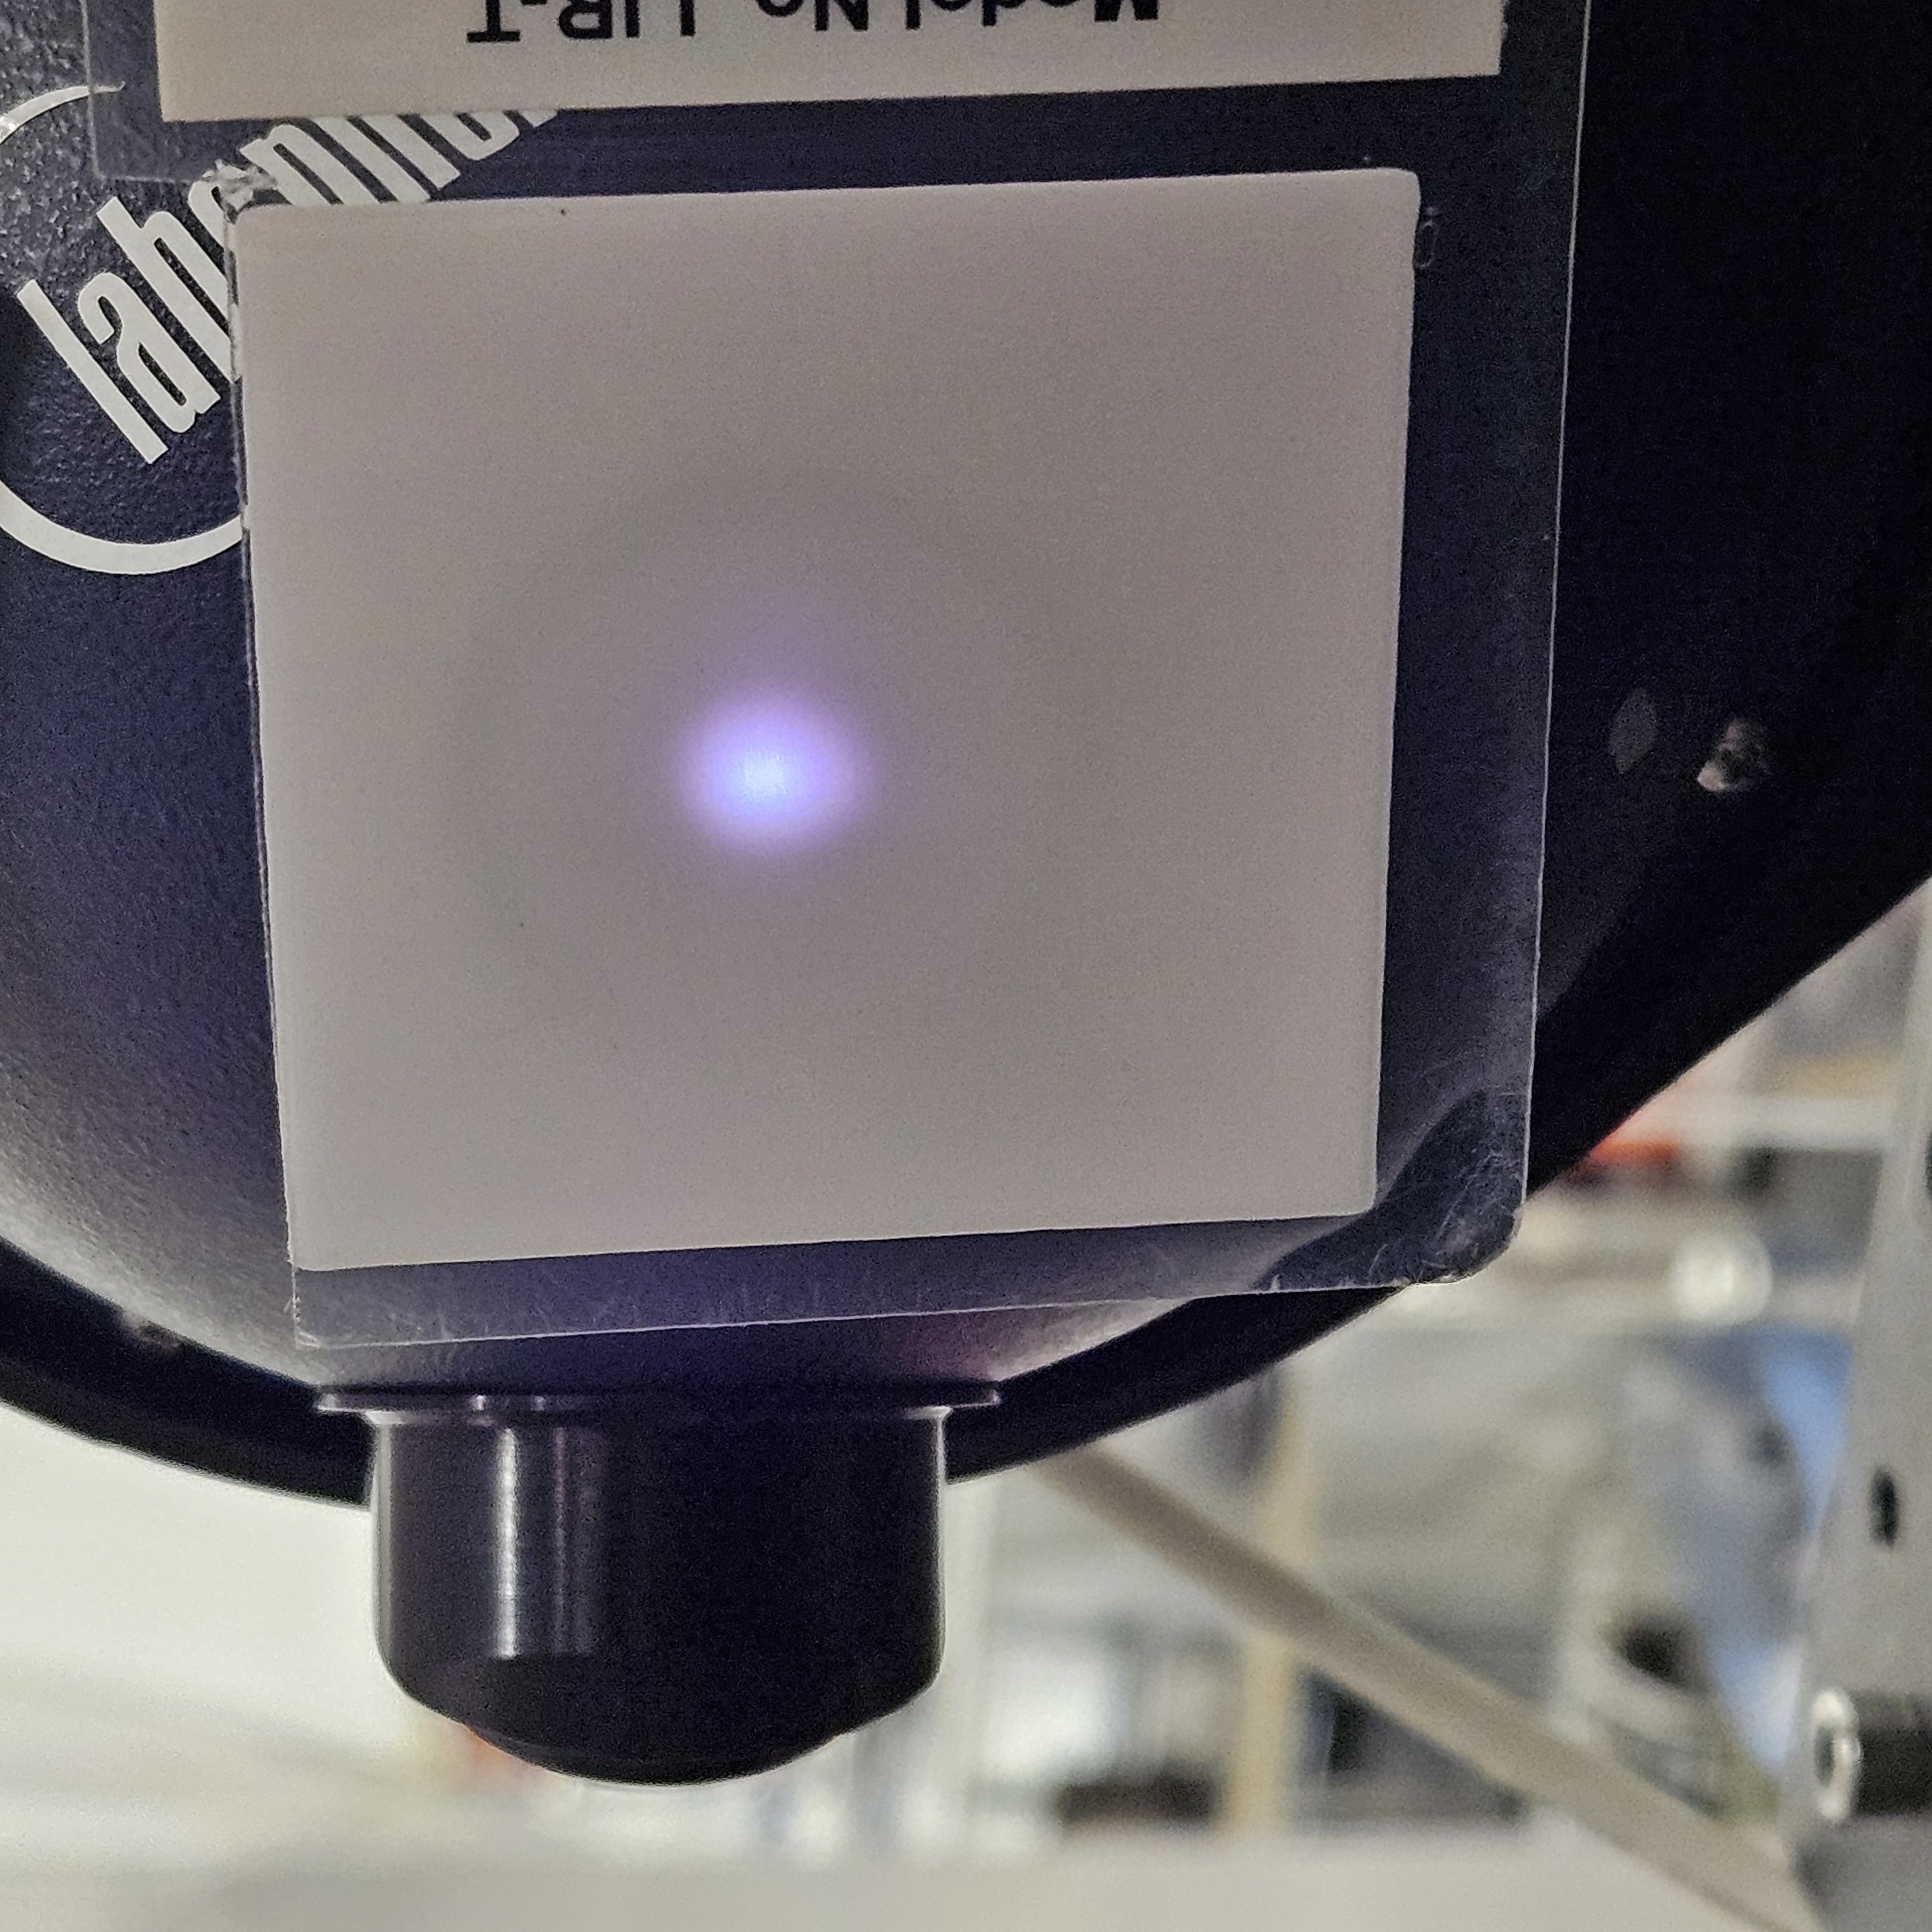
Beam Spot
T1500062 procedure measurement and log
Martel
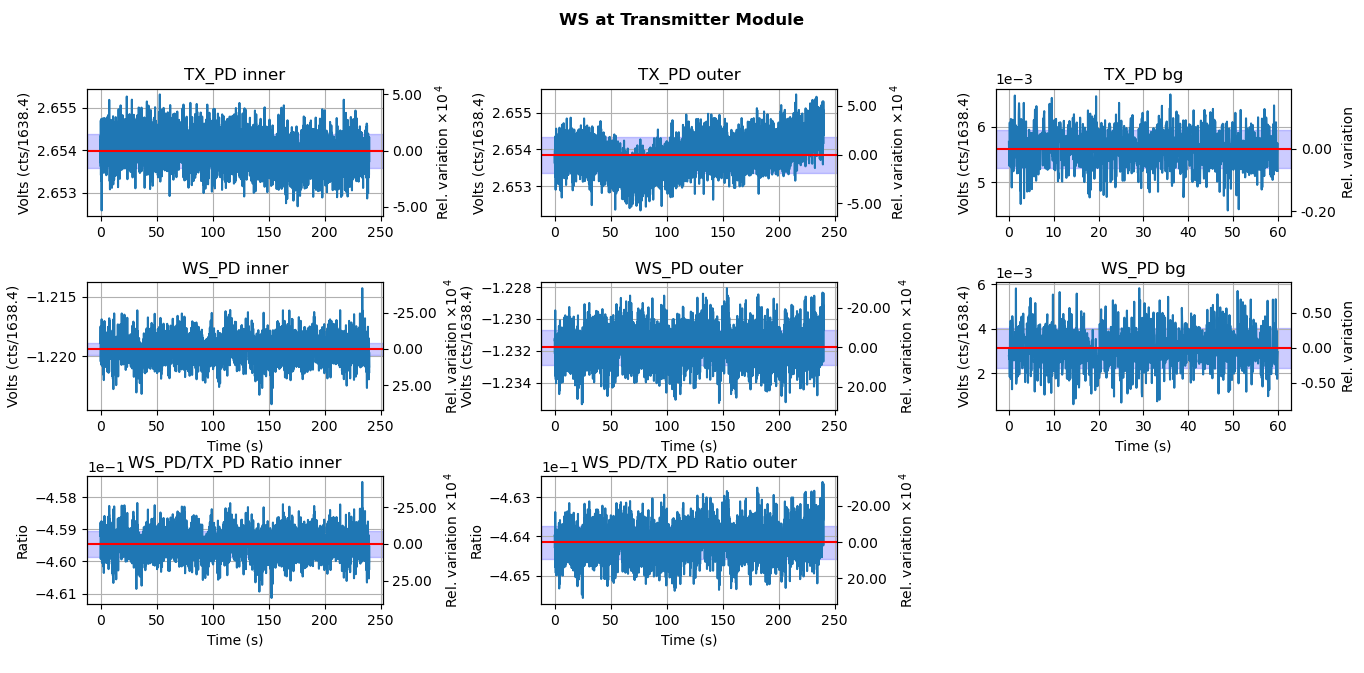
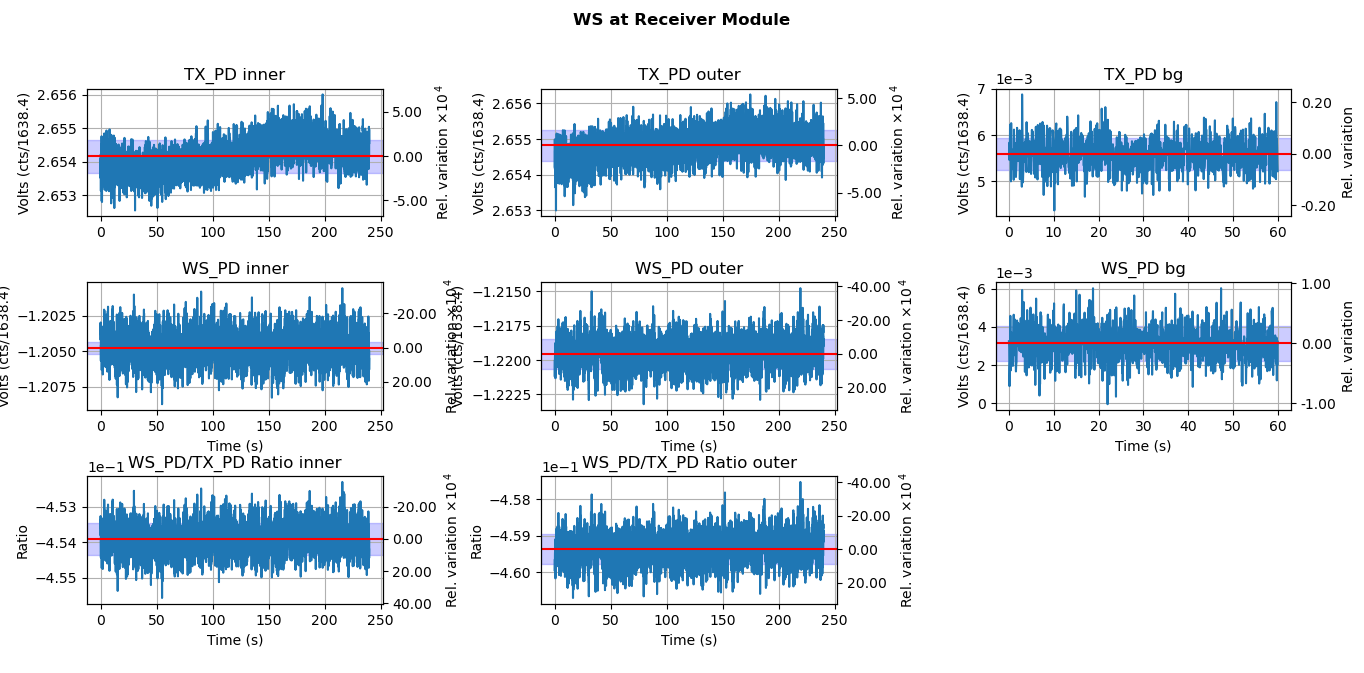
WS @ TX
WS @ RX
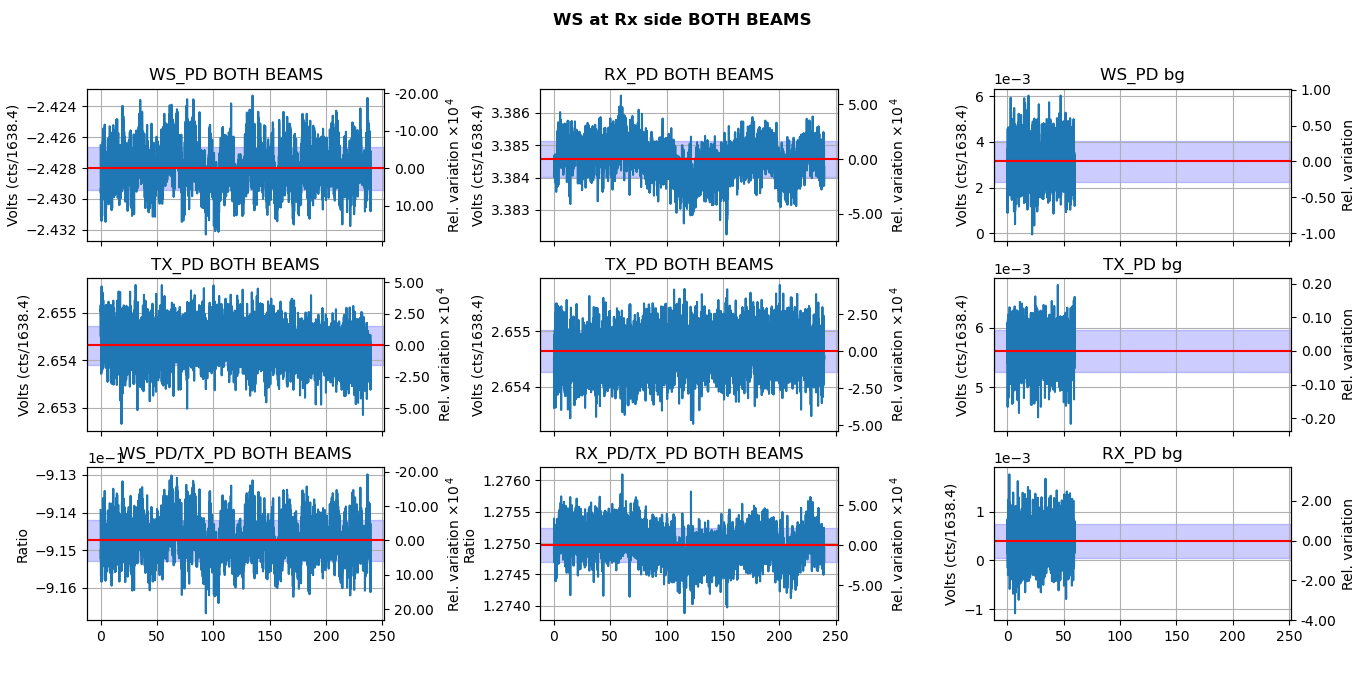
WS @ RX Both_BEAMS
LHO EndX PD report
Git Link: https://git.ligo.org/Calibration/pcal/-/tree/master/O4/ES/measurements/LHO_EndX/tD20241126?ref_type=heads
Lab measurements:
NOTES:
PS4 PS5 measurement used for the above measurement were made on 2024-09-23.
The Measurements done in the PCAL LAB today 2024-11-26 were significantly different from the last set of measurements. Due to a drop in the voltage reported in the following plots.
https://git.ligo.org/Calibration/pcal/-/tree/master/O4/lab/measurements/t20241126_144208_PS4_PS5_FB?ref_type=heads
https://git.ligo.org/Calibration/pcal/-/tree/master/O4/lab/measurements/t20241126_160713_PS4_PS5_BF?ref_type=heads
And I will need review these further before re-running the ES data with these newest measurements.
This maybe due to some changes in the lab. More vetting time is needed.

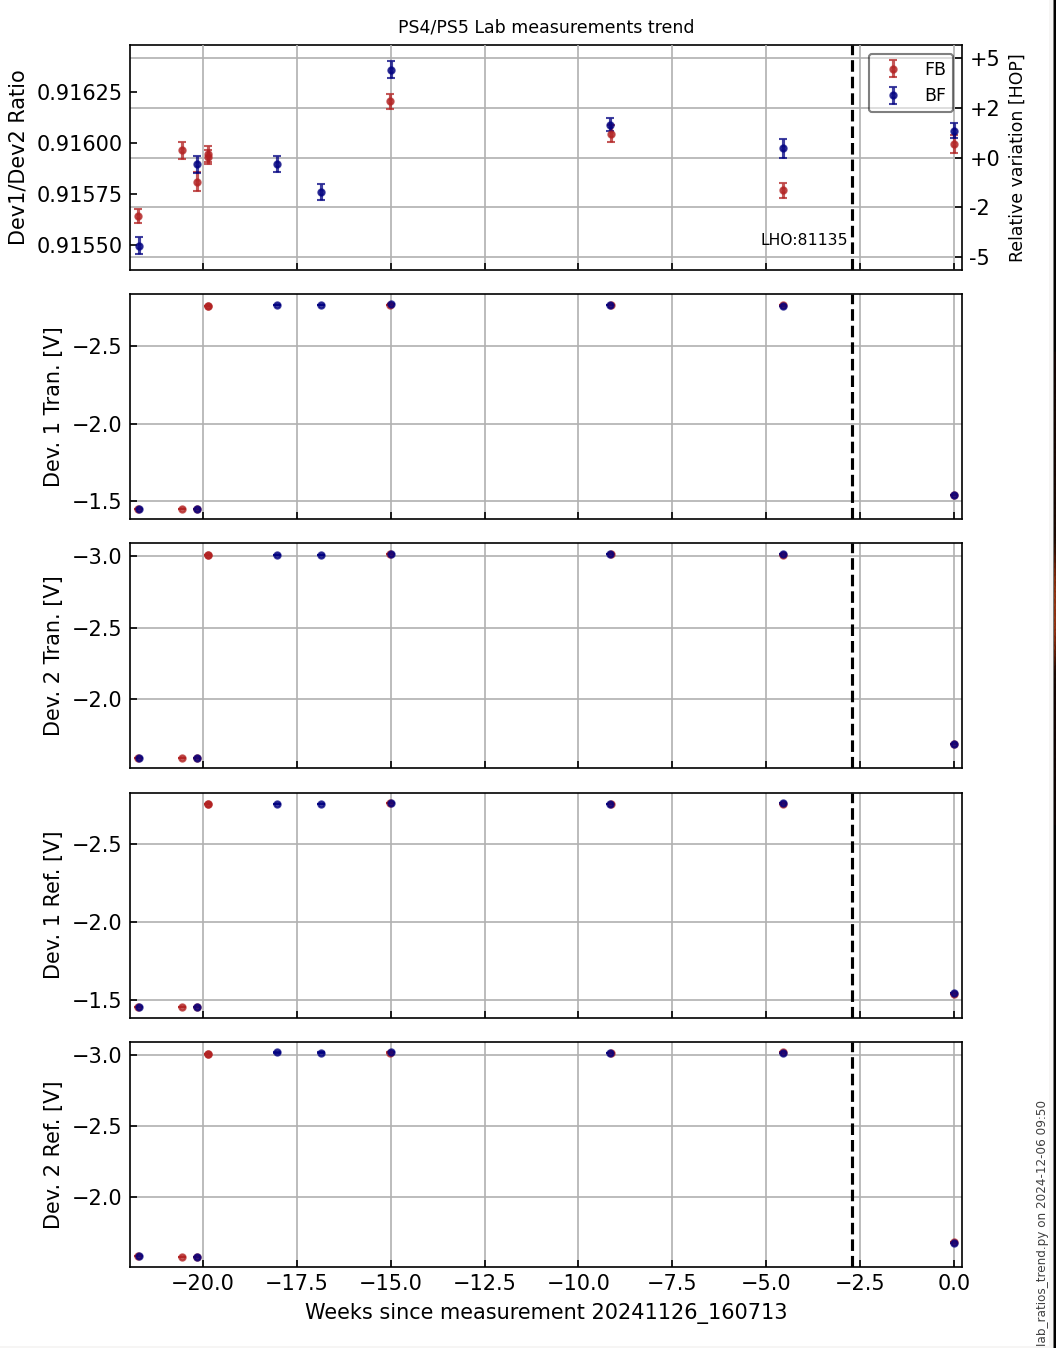
Ratio measurements t20241126_144415_PS4_PS5_FB and t20241126_160713_PS4_PS5_BF agree with preceding measurements within 0.02%, as seen in the top plot of the attached figure.
Top plot show the mean of each responsivity ratio measurement distinguished by the power sensor position from the laser: device_1_front/device_2_back (FB, red) or device_1_back/device_2_front (BF, blue). The error bars indicate the standard error over the mean. The rest of the plots show the mean voltage of each measurement, also separated by FB from BF. Note the change in voltage by the OFS offset from 81135, as indicated by the vertical dotted line 2 weeks before the measurement. As expected, changes in laser power did not affect the final ratio.
We should use the lab measurements intended for this ES measurement.