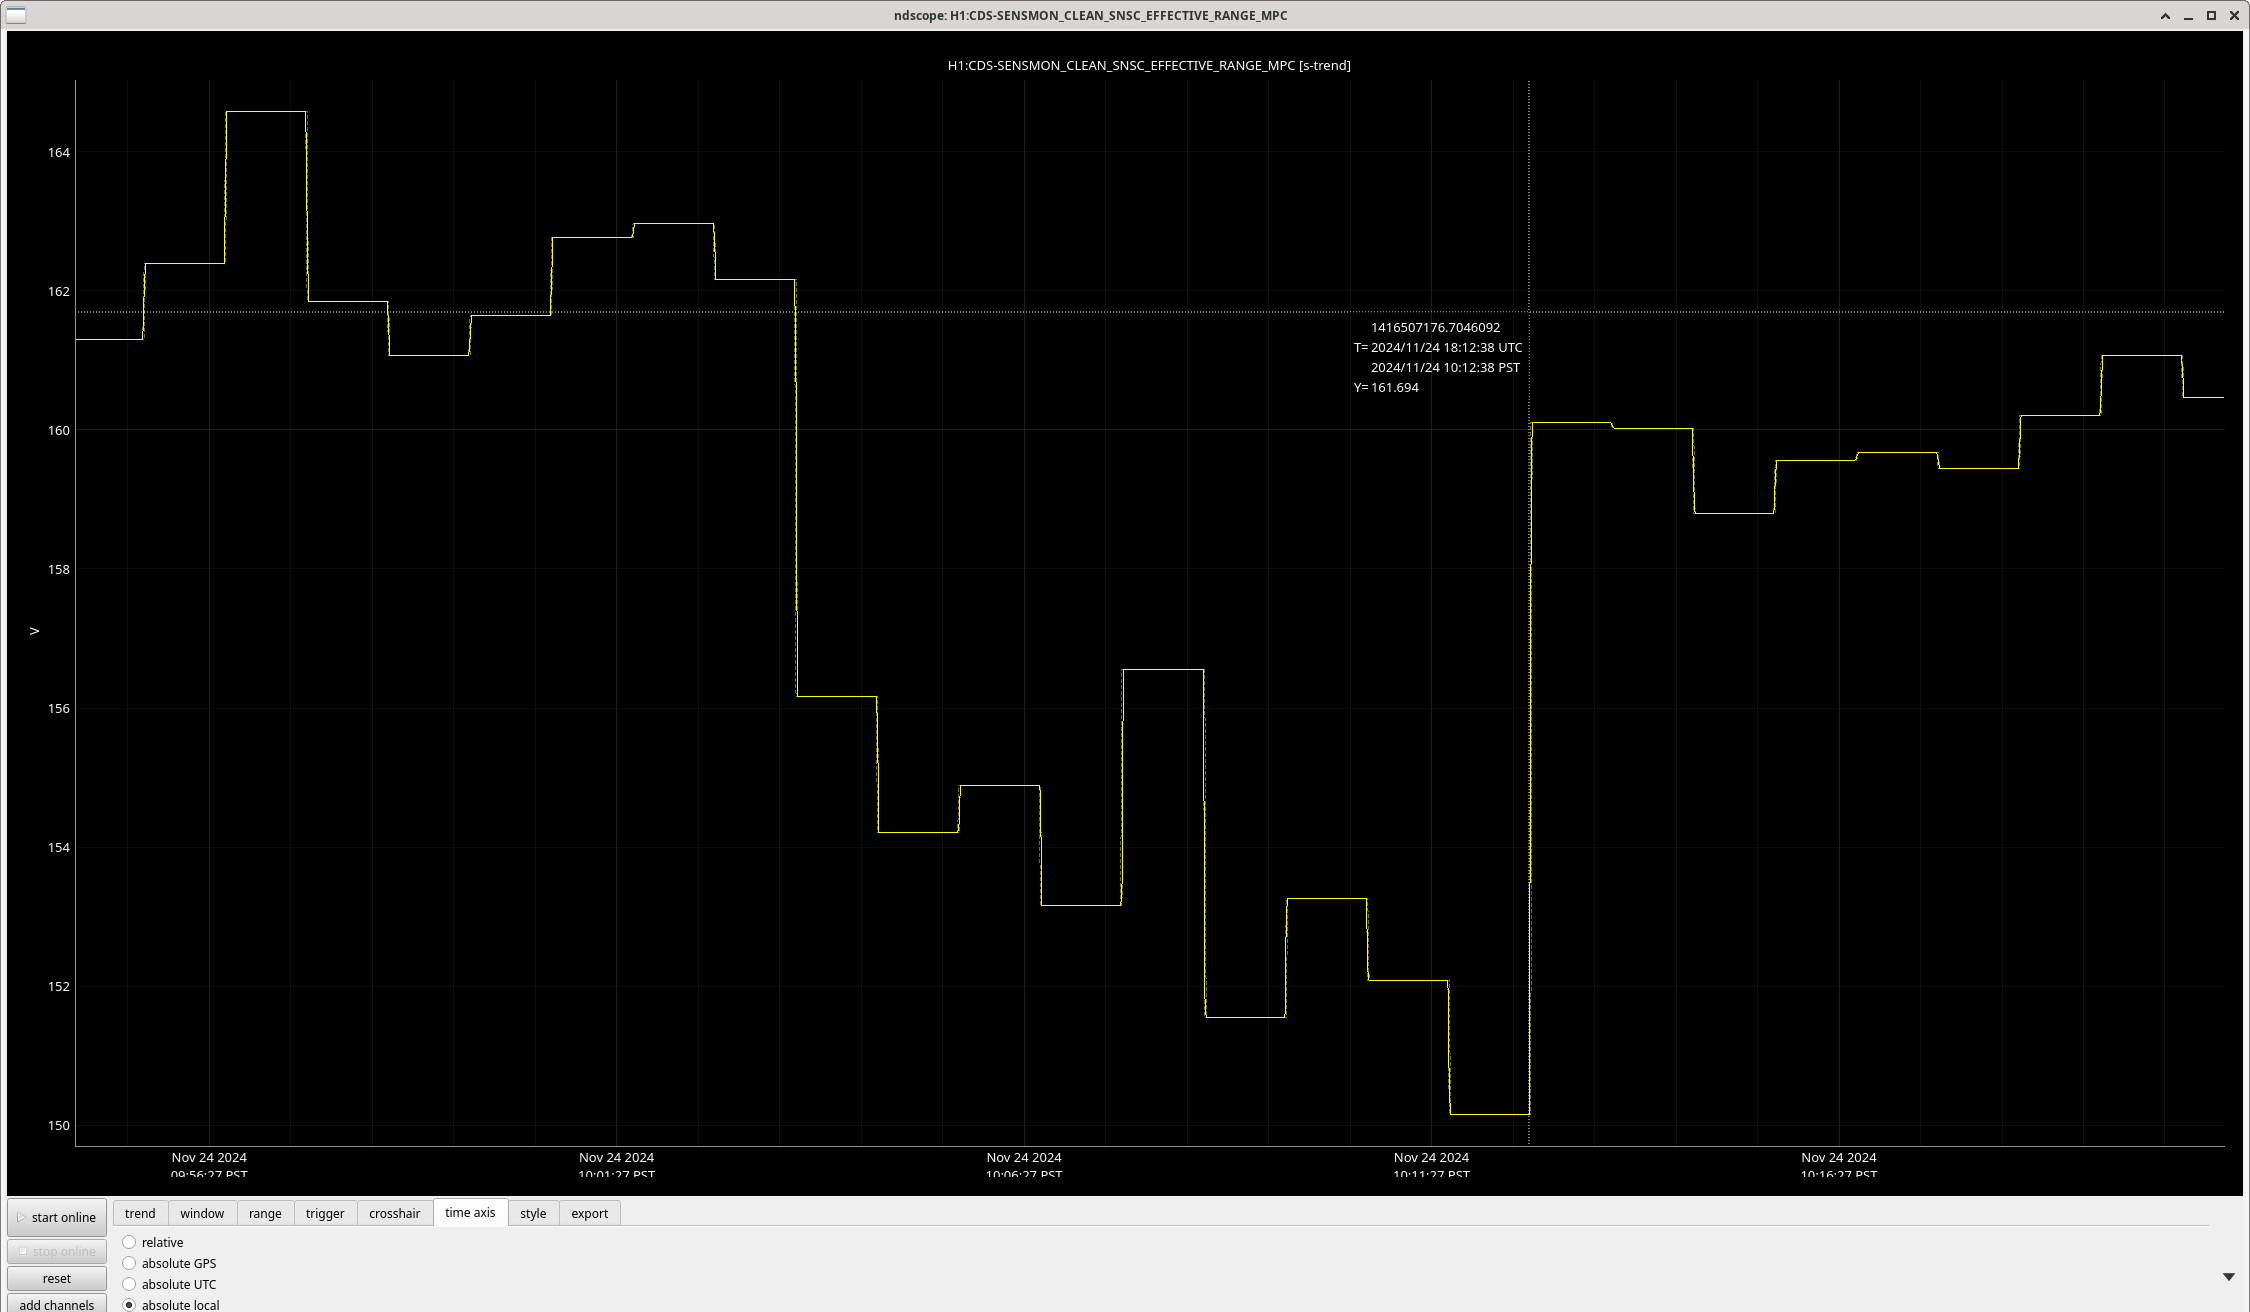
This morning there was a range drop on H1 (163Mpc down to about 151Mpc, see attachment#1). Was working on trying to figure out how to run the Range Check measurements, but while chatting with Vicky on Teamspeak, she reminded me about the daily CP1 Fill can affect range (see attachment #2 which is plot from Dave's alog) ....and the effect certainly lines up! (Also see Oli's alog from Sept here.) The time in question is 1802-1812utc (1002-1012amPT). I will not share the Low-Range-Plots I took for 1810utc since CP1 Fill is most likely the culprit.
However, a note about the range is that it has not really returned to 163Mpc---it's hovered at 157Mpc post-CP1-Fill for the last 4+hrs.
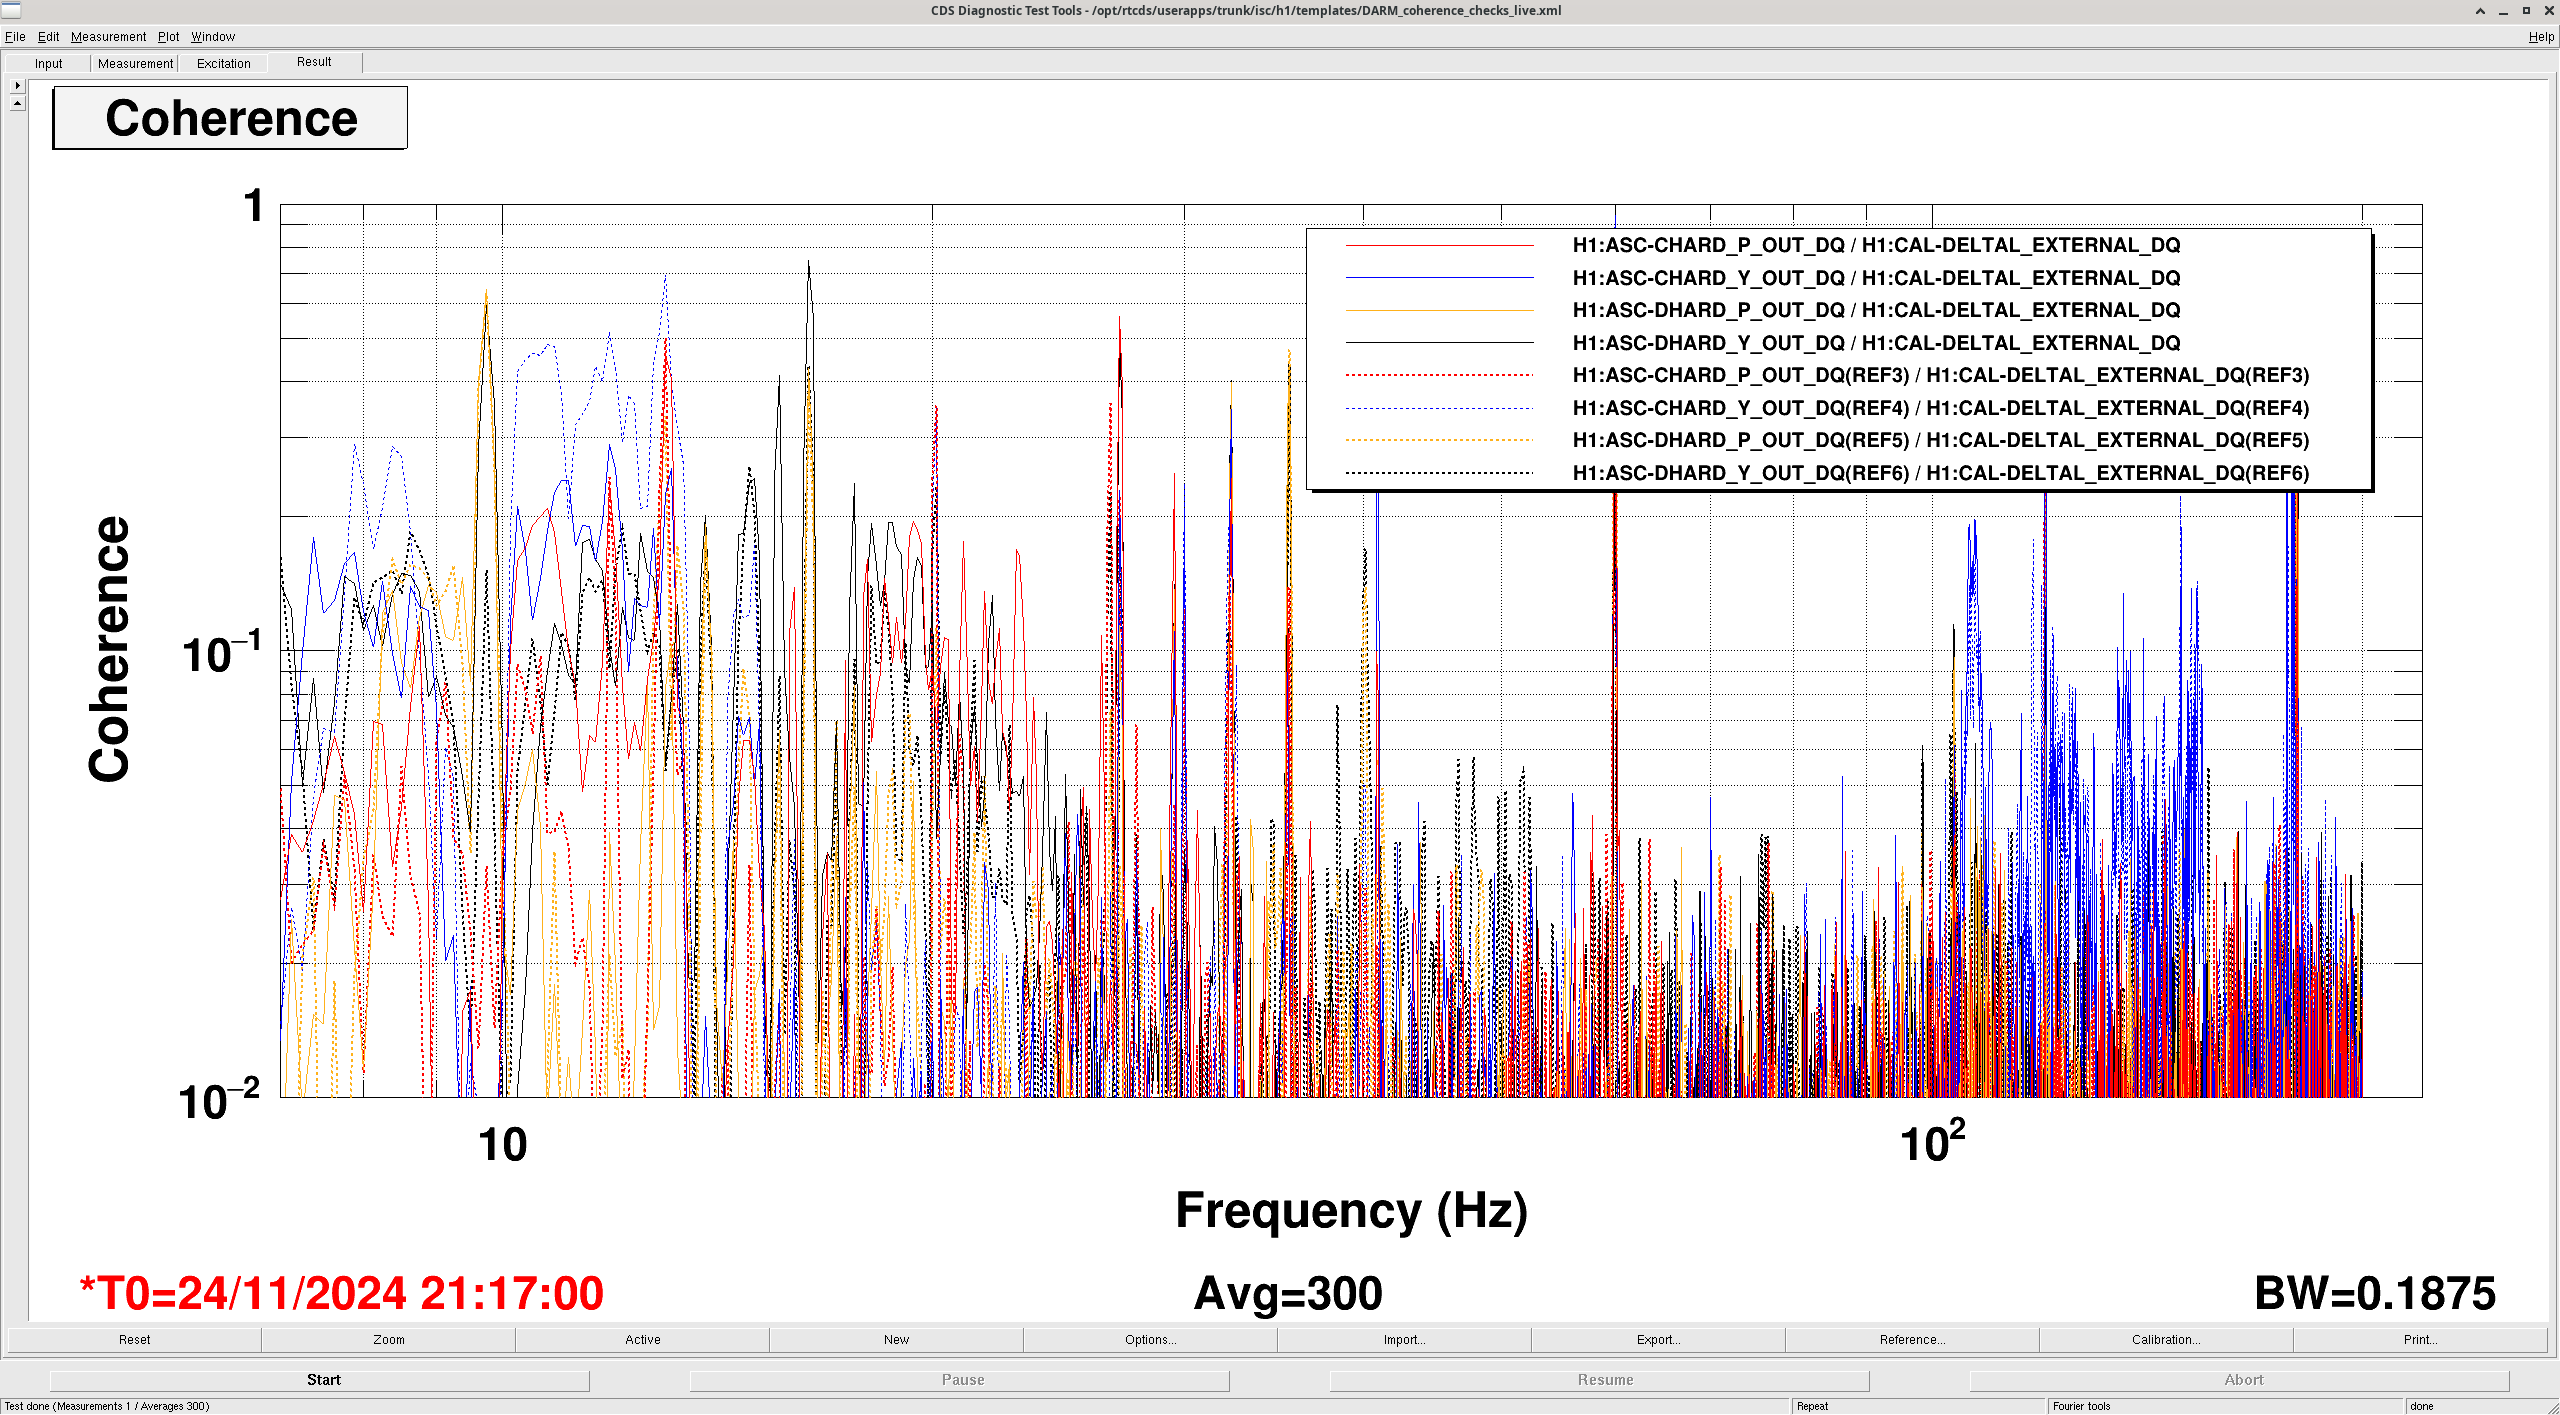
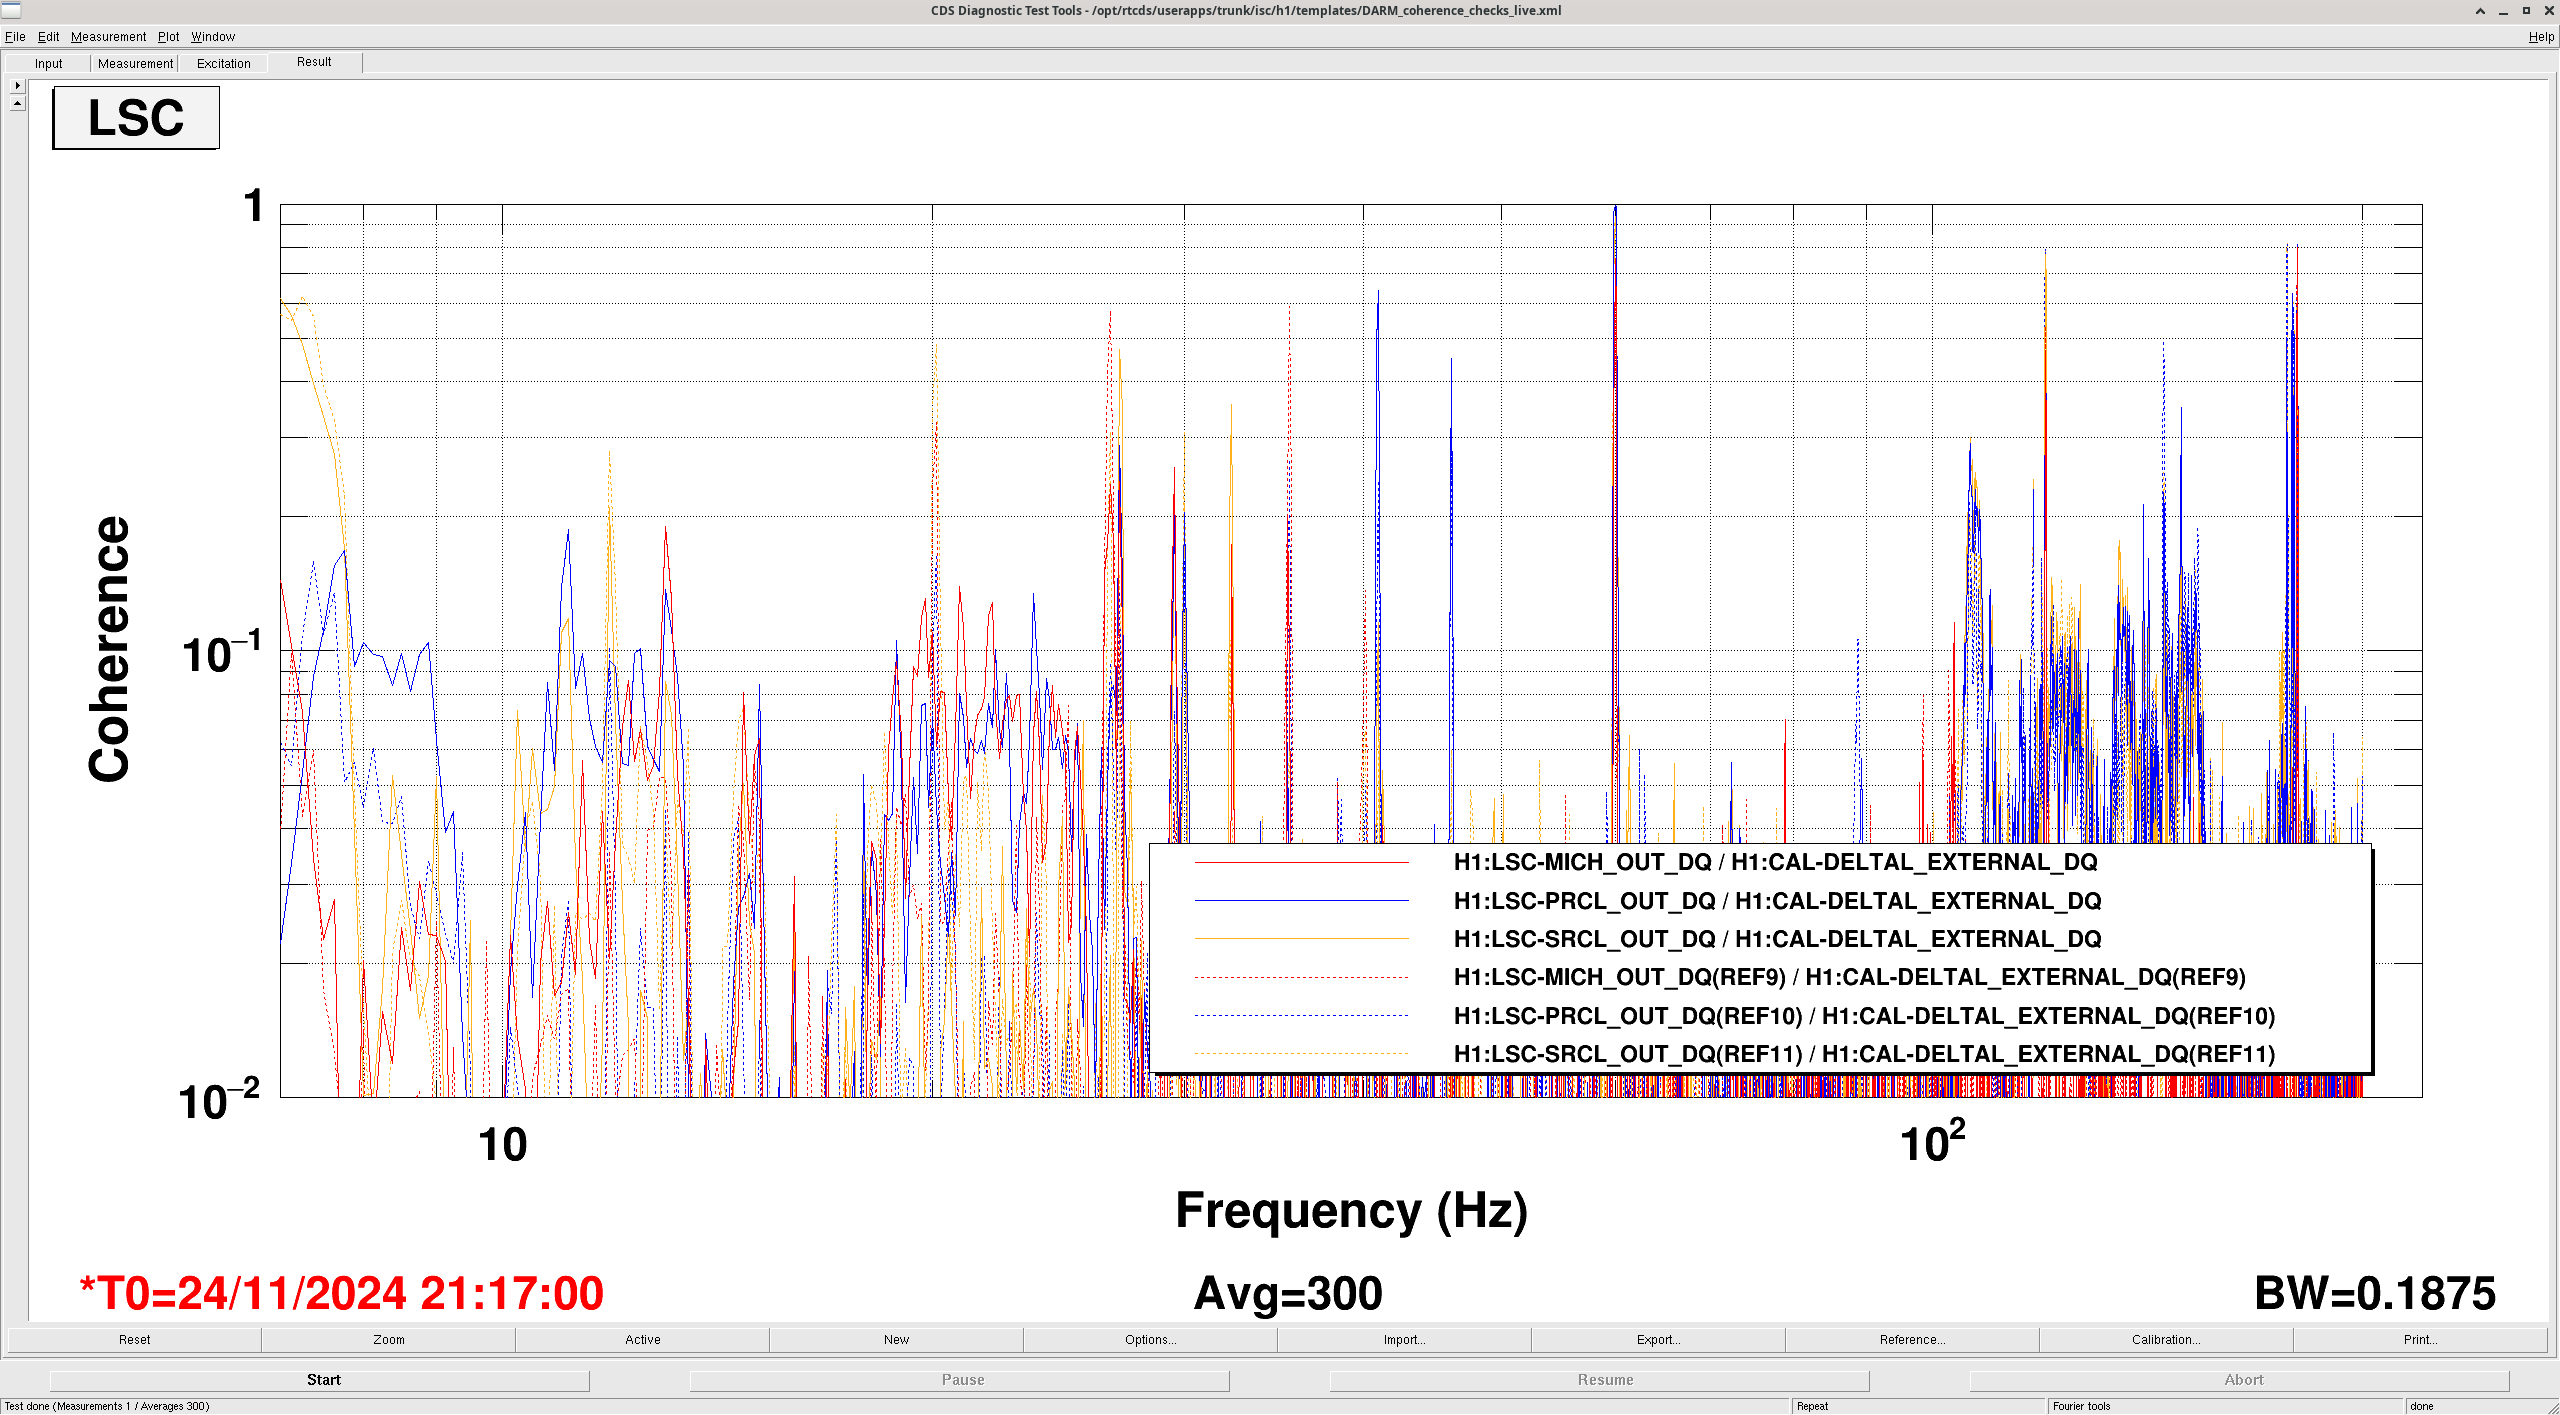
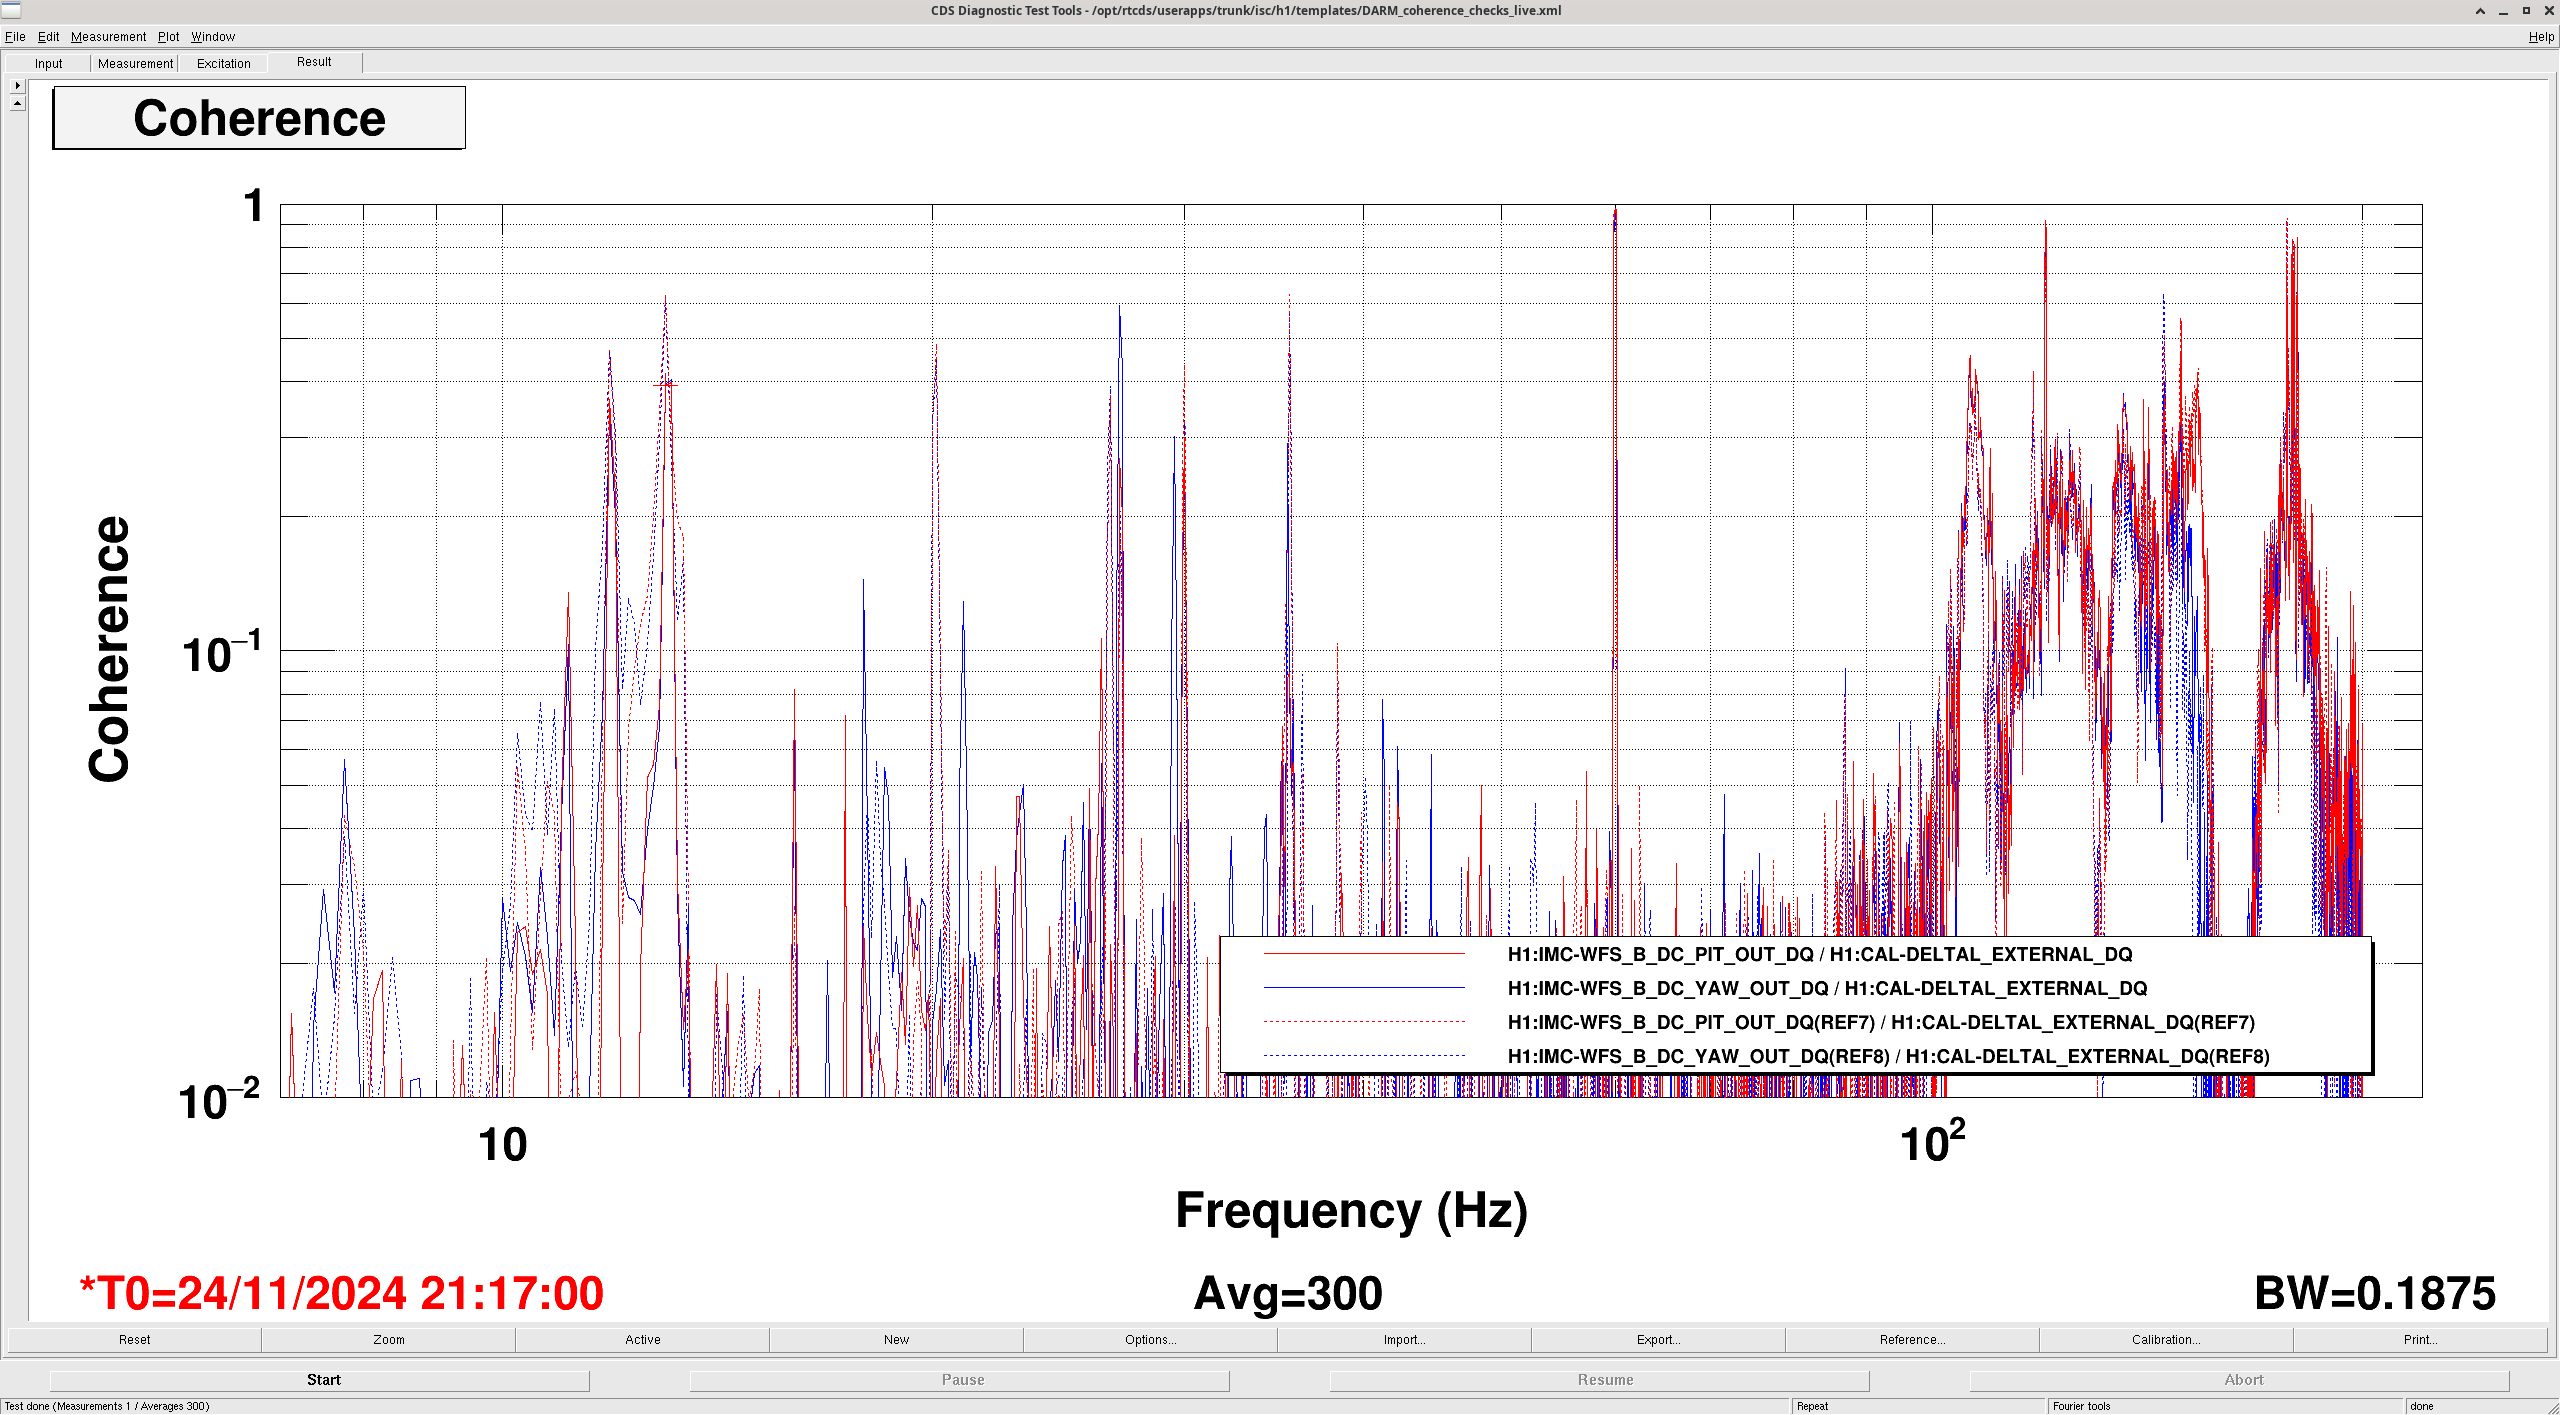
So I ran another Low Range DTT for about an hour ago (2117utc/1317PT).
- ASC: Can see noisier CHARD_Y & CHARD_P (attachment #3)
- LSC: MICH, PRCL, & SRCL are noisier at various frequencies (attachment #4)
- IMC WFS: There are some noisy IMC WFS B pit & yaw peaks (attachment #5)

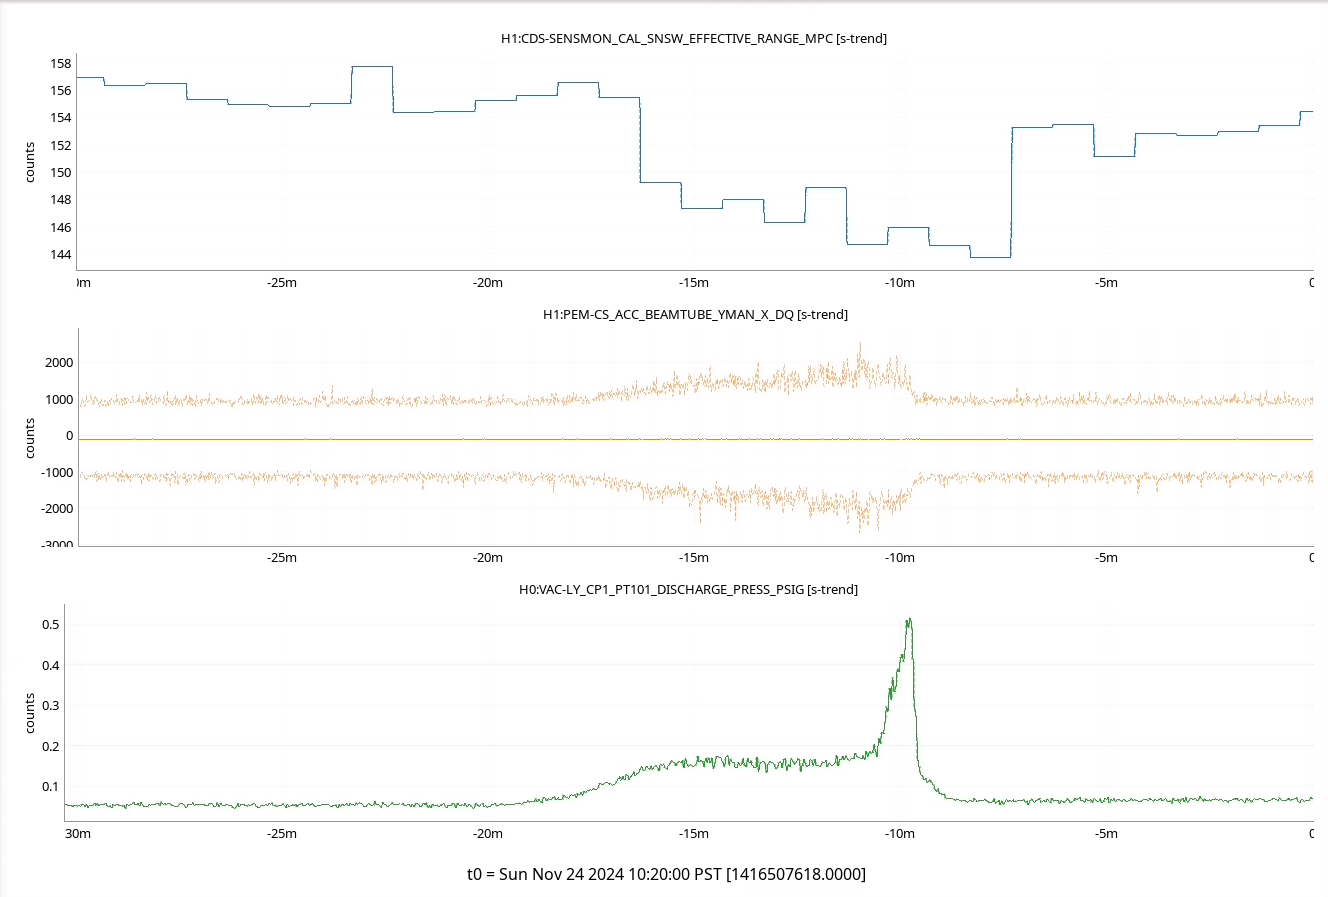
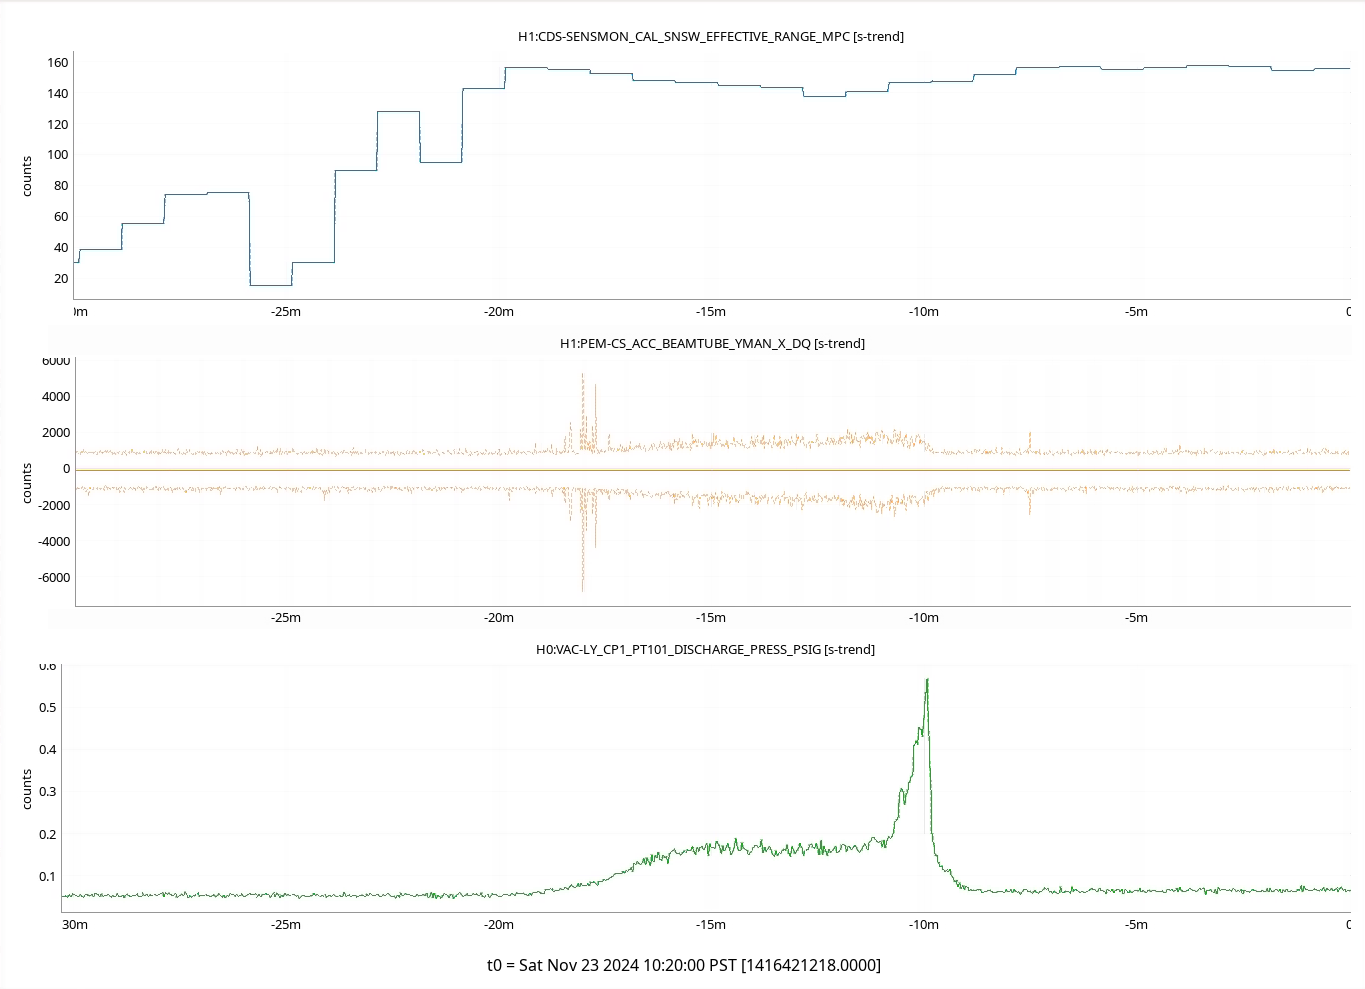
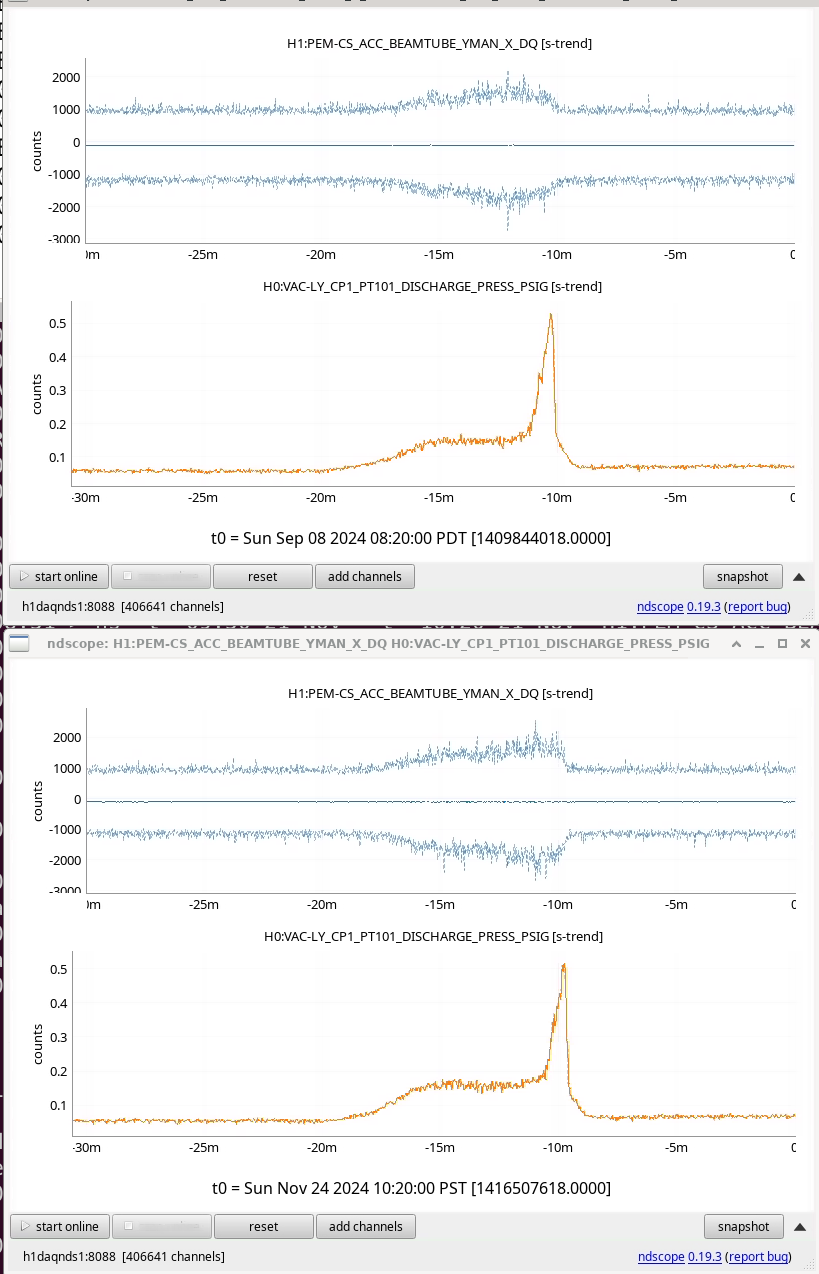
Attached plots show the 30 minutes around the CP1 overfill for Sunday and Saturday. The H1 range shows a correlation with the CP1 discharge line pressure. An increase in line pressure indicates the presence of cold LN2 vapor, and later liquid, in the pipe. The Y manifold accelerometer signal shows correlated motion.
The accelerometer correlation can also be seen on the previous Sunday. This is not seen clearly during the week because the ACC was nore noisy, presumably due to LVEA activity around 10am each day.
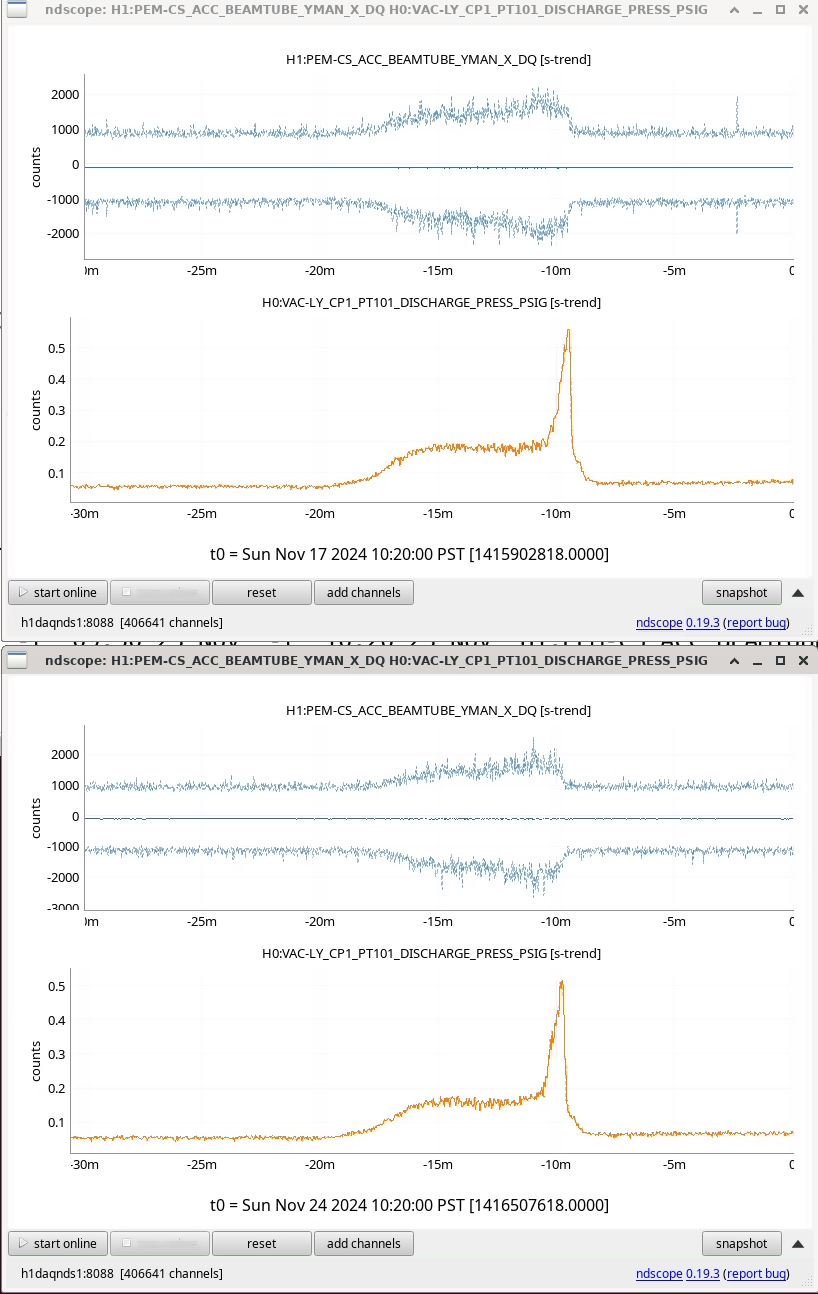
Attached shows ACC signal Sun 8th Sep 2024 correlated to the discharge pressure. Back then we were filling at 8am. It doesn't appear that the beam manifold motion has gotten any worse over the past two months during cp1 fills.
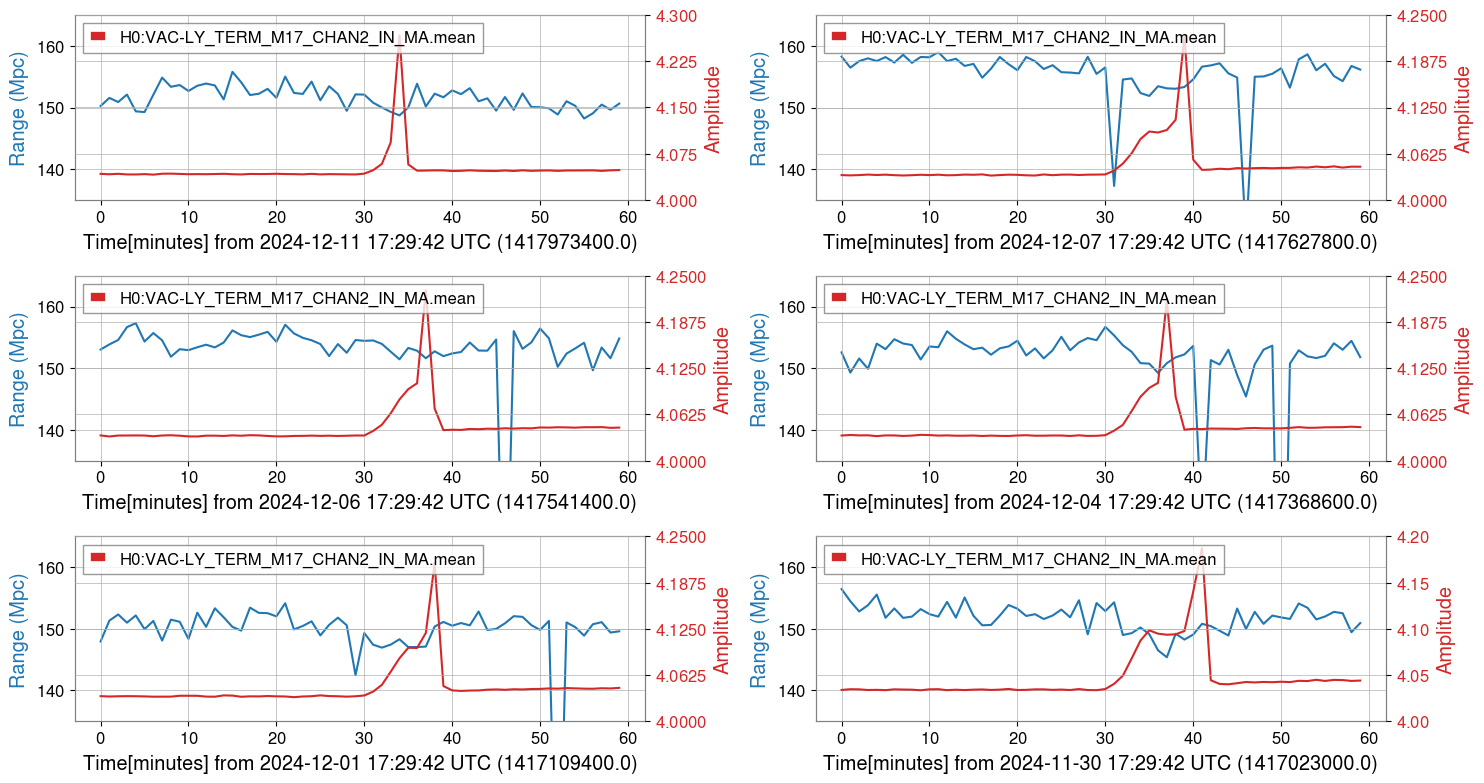
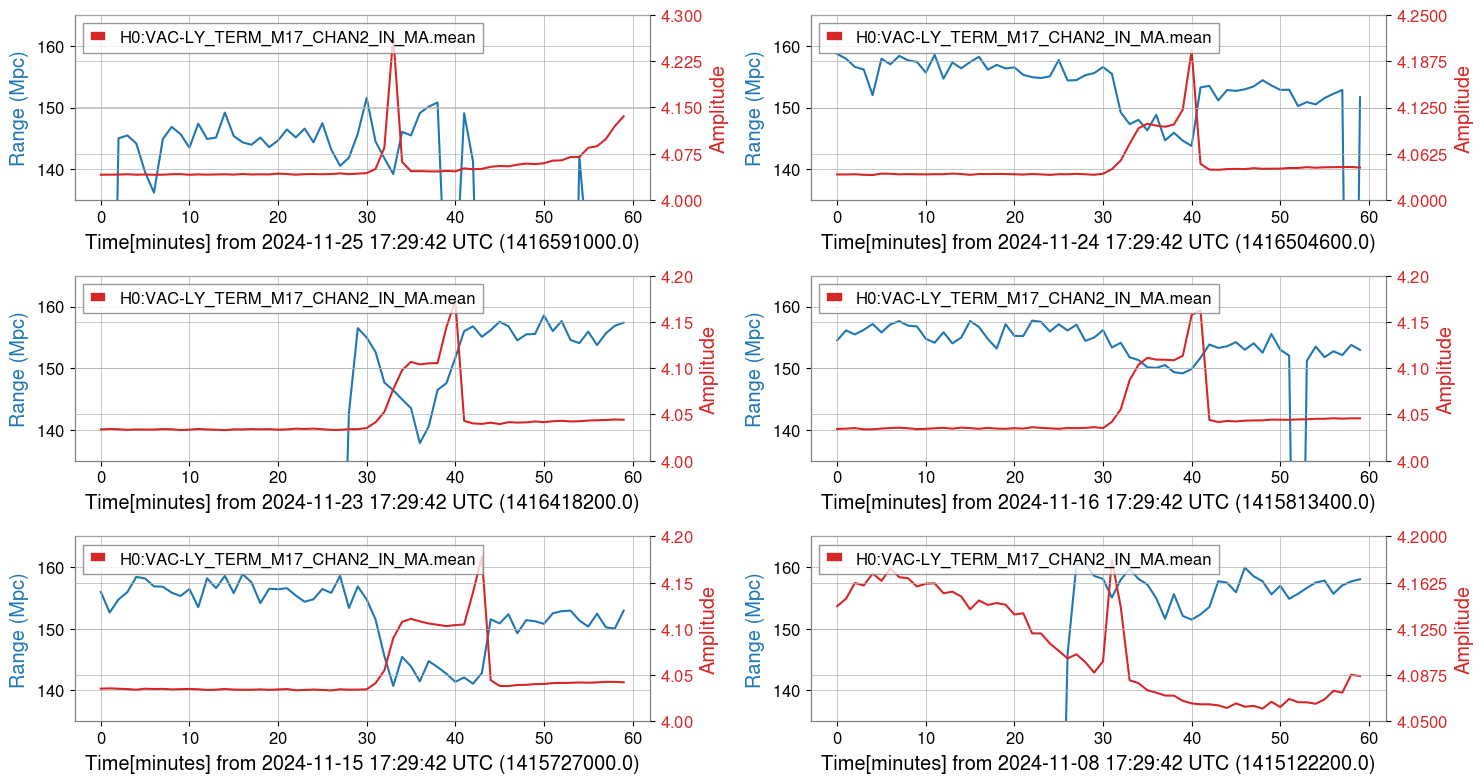
The attached plots shows the BNS range around CP1 fill times for the last six CP1 fills (10 AM PDT) when the IFO was also in the locked state. In four cases among these six, we can see BNS range drop during the CP1 fill. In the remaining two it is not clear whether CP1 fill happened or not. We see a spike in H0:VAC-LY_TERM_M17_CHAN2_IN_MA.mean, but we don't see an extened increase in that channel as we see in the other four cases.
The attached plot show the BNS range variations during the CP1 fill times during the first ~10 days of December. We are plotting only those days when the IFO was in observing (H1:GRD-IFO_OK == 1). For these days, the drop in the BNS range during the fill times seem lower than what we saw during November (plot in the above comment). We also see that the fill times are in general less in these ten days compared to what were in November. Maybe longer the fill time, more the drop in the BNS range!? Also looking at these plots and plots from November, it seem the range might be coming back to a lower value after the fill than it's value before the fill.