evan.goetz@LIGO.ORG - posted 13:18, Friday 17 January 2025 - last comment - 17:12, Tuesday 21 January 2025(82329)
Evidence for in-band lines caused by aliasing of lines in high-sampled frequency DCPD ADC
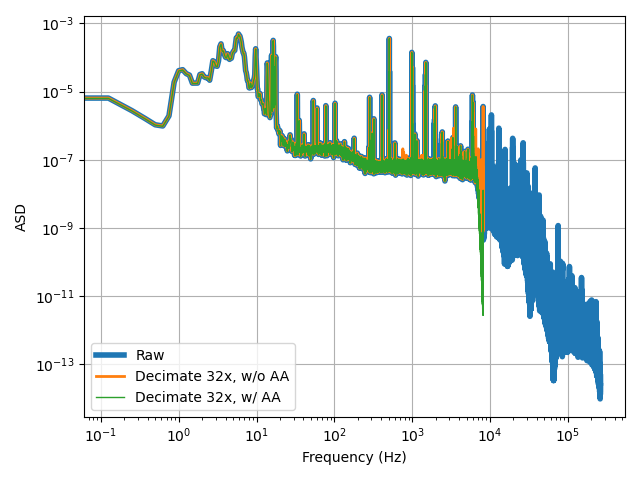
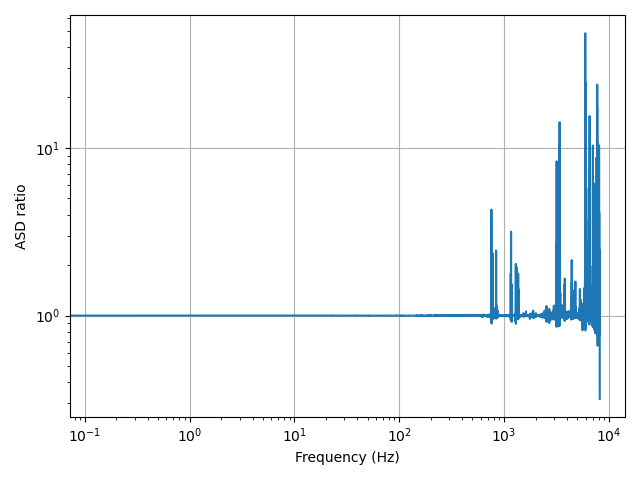
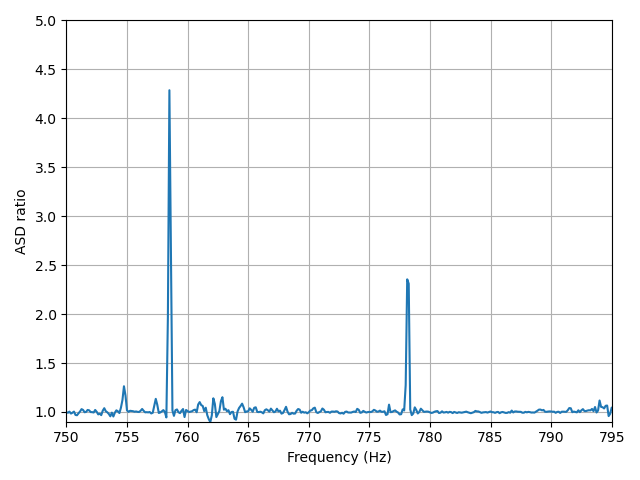
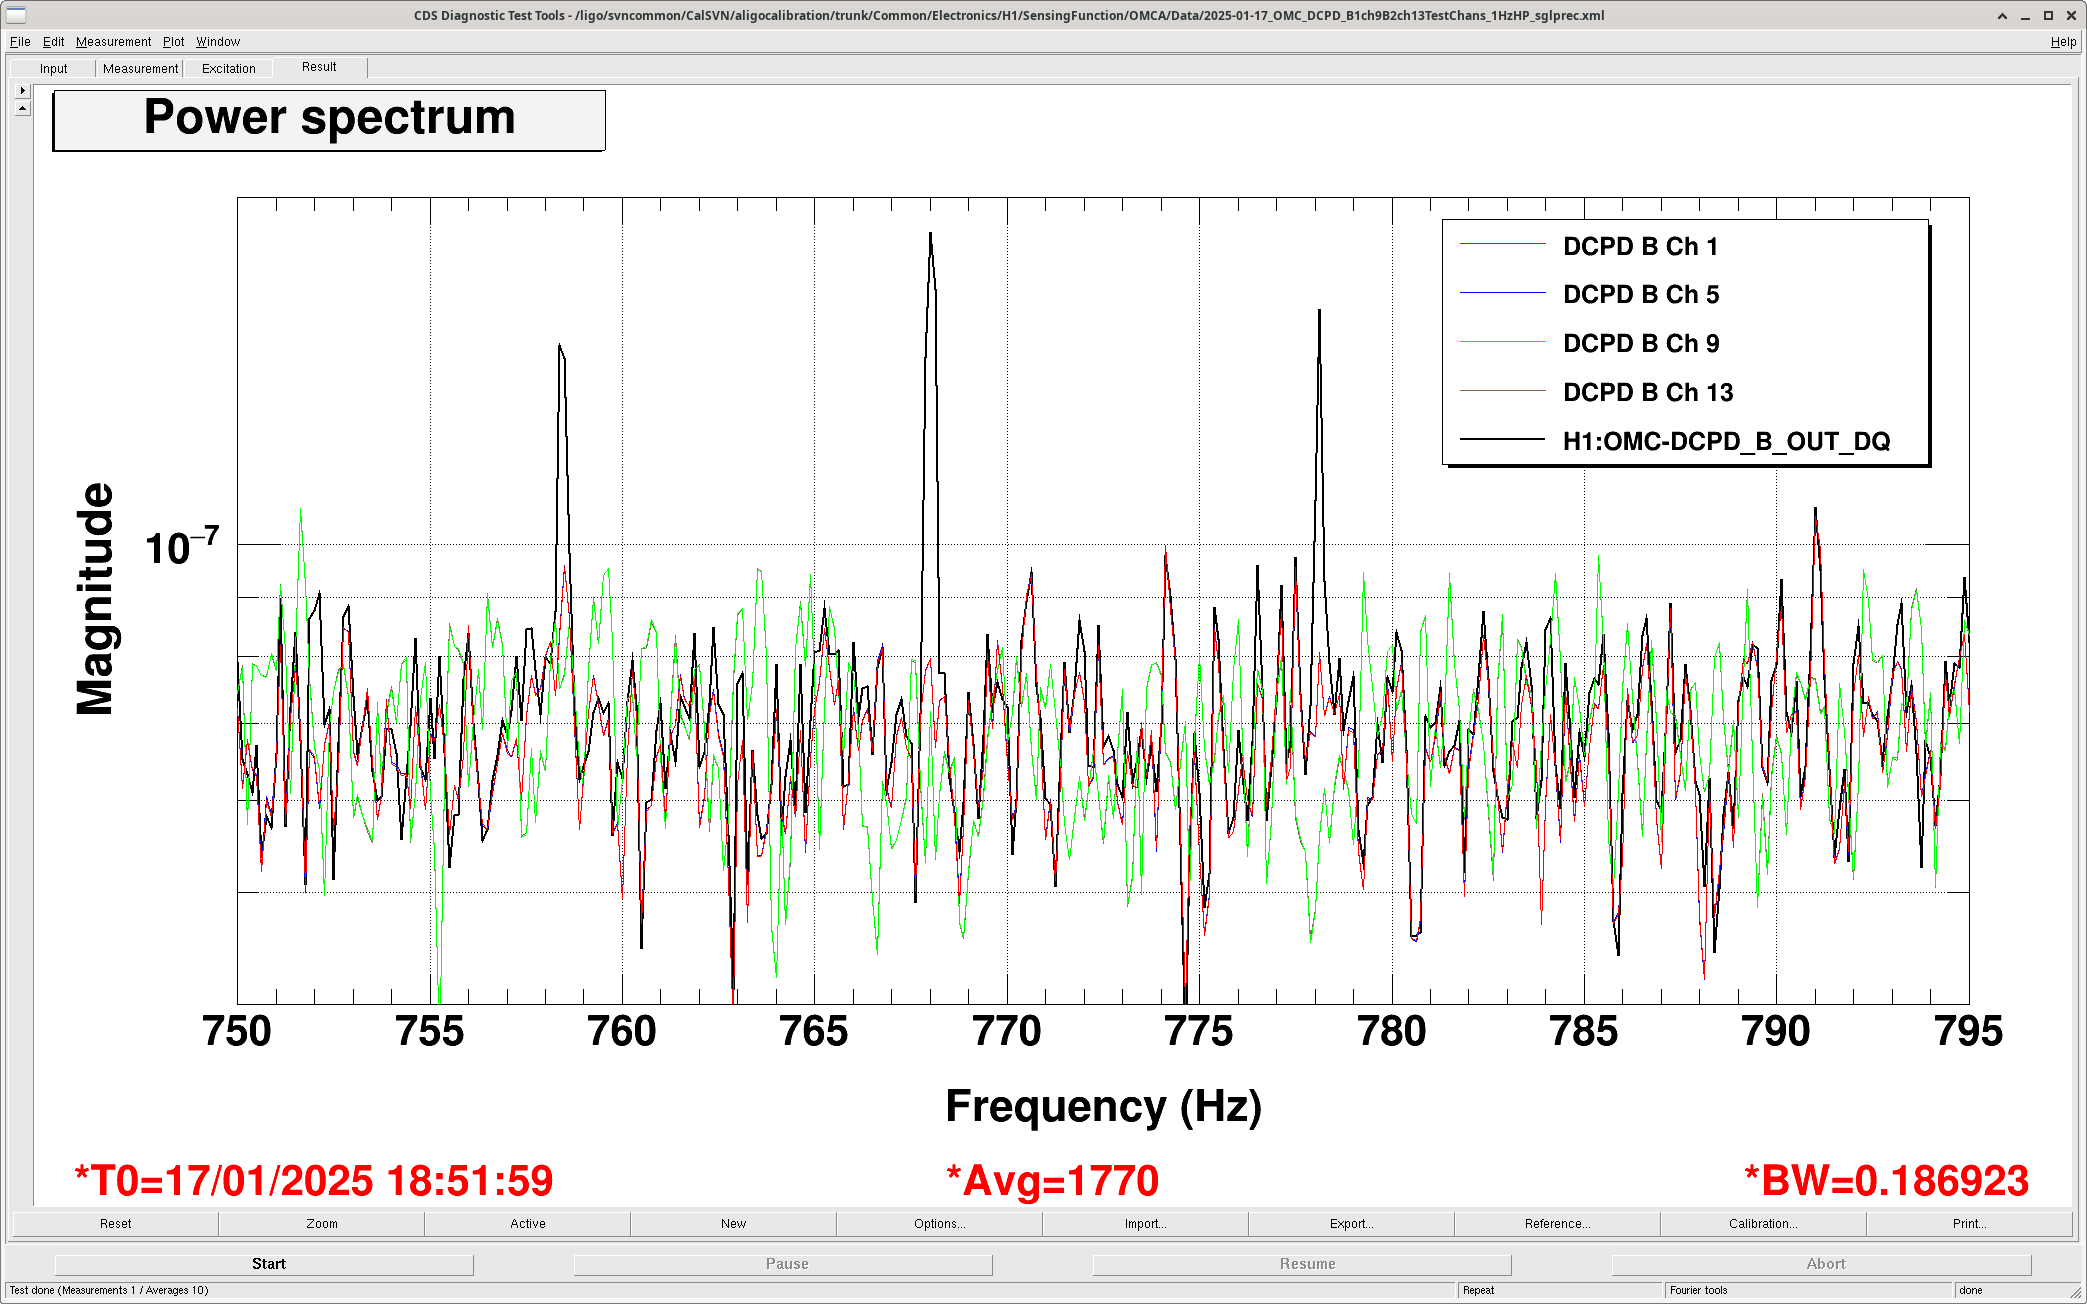
E. Goetz, J. Kissel, L. Dartez

Summary:
There is evidence that some of the lines found in the gravitational wave band are actually aliased lines from higher frequencies. So far it is unclear exactly how many of the lines in the run-averaged list are due to this problem and if the lines are stationary or if violin ring-ups may induce more lines in band due to aliasing artifacts. Further investigation is needed, but this investigation suggests that the current level of anti-aliasing is insufficient to suppress the artifacts at high frequency aliasing into the gravitational wave band.

Details:
We used the live, test-point acquisition of the 524 kHz sampled DCPD data in DTT, channel H1:OMC-DCPD_B1_OUT (equivalent to the nominal H1:OMC-DCPD_B0_OUT channel used in loop). This channel had the same 524k-65k and 65k-16k decimation digital AA filtering applied. The time series was exported from DTT and processed by stitching together the time segments into a single time series. Then one can process the time series using the scipy.signal.welch() function of 1) the full 524 kHz sampled data, 2) 524 kHz sampled data decimated (no additional AA filtering) by a factor of 32 to get the 16 kHz sampled frequency data, 3) 524 kHz sampled data decimated using additional AA filtering by using the scipy.signal.decimate() function which has a built-in anti-aliasing filter.

We also plotted in DTT the individual channels against the 16k H1:OMC-DCPD_B_OUT_DQ channel, showing that some of the lines are visible in the in-loop DCPD 16 kHz channel, but not visible in the test point 524 kHz channels.

Figure 1: ASD of raw 524 kHz data (blue), decimated data without any extra anti-aliasing filter applied (orange), and decimated data with additional anti-aliasing filtering (green). Orange peaks are visible above the blue and green traces above ~750 Hz.
Figure 2: ASD ratio of the decimated data without anti-aliasing filtering to the raw data showing the noise artifacts
Figure 3: Zoom of figure 2 near 758 Hz
Figure 4: ASD computed from DTT showing DCPD B Ch 1, 5, 9, 13 and and the H1:OMC-DCPD_B_OUT_DQ channel at the same time as the 9 and 13 channels were acquired (limitations of the front end handling of 524 kHz test points to DTT)
Figure 5: Zoom of figure 4 near 758 Hz

We were also interested in the time-variability of these artifacts and watched the behaviour of H1:OMC-DCPD_B_OUT_DQ, and saw amplitude variations on the order of factors of a few and frequency shifts on the order of 0.1 Hz, at least for the artifacts observed near 758 Hz.

Figures 4 and 5 indicate that there are more artifacts not necessarily directly caused by aliasing; perhaps these are non-linearity artifacts? This needs further study.

A count of the number of 0.125 Hz frequency bins from 0 to 8192 Hz of the ratio between downsampling without additional anti-aliasing filtering and the raw 524 kHz ASD indicates that ~4900 bins are above a threshold of 1.1 (though most of those bins are above 2 kHz, as indicated by figure 2).
Images attached to this report

Comments related to this report
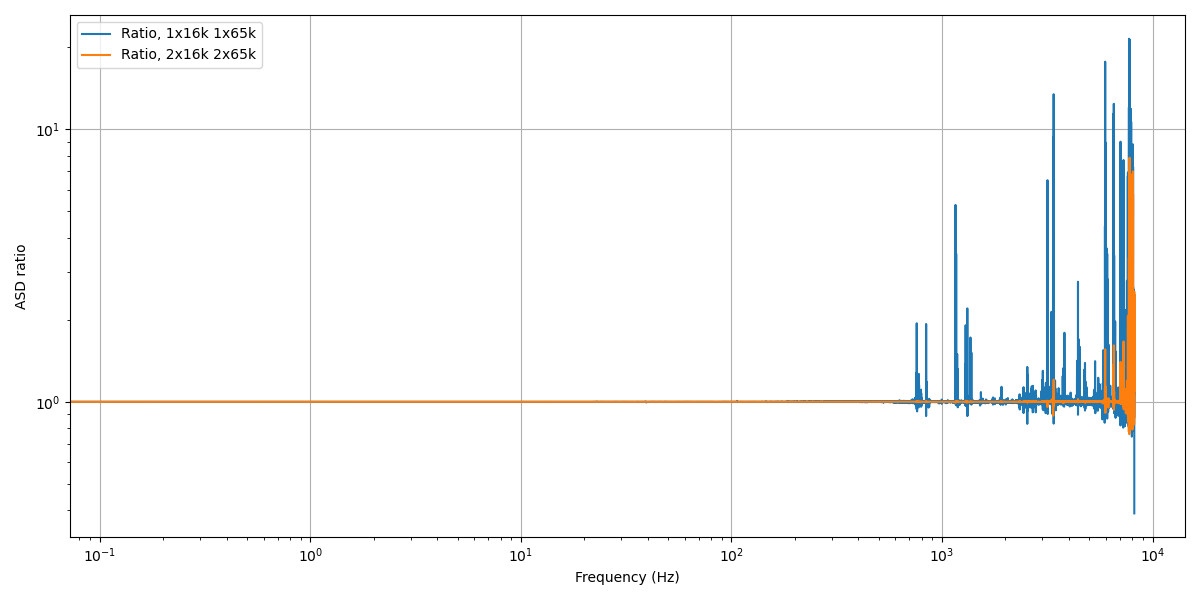
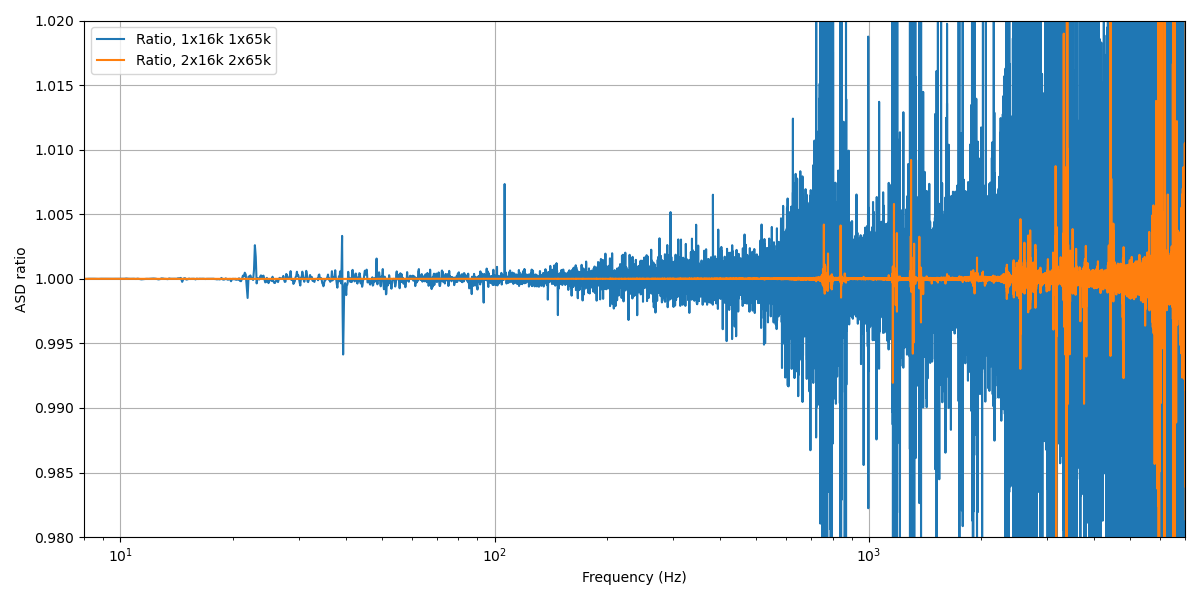
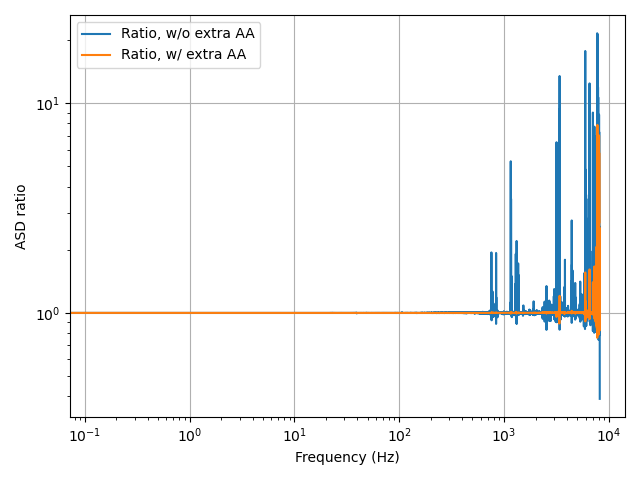
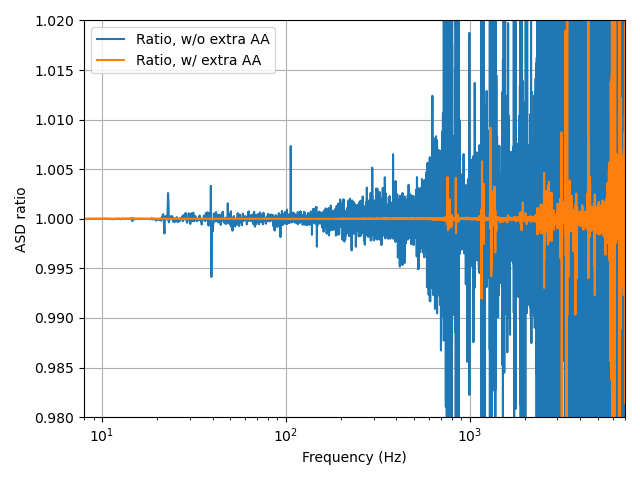
E. Goetz, L. Dartez

We temporarily added extra digital AA filtering in the DCPD A1/2 B1/2 TEST banks (we are planning to revert to https://alog.ligo-wa.caltech.edu/aLOG/index.php?callRep=82313 on Tuesday), to see if we can suppress the aliased artifacts. Repeating the same procedure as before: computing the ratio of the ASD of the decimated data to the ASD of the full 524 kHz band data, both with and without the extra digital AA filtering we can see a significant improvement in the low frequency artifacts.

The temporary filtering is just copies of the standard 524k-65k and 65k-16k filters, but it shows significant reduction in low frequency artifacts (see especially Figure 2).

This suggests that improvements to the sensing path anti-aliasing filtering would be beneficial to detector sensitivity, reducing the impacts of high frequency artifacts that are being aliased to in-band.
Images attached to this comment
The temporary TEST filter modifications that duplicated the decimation filters into additional filter banks has been reverted back to LHO aLOG 82313.
For easier comparison, I've attached ratio plots the same size and scale as in other aLOGs
Images attached to this comment