Summary: anti-aliasing improvements (82440) seem to have removed quite a few spectral artifacts -- but not the ones that originally motivated the anti-aliasing investigations, i.e. the narrow line contamination around violin modes.
Background / timeline
Anti-aliasing improvements were made Jan 23-24th. There was a failed attempt on Jan 23 (82412), a temporary reversion, and then a successful attempt on Jan 24 (82440). Reports by Evan (82455) and Jeff (82512) provided a first look at improvements to the spectrum. Earlier observations indicated that at least some of the aliasing artifacts displayed "amplitude variations on the order of factors of a few and frequency shifts on the order of 0.1 Hz, at least for the artifacts observed near 758 Hz." (82329)
A closer look at the mitigated peaks
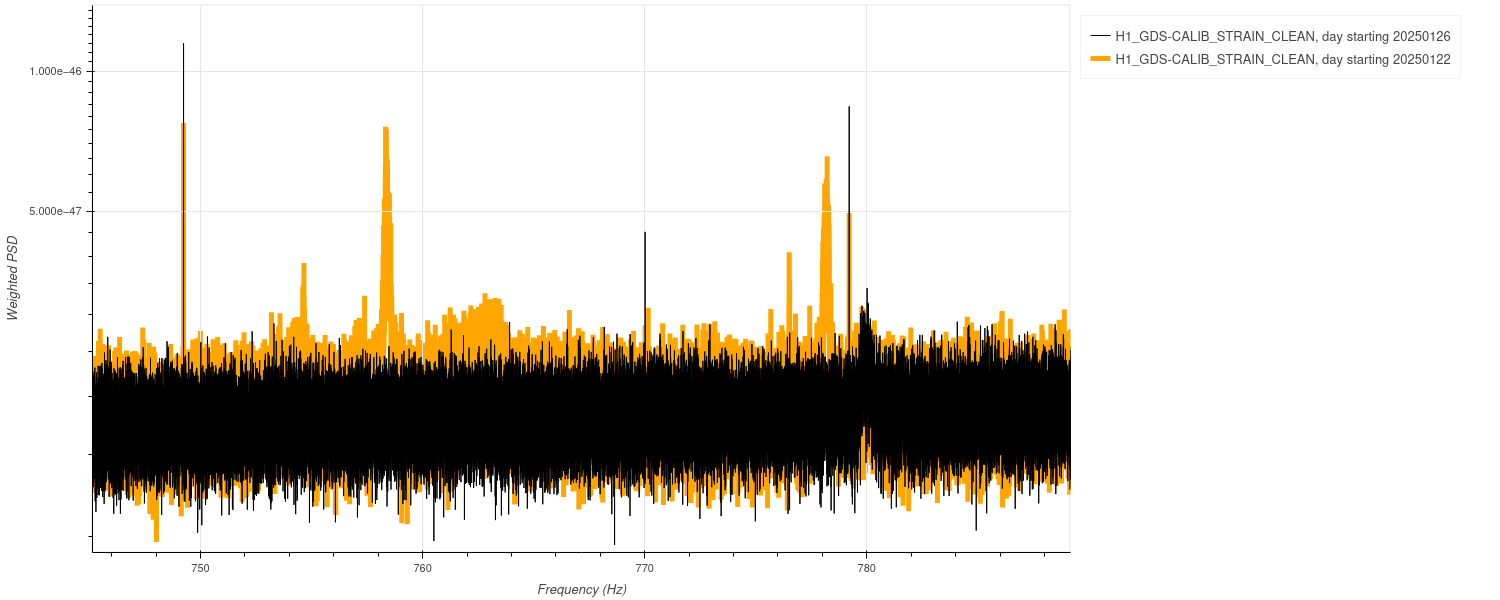
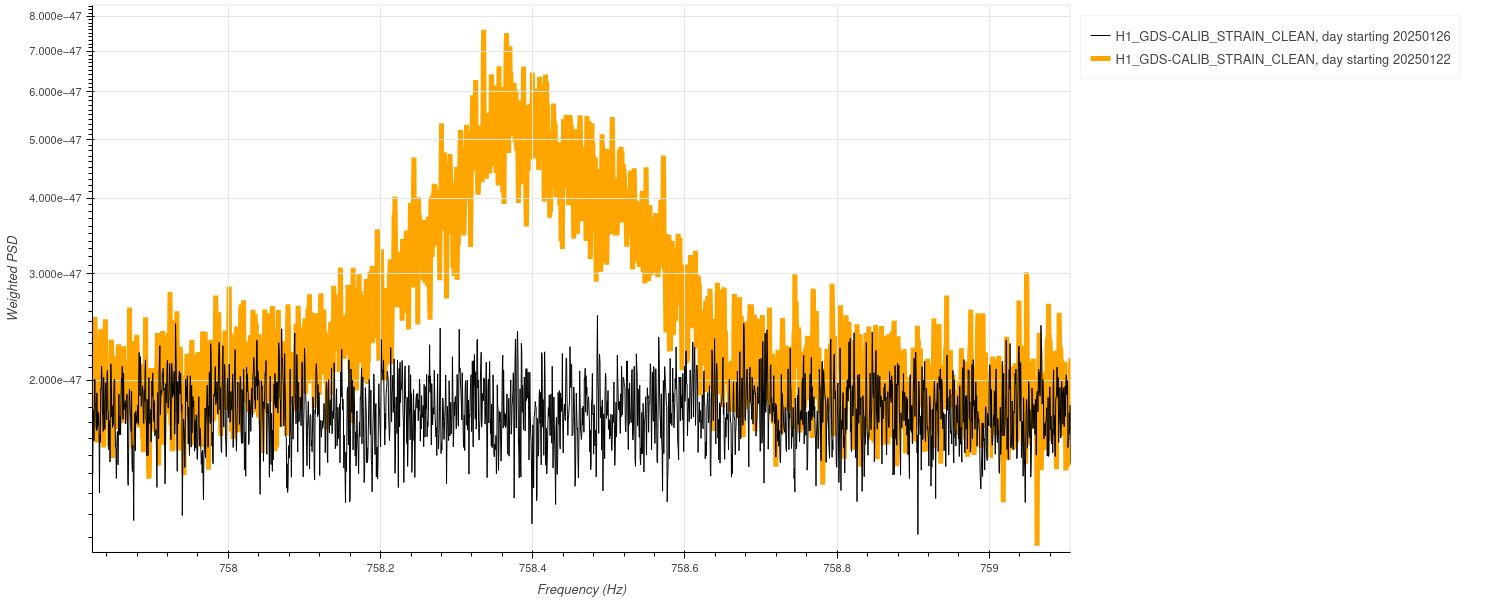
In order to look more closely at the improvements flagged in 82512, I compared daily Fscan spectra from Jan 22 (before) to Jan 26 (after). As an example, let's look at the two peaks in the region of 760 Hz.
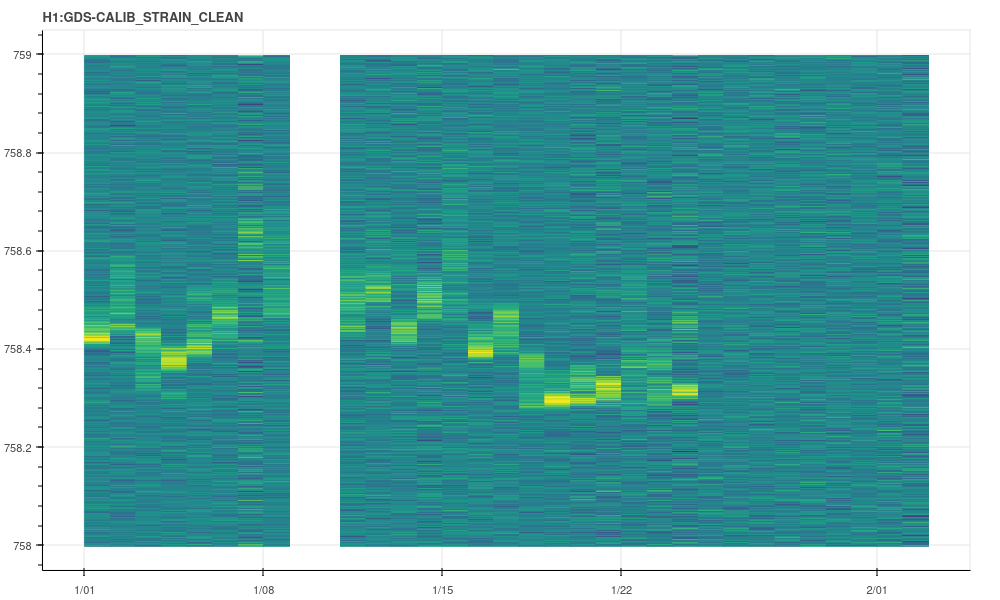
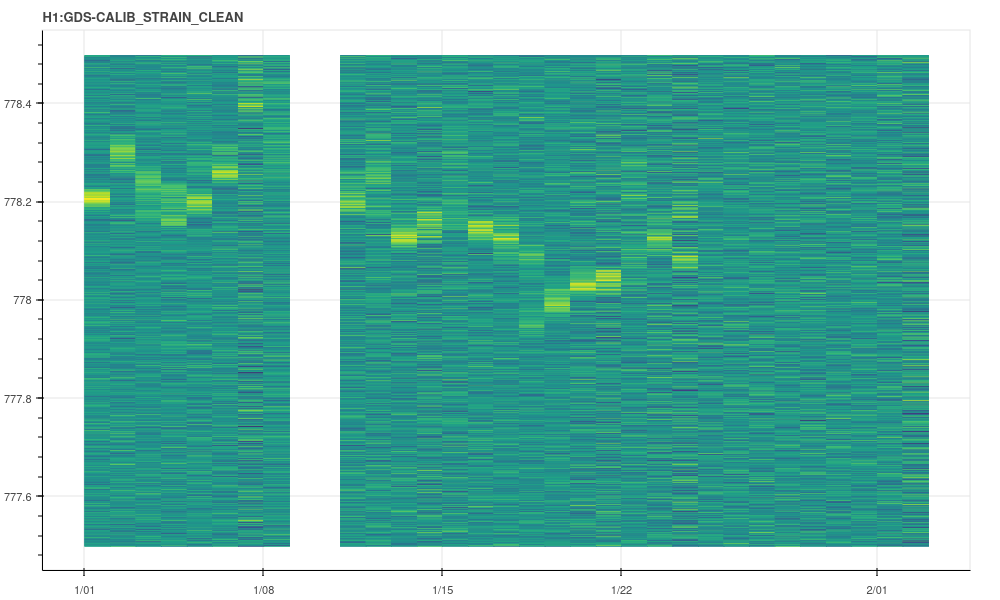
These peaks have disappeared after the change, which is good news. However, these are pretty "broad" peaks by the standards of CW detchar. Figures 1 and 2 show zooms of the spectral comparison. This seems consistent with the frequency variation reported earlier, but notably unlike the mysterious narrow peaks that have been appearing around the violin modes. I've reviewed the rest of the 10-2000 Hz band in Fscan data, and so far all of the improvements I've spotted are similarly "broad."
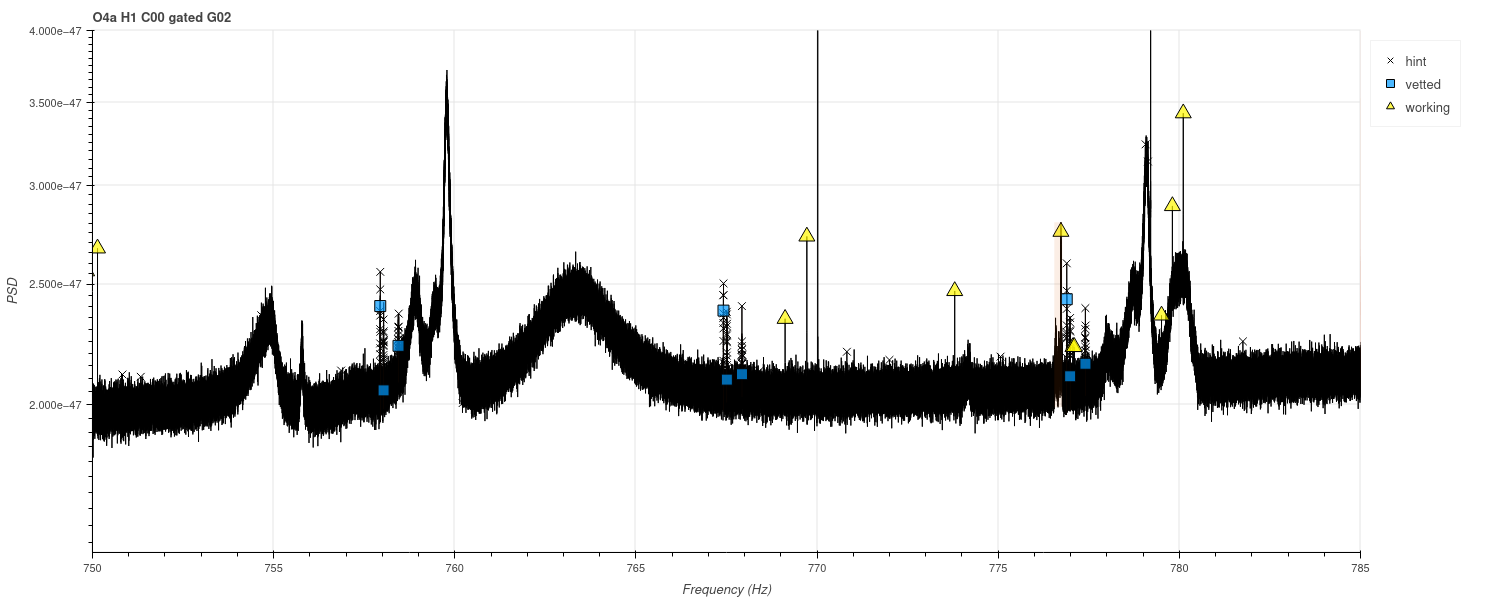
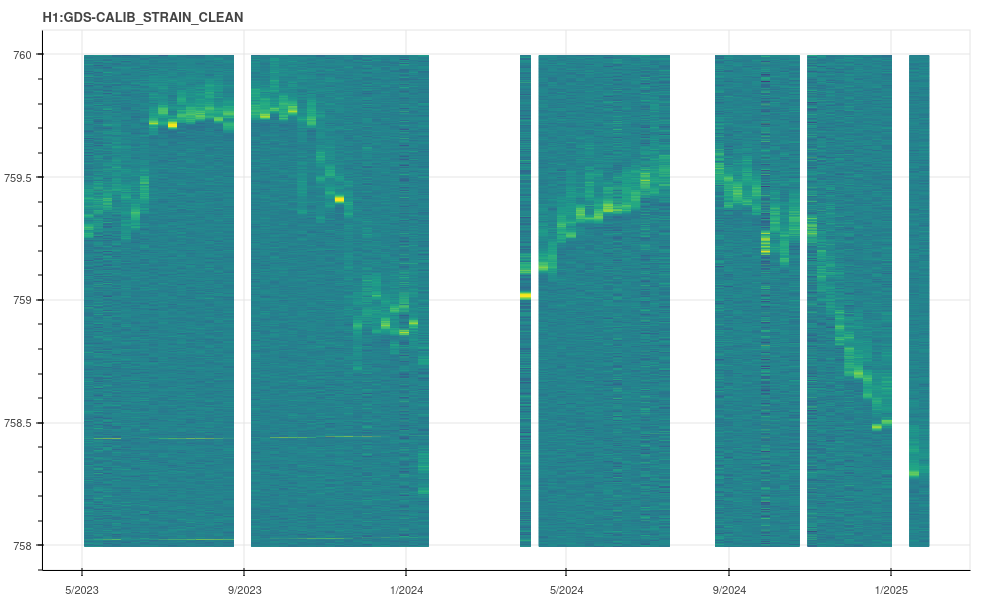
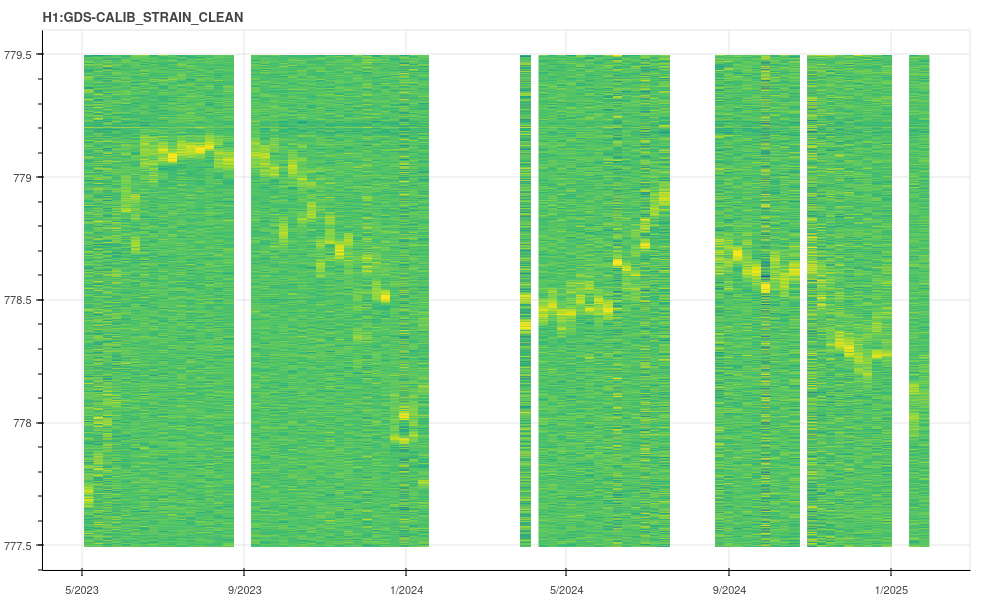
Going back to the example case near 760 Hz: in O4a spectra, a pair of corresponding peaks can be seen (figure 3)-- but not identical. Their locations are slightly off of January 2025 locations. To understand this better, I tracked the peaks in weekly spectra across O4 (figures 4 and 5). Both shift over time, in similar ways. I also double-checked that they've disappeared and stayed gone since Jan 24, see figures 6 and 7. Note that these plots are not all on the same colorbar; they were adjusted for visibility in each case.
I've also not made similar tracks for any of the other peaks, nor looked above 2000 Hz. I have attached the frequencies of all the peaks I've noted as a text file for future investigations; there are way more decimal places than are actually meaningful because I was just picking these off a high-resolution plot and not doing any kind of careful width estimation.
Evidence of violin mode region narrow line contamination persists after the changes
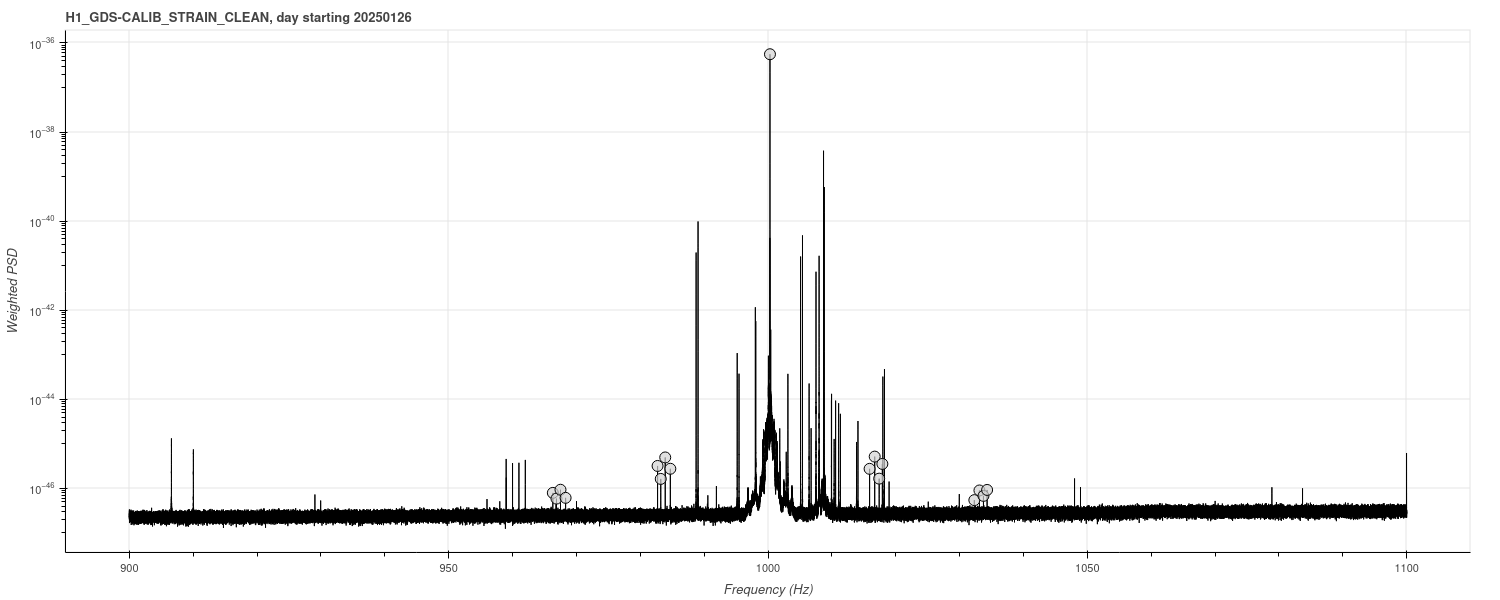
While doing the comparison, I ended up spotting an example of more violin mode region contamination in the January 26 spectrum, just a couple of days after the anti-aliasing improvements. This hadn't been picked up by initial visual inspections of the production Fscan plots, but putting the spectra side-by-side made it much easier to see what was happening. It turns out that a number of the lines are readily identifiable as intermodulations of the elevated violin mode peak +/- calibration line frequencies (a situation which has been seen before, for instance in 79825). Figure 8 highlights these lines (marked with small gray circles), plus the relevant violin mode peak.