jeffrey.kissel@LIGO.ORG - posted 14:28, Monday 24 February 2025 - last comment - 14:58, Monday 24 February 2025(83013)
Explicity Channel List for ALS / SQZ Fiber and ISCT1 Power Monitors
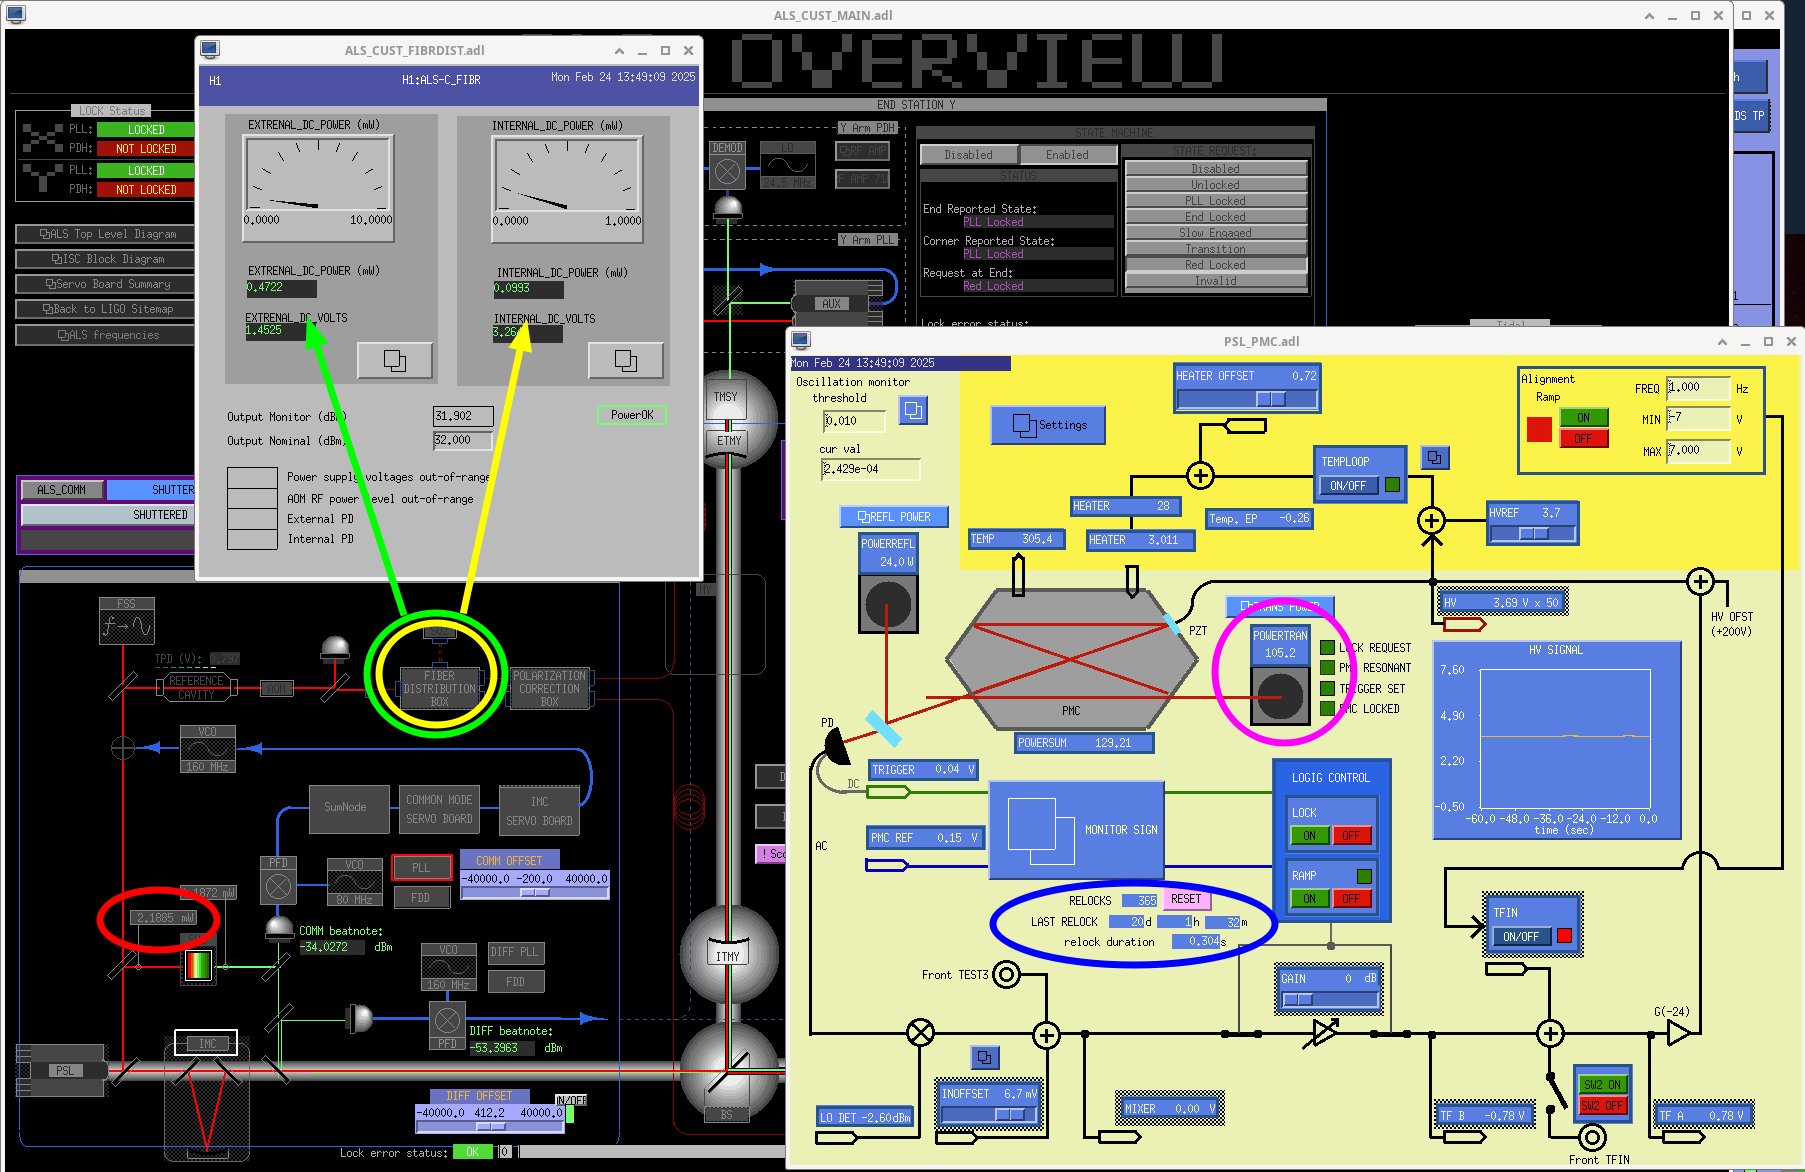
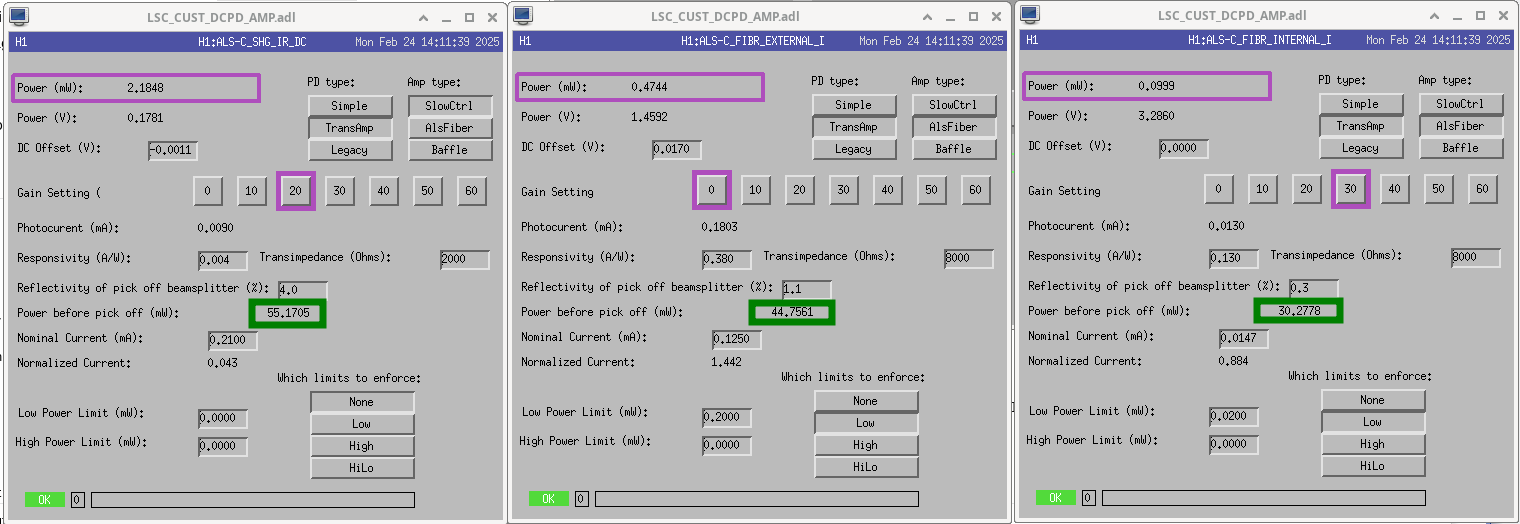
J. Kissel (with help from S. Dwyer and J. Oberling)
ECR E2400083

As a part of the final design review, the SPI team is looking to understand the future duty cycle of the proposed SPI Pick-off path which gets light from downstream of the PMC, see ECR E2400083 -- and specifically the region highlighted in red in the "other files" proposed layout. In order to do so, here are some relevant channels for existing monitor PDs that measure the power in the current PMC / ALS / SQZ paths.

                                        Units          Today's            Location           Relevant Drawing      PD's Name/Location
                                                    Reported Power                                                 within Drawing

(1) H1:PSL-PWR_PMC_TRANS_OUTPUT          [W]           105.0                 PSL              D1300348             "PD04" in transmission of M18, Row 19 / Col 100

(2) H1:ALS-C_SHG_IR_DC_POWER             [mW]            2.200              ISCT1             D1201103             "DCPD" in reflection of BS1 in red "PSL" path from right-most ALS periscope

(3) H1:ALS-C_FIBR_EXTERNAL_DC_POWER      [mW]            0.475               PSL              D1300348             "ThorLabs SM1PD1A" in transmission of ALS-M9, Row 34 / Col 149

(4) H1:ALS-C_FIBR_INTERNAL_DC_POWER      [mW]            0.105             ALS Fiber          D1200136             "ThorLabs SM05PD1A" measuring 50% * 1% sample of beam from PSL
                                                                       Distribution Box

(1) PD is calibrated to display the power downstream of the primary output port of the PMC, even though the PD is measuring a different PMC port and downstream of several power-changing optics (confirmed by Jason to be true).
(2 thru 4) PDs are calibrated to simply report the light at the photodiode, not say, the power of the path upstream of their respective pick-off beam splitters (confirmed by Sheila to be true).

For (2 thru 4), there are versions of those PD signals, (2' thru 4') which *have* been calibrated to the power in the beam path, and those are
(2') H1:ALS-C_SHG_IR_DC_POWERMON         [mW]           56.0
(3') H1:ALS-C_FIBR_EXTERNAL_DC_POWERMON  [mW]           44.7
(4') H1:ALS-C_FIBR_INTERNAL_DC_POWERMON  [mW]           30.2


There's also a useful set of channels the explicitly report the duty-cycle of the PMC too:
   (5) Days, Hours, Minutes of "uptime," resets to zero upon PMC lock loss event
    - H1:PSL-PMC_RELOCK_DAY    [days]
    - H1:PSL-PMC_RELOCK_HOUR   [hours]
    - H1:PSL-PMC_RELOCK_MIN    [minutes]

    How long took to last relock
    - H1:PSL-PMC_RELOCK_DUR    [seconds]

So, if you're performing duty-cycle statistics, say, over a year, you'd trend the H1:PSL-PMC_RELOCK_DAY channel, find the points just before each drop to zero, then take a histogram of those values and find the quantiles to report the median (50% quantile) and then whatever quantile you like to represent "usually."

In the first attached screenshot of MEDM overview screens, I highlight where the channels live.
    - On the ALS overview screen,
        (2) is circled in RED,
        From the hidden "FIBER DISTRIBUTION BOX" link, (3) and (4) are circled in GREEN and YELLOW,
    - PSL PMC overview screen
        (1) is circled in MAGENTA, and
        (5) are circled in BLUE

In the second attached screenshot of the ALS/SQZ subscreens, the screens themselves highlight the "power at the PD" versions, (2 thru 4), in PURPLE, and I highlight the "power in the relevant path" versions, (2' thru 4') in GREEN.

Stay tuned for the results of looking at these channels to derive quantitative estimates of duty cycle.
Images attached to this report
Comments related to this report
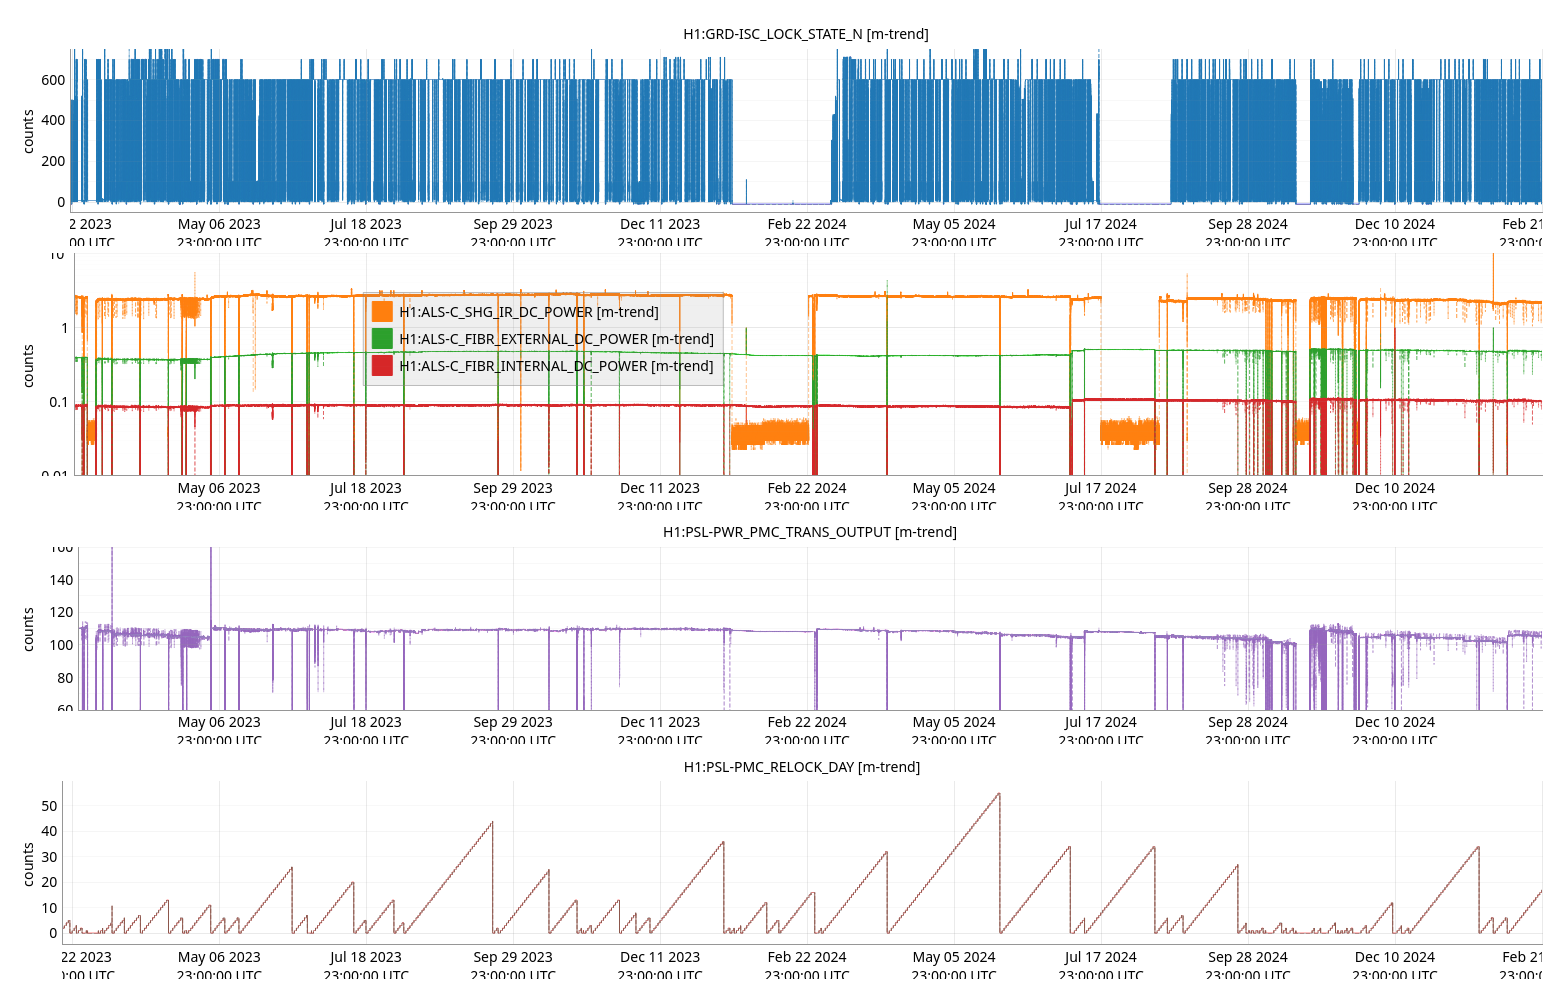
Still qualitative at this point, but a good representative time period should be the two years between July 01 2022 00:00 UTC and July 01 2024 00:00 UTC. This time period contains two observatory cycles of "vent > commission > observe," with O4a lasting from May 24 2023 at 15:00 UTC to Jan 16 2024 at 16:00 UTC, and O4b resuming Apr 10 2024 15:00 UTC.

The ndscope command starts with
ndscope H0:VAC-LY_Y1_PT120A_PRESS_TORR H0:VAC-LY_Y1_PT120B_PRESS_TORR . H1:GRD-ISC_LOCK_STATE_N . H1:PSL-PWR_PMC_TRANS_OUTPUT . H1:PSL-PMC_RELOCK_DAY . H1:ALS-C_SHG_IR_DC_POWERMON . H1:ALS-C_FIBR_EXTERNAL_DC_POWERMON H1:ALS-C_FIBR_INTERNAL_DC_POWERMON &

I've saved the .yaml and .mat file of the session in
    /ligo/home/jeffrey.kissel/2025-02-24/
        alssqzpowr_July2022toJul2024_trend.mat
        alssqzpowr_July2022toJul2024_trend.yaml
and I attach a screenshot of the session.
Images attached to this comment