oli.patane@LIGO.ORG - posted 18:57, Wednesday 05 March 2025 (83203)
ETMX glitch limiter effect on ETMX L3 MASTER_OUT
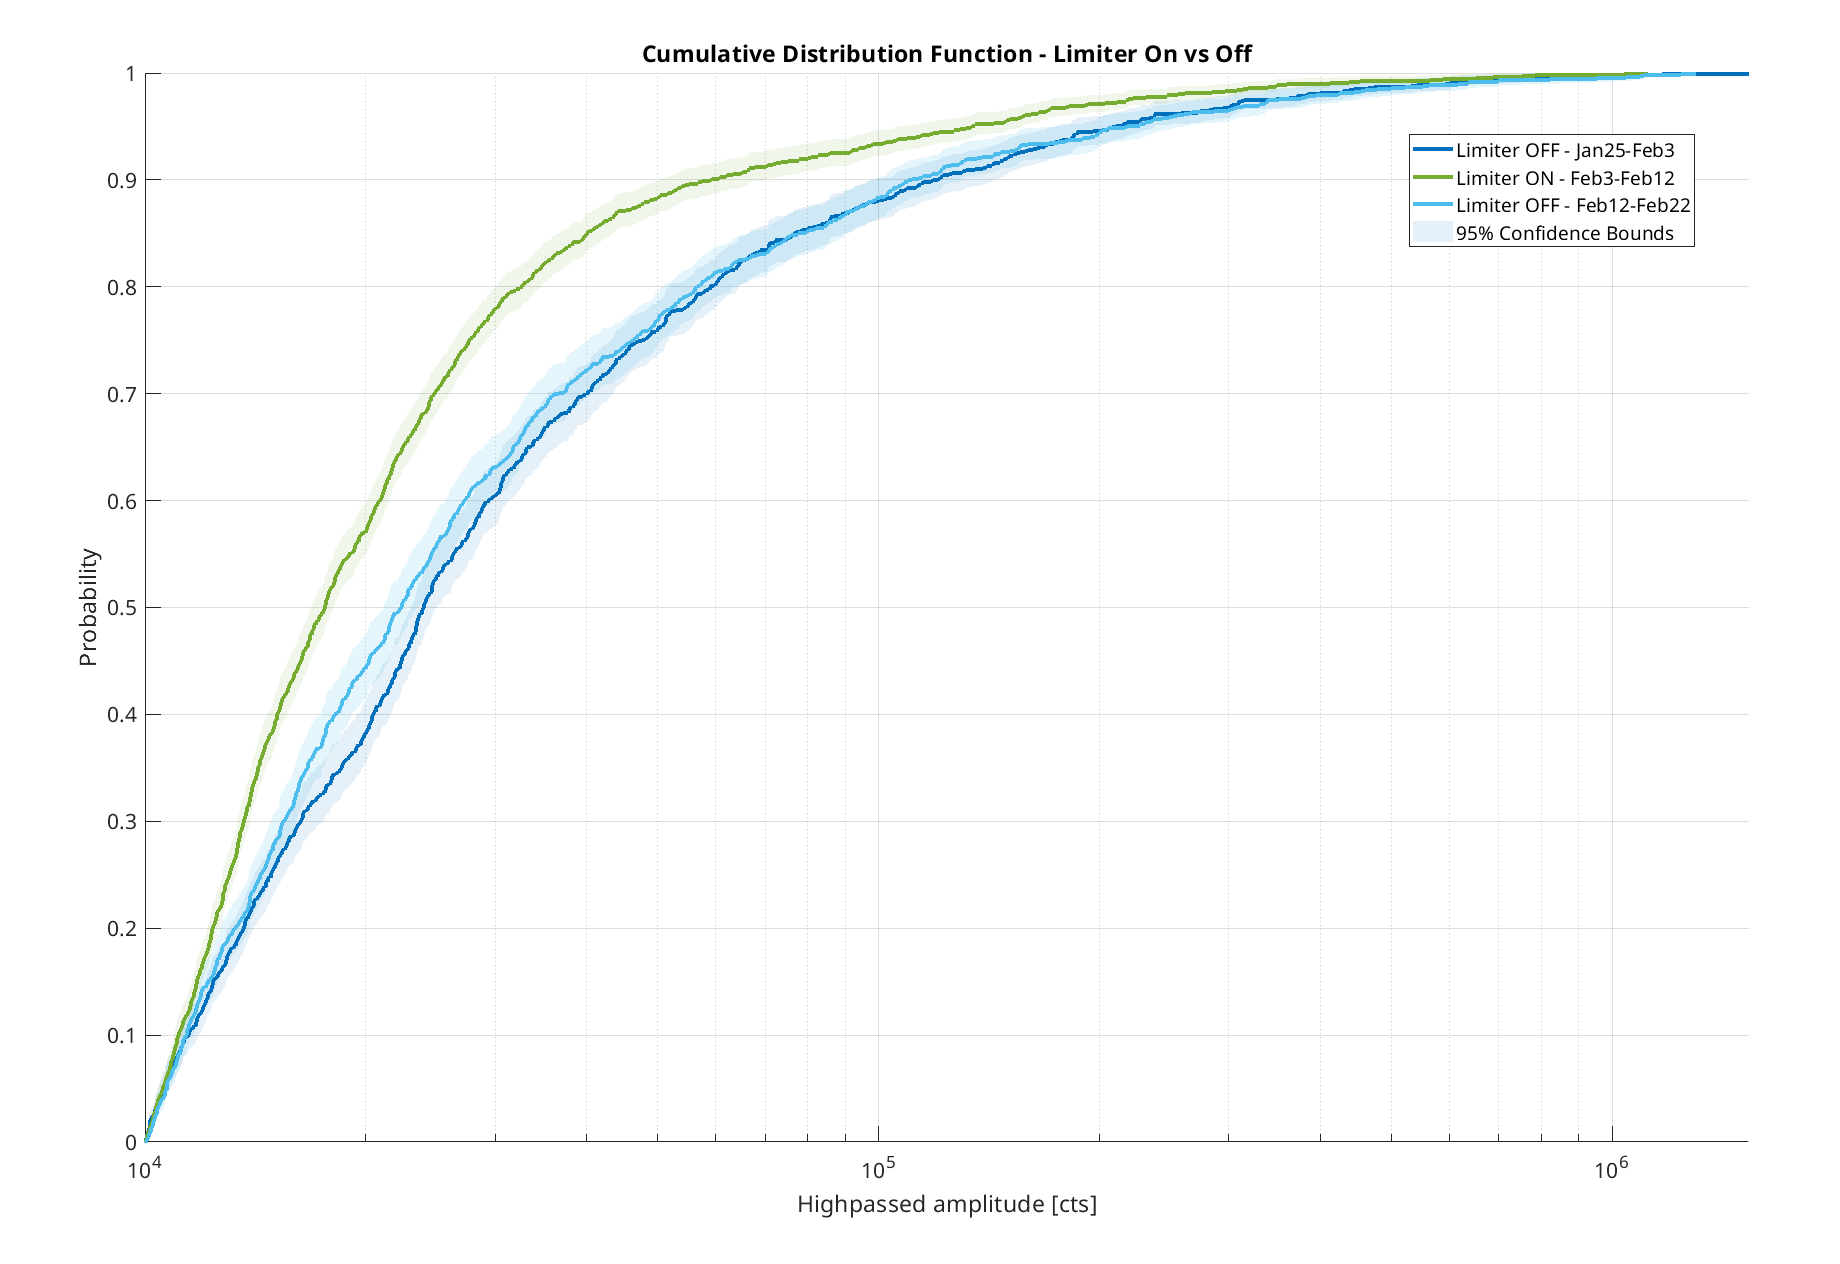
Back at the start of February, Jim put a limiter into the ETMX_L3_ESD OSEM filter banks to limit the output, hoping that it would minimize the number of ETMX glitches and subsequently locklosses(82608). To help us figure out if it did anything, I've taken a look at the amplitude distribution of the ETMX glitches that happen during our locks (the ones we don't lose lock during), comparing the amplitude distribution for the glitches we saw with the limiter on versus the ones that happened with it off.
The three time periods I compared are the following (all about 9 days long):
Limiter off:
- Jan25 14:12UTC - Feb3 16:28UTC
- ~161 hours locked
- ~1,000 ETMX glitches seen (6/hour locked)
- Feb12 22:45UTC - Feb22 01:46UTC
- ~137 hours locked
- ~1,000 ETMX glitches seen (7/hour locked)
Limiter on:
- Feb3 16:28UTC - Feb12 22:45UTC
- ~152 hours locked
- ~1,650 ETMX glitches seen (11/hour locked)
How I got this data (ignore if you don't care about the convoluted scripts I wrote):
For each stretch of time, I used minute trends of GRD_ISC_LOCK_STATE_N to grab all lock stretches based on whether we were in NLN that entire minute (so excluding the first and last minute of the lock). I then went through the lock stretches while looking at one of the L3 MASTER_OUT channels using second trends and grabbed any time where the min or max went above a reasonably low value, low enough that it would also catch small ETMX glitches. However, this method also catches any other time the OSEM was moving a lot, such as during earthquakes, so I then grabbed the raw data for that channel, and then ran that data plus the two seconds on either side through a high pass filter. This was a method we previously implemented into the lockloss tool to help us find ETMX glitches right before locklosses. Then I looked through the high passed data with scipy's signal.find_peaks and looked for peaks over a certain threshold and at least 25ms apart. Any peaks found were logged into a txt file. In matlab I used the ecdf function to calculate the cumulative distribution and plotted the data from the three stretches of time.
Looking at the results:
The plot shows that the two stretches of time where the limiter was off have similar distributions of glitch amplitude probabilities, so that's good to know they line up with each other well. Looking at the data set for when the limiter was on, the distribution differs - there was a higher probability of glitches occurring at all amplitudes as compared to when the limiters were off. This also generally lines up with what we see when we just look at the basic stats for each data stretch - even though all three sets are similar in the amount of hours locked, there were about 50% more ETMX glitches when limiters were on.
The limiter was turned back on yesterday (83158), so it'll be interesting to see if we get a similar distribution as before.
Images attached to this report
Non-image files attached to this report
