J. Freed
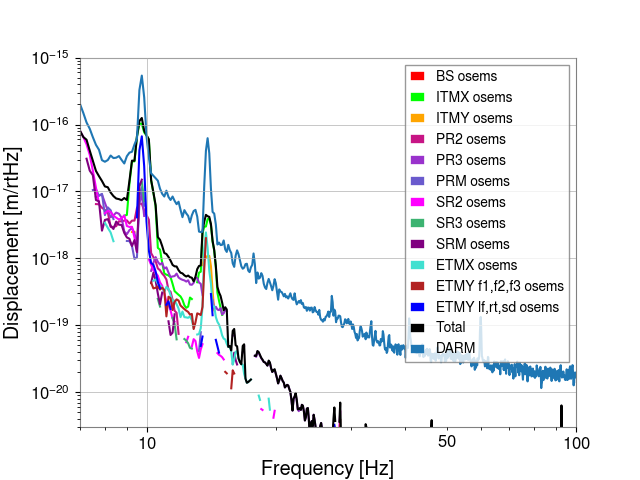
This is the summary page for the investigations at LHO into the First Stage BOSEM damping contributions to DARM. PR3 shows the strongest contribution to DARM by about a factor of 10 below DARM between 8Hz - 25Hz. ETMX and ETMY shows cotributions to DARM by a factor of 20 between 10Hz - 14Hz below DARM. SR2, SRM, and PR2 shows strong contribution between 7Hz - 12Hz by factors between 4 to 10 below DARM. Where as BS, ITMX, ITMY shows little to no contributions.
This is a summary of the work done previously for BS, ITMX, ITMY, PR2, PR3, PRM, SR2, SR3, SRM, ETMX, and ETMY. Starting with PR3, data was take with excitation gains of 300 ontop of the 600 gains to help check against any noise gained independant of excitation during data collection. This summary page only uses the 600 gains however as extra data was not collected for all suspentions.
The plots and code are located at /ligo/home/joshua.freed/bosem/sum/scripts. I used the code located under /ligo/home/joshua.freed/bosem/sum/scripts/osem_budgeting.py to produce the sum of all contributions as well as the individual plots.
Note that it was discovered that the bounce (~9.69Hz) and roll (~13.81Hz) modes would sometimes increase or decrease seemingly independant from injections, giving false positives or false negatives at frequencies around those values for sensors tested when this happens. A good example is compairing ITMX with PR3. ITMX shows no contributions to DARM except around the bounce and roll modes only for the bosems that were tested later in time, as well as, the estimated contribution being greater than DARM itself. It is theorized that the bounce mode independanly incresed between the F3 and LF measurment. Where as PR3 shows strong contributions at frequencies except at the bounce and roll modes, leading to the theory that they decresed after the background. As such, every estimated contribution around the bounce and roll modes should be brought into question.
main.png and
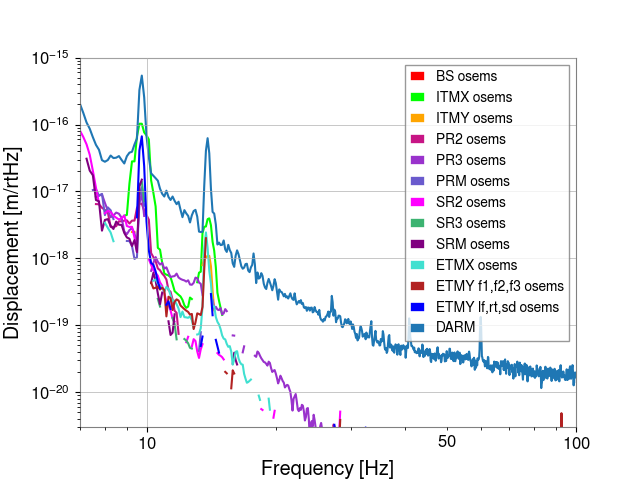
main_no_sum.png Show the each suspentions total contributions to DARM on the same plot with and without the quadature sum of of the suspentions total contributions respectivly. Igonring the bounce and roll modes, the bosem noise seems to have a linear roll off.
Below are the graphs showing the estimated contributions from each bosem on each suspension:
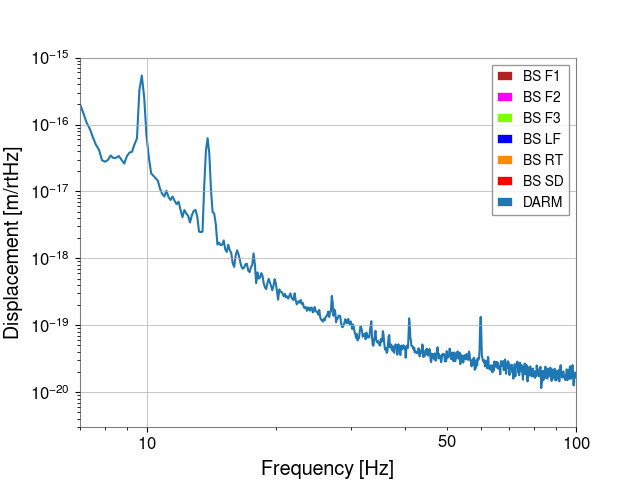
BS.png Showed no noticible effect into DARM
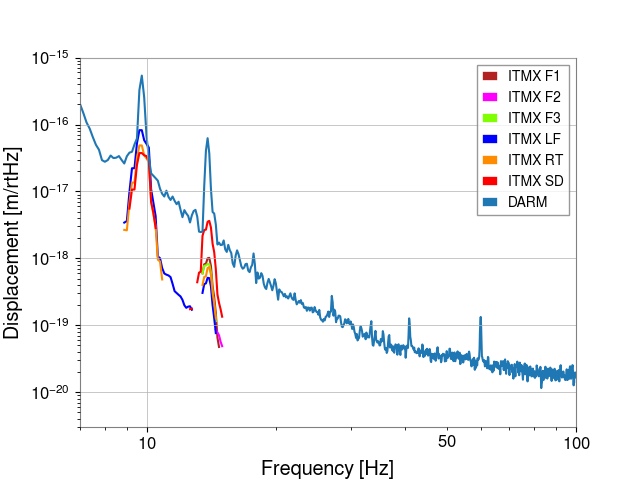
ITMX.png Shows little noticible effect into DARM besides around the bounce and roll modes
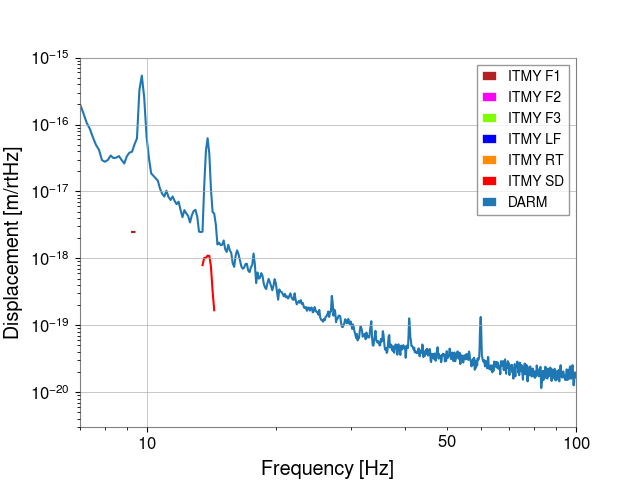
ITMY.png Shows no noticible effect into DARM besides the SD osem around the roll mode
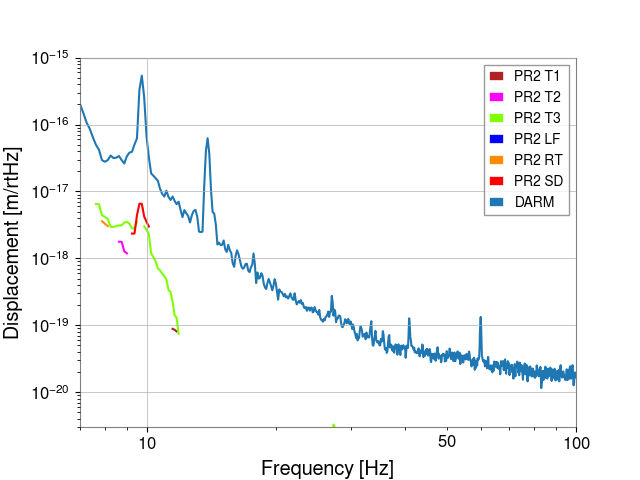
PR2.png T3 sensor shows contibutions in the 8Hz -12Hz range
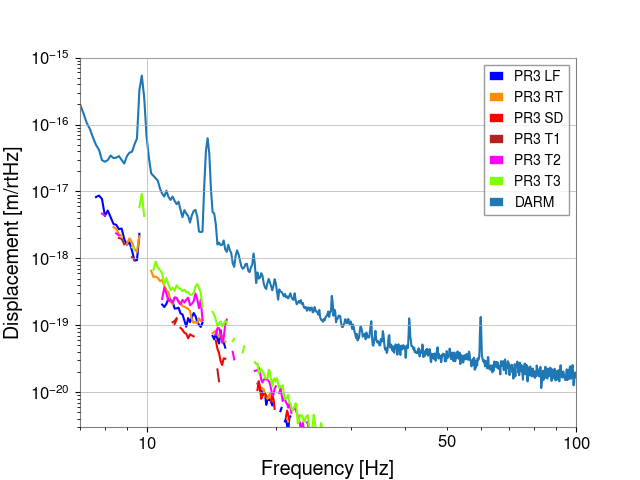
PR3.png Shows the strongest contributions into DARM from all osems. Most come from the LF, RT osems between 8Hz - 10Hz and T2, T3 between 10Hz - 25Hz
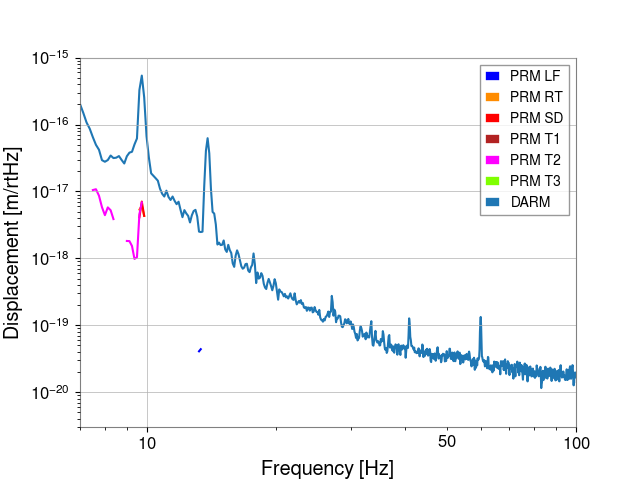
PRM.png T2 Sensor shows contributions in the 7Hz - 9Hz range
SR2.png T2, T3 Sensors shows contribuions in the 7Hz - 14Hz range
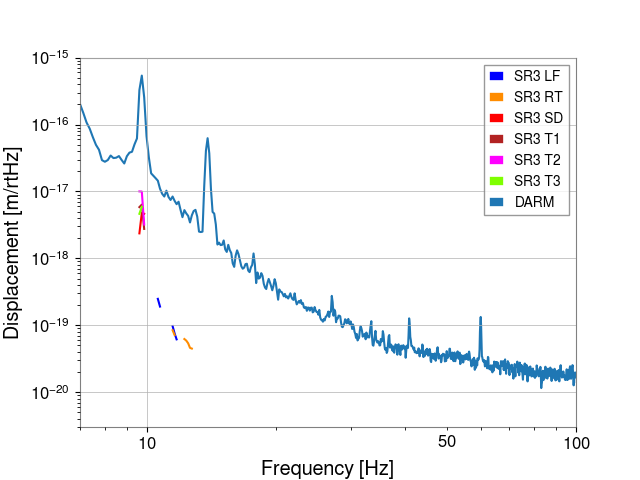
SR3.png LF, RT shows small contributions in the 11Hz - 13Hz range
SRM.png T2, T3 sensors shows contributions in the 7Hz - 12Hz range
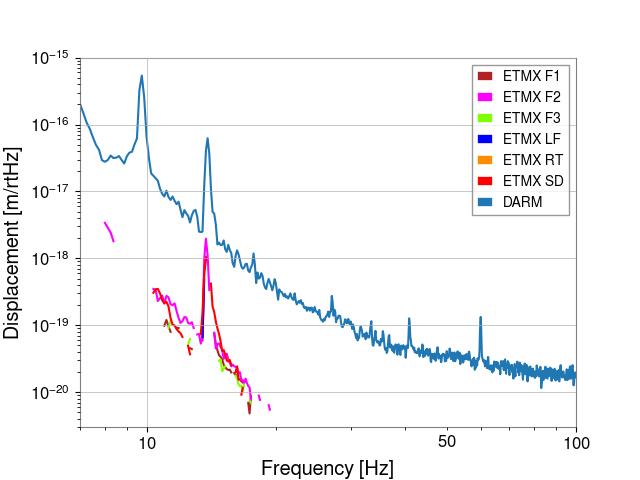
ETMX.png F2, SD sensors shows contributions from 10Hz - 20Hz. with some small contributions from F1, F3 in the same range