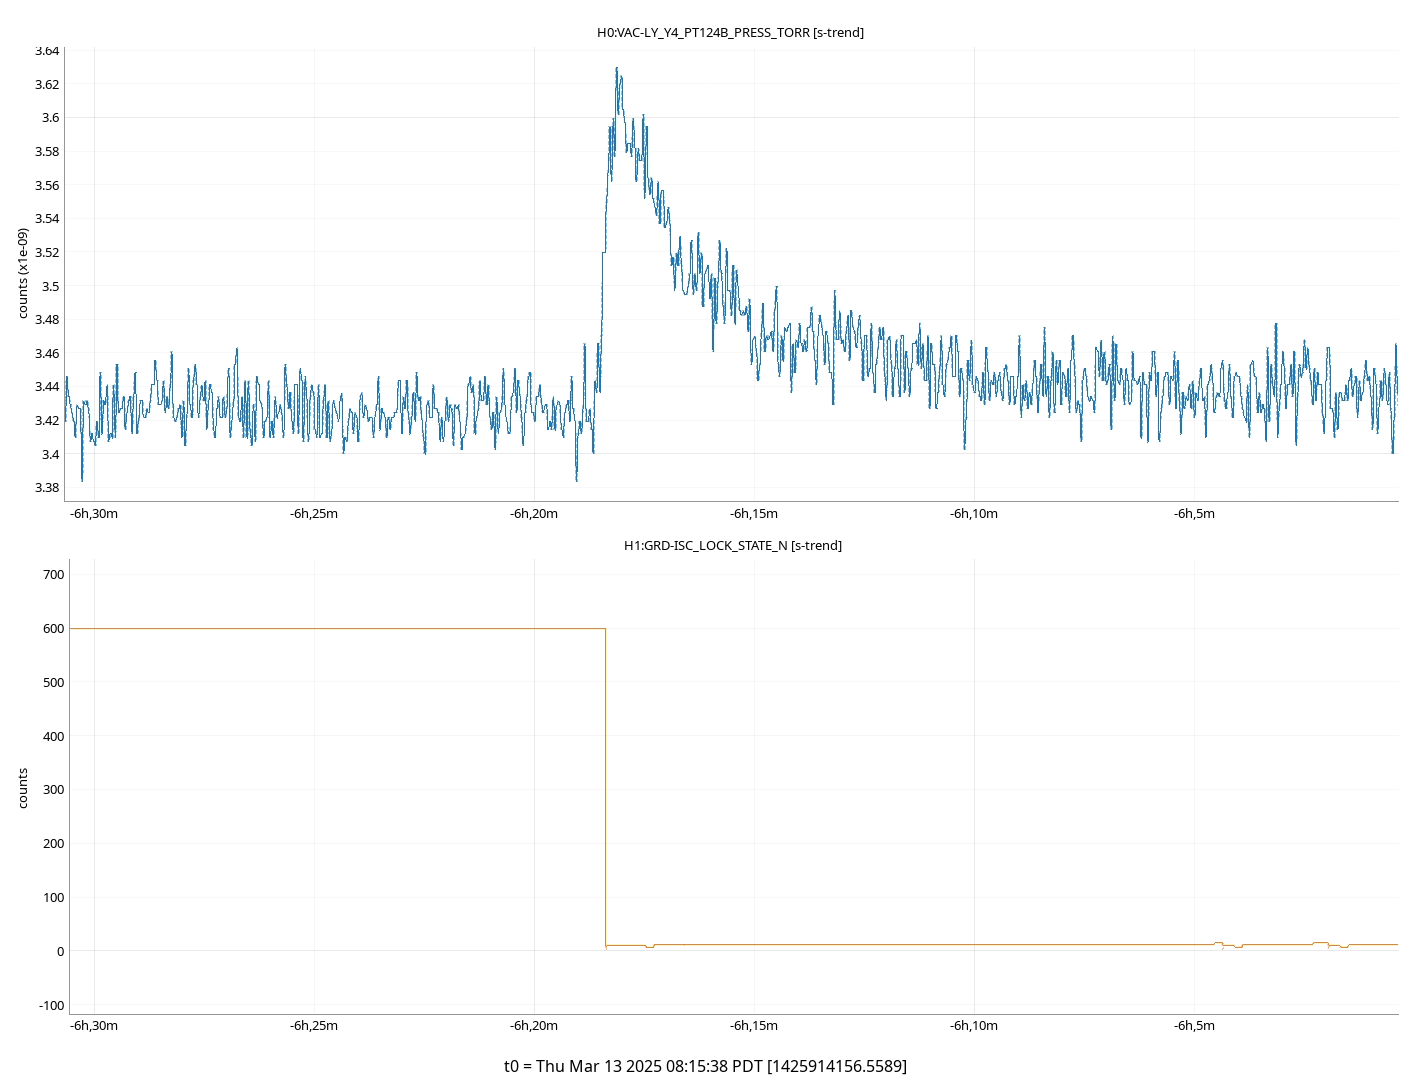
We had a vacuum glitch in the LVEA at 01:57 Thu 13mar2025 PDT which was coincident with a lockloss. The glitch was below VACSTAT's alarm levels by an order of magnitude, so no VACSTAT alert was issued.
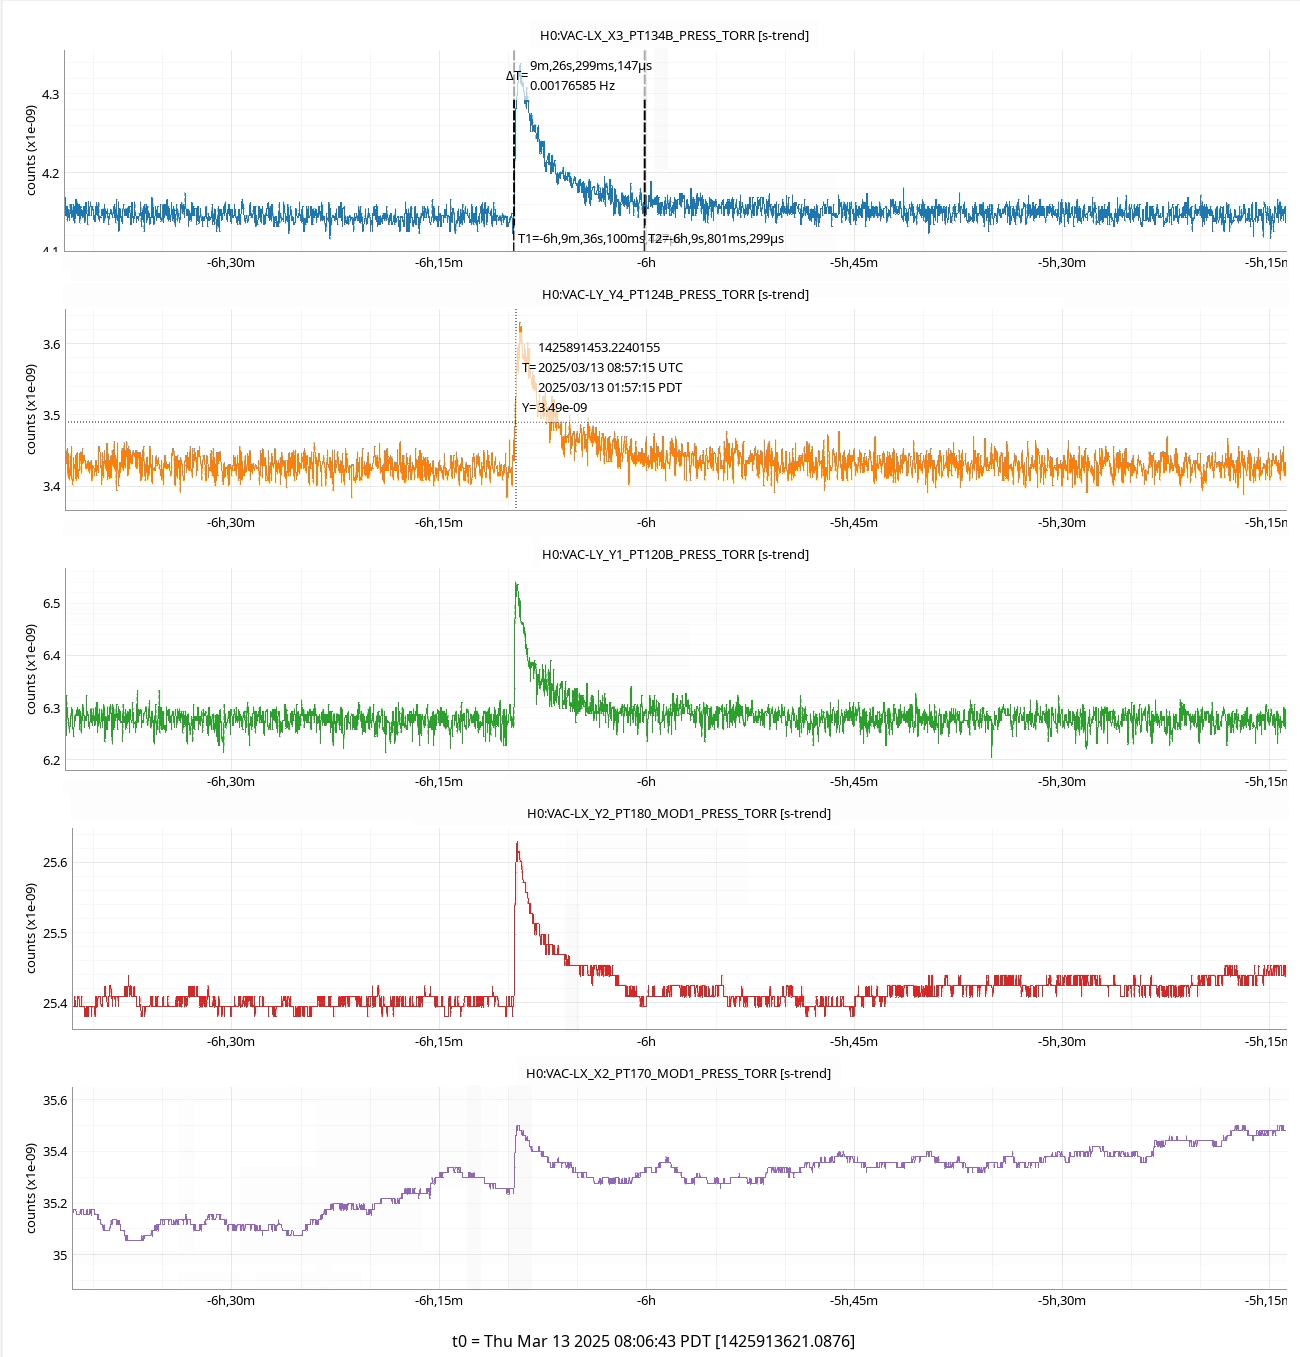
The glitch is seen in most LVEA gauges, and took about 10 minutes to pump down.
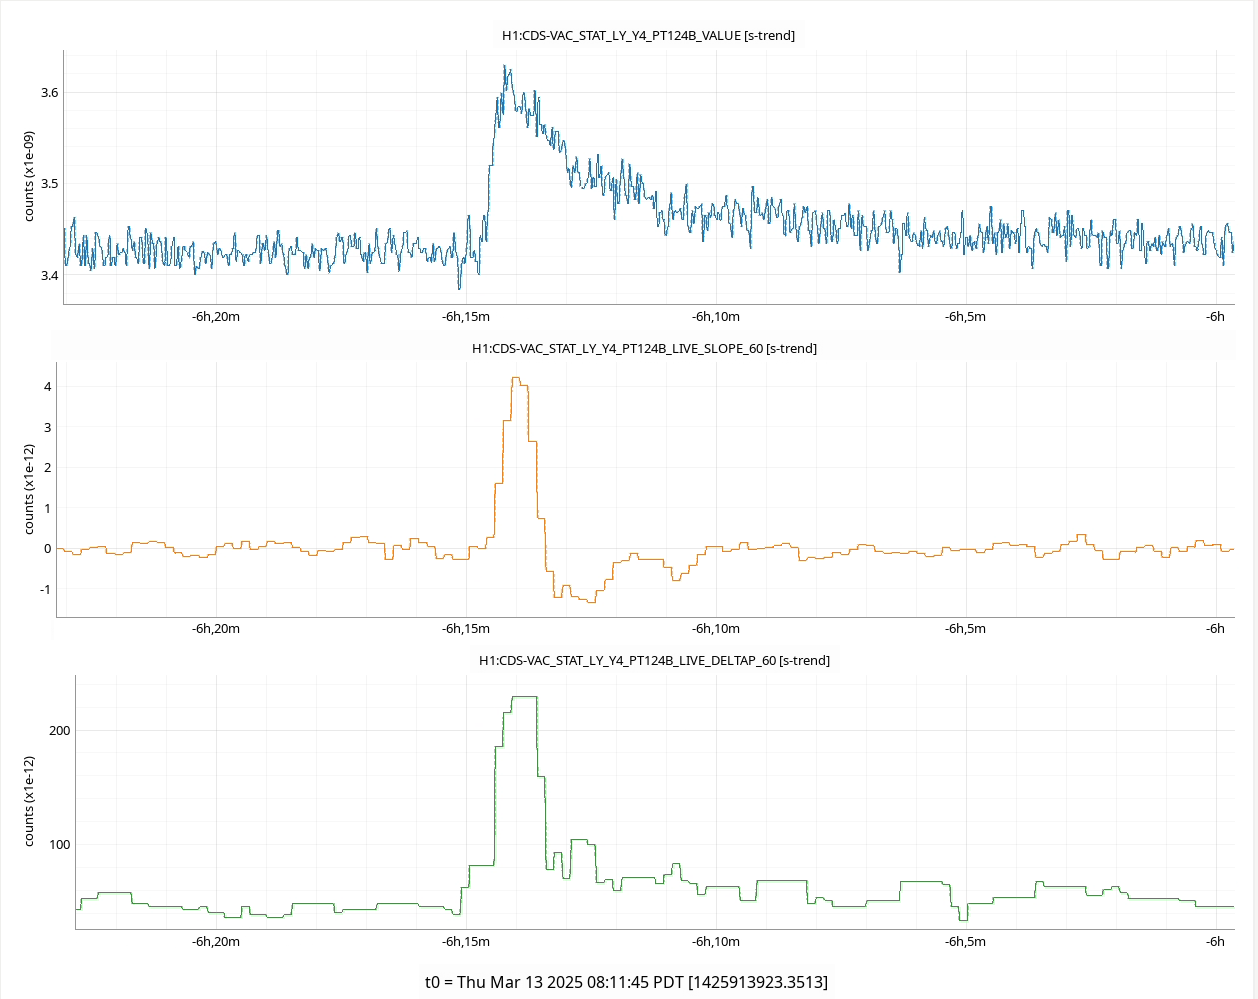
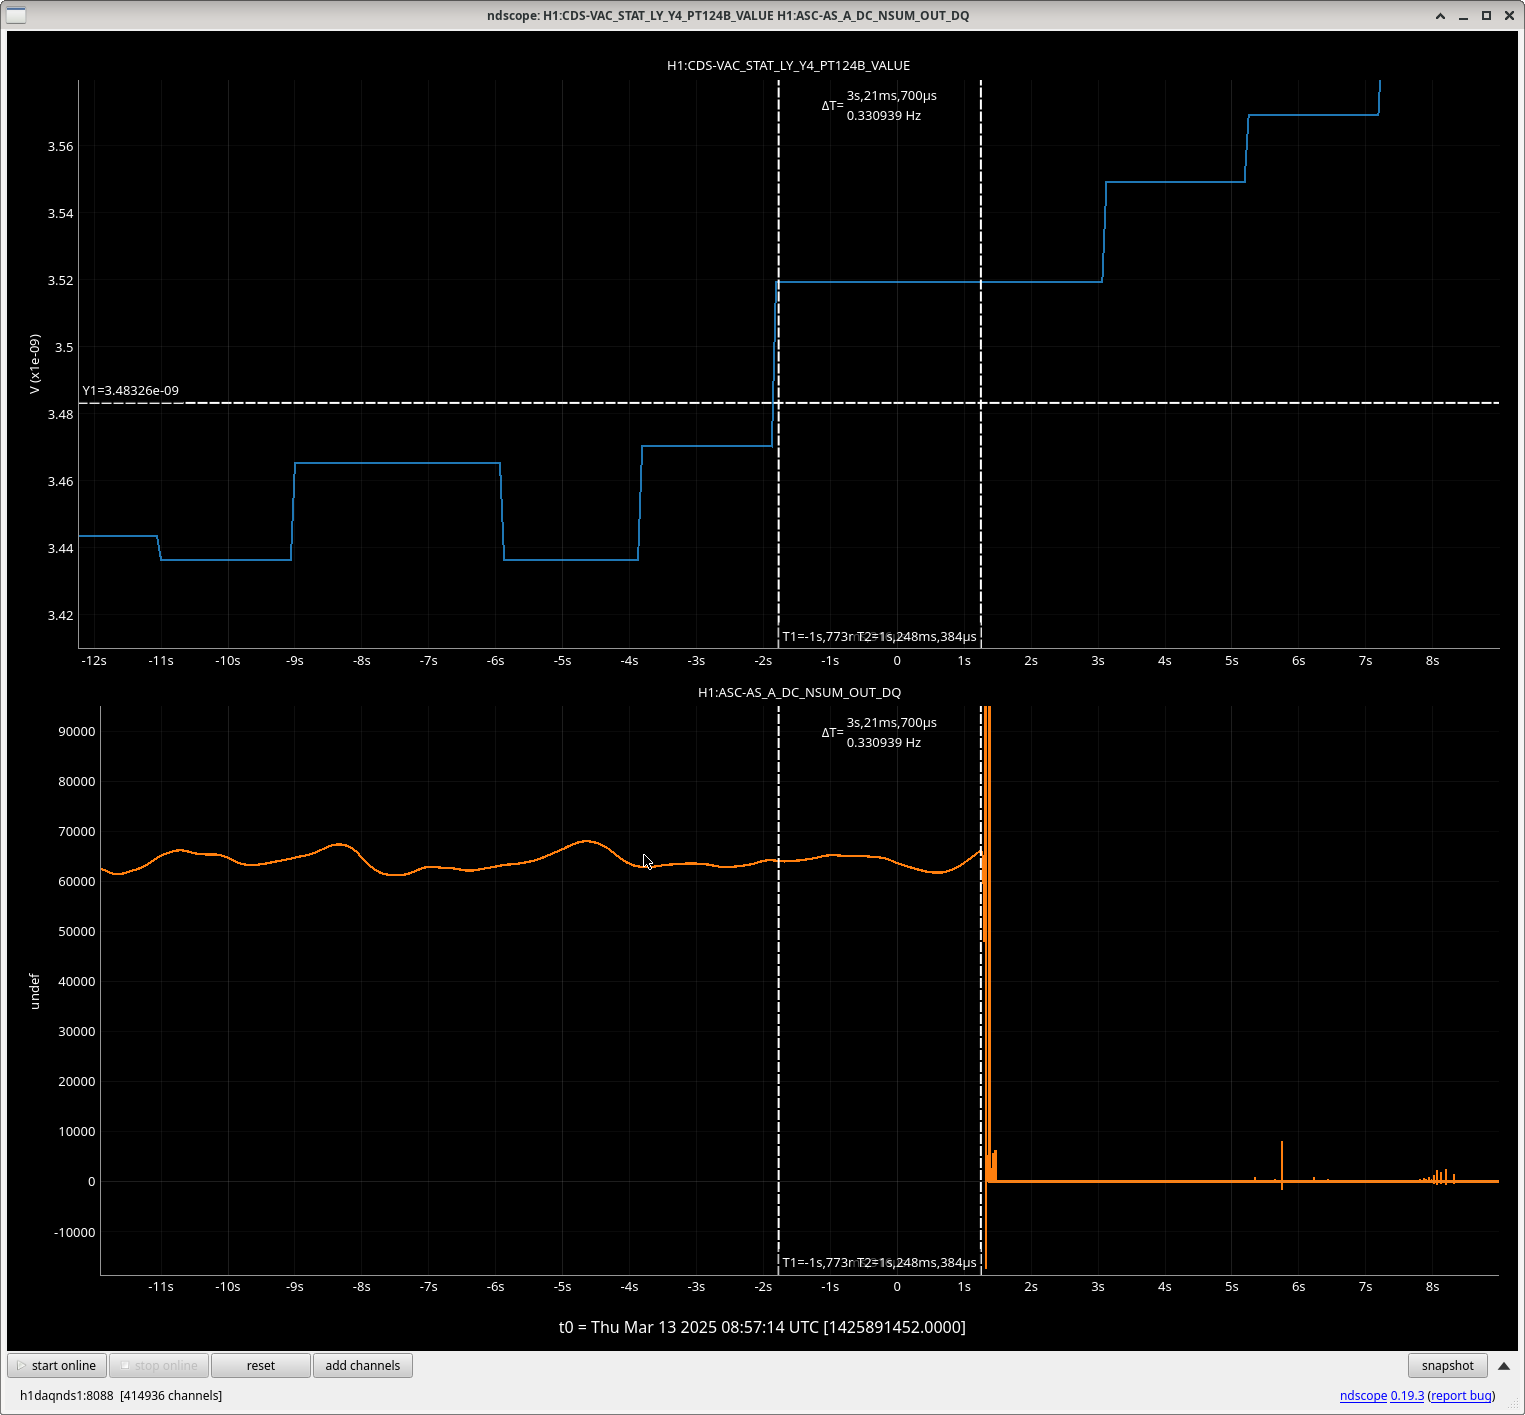
Attached plots show a sample of LVEA gauges, the VACSTAT channels for LY, and the ISC_LOCK lockloss.
Adding the lock loss tag and a link to the lock loss tool - 1425891454
There's no blatantly obvious cause. The wind was definitely picking up right before the lock loss, which can be seen in many of the ASC loops, but I'm not sure it was enough to cause the lock loss.
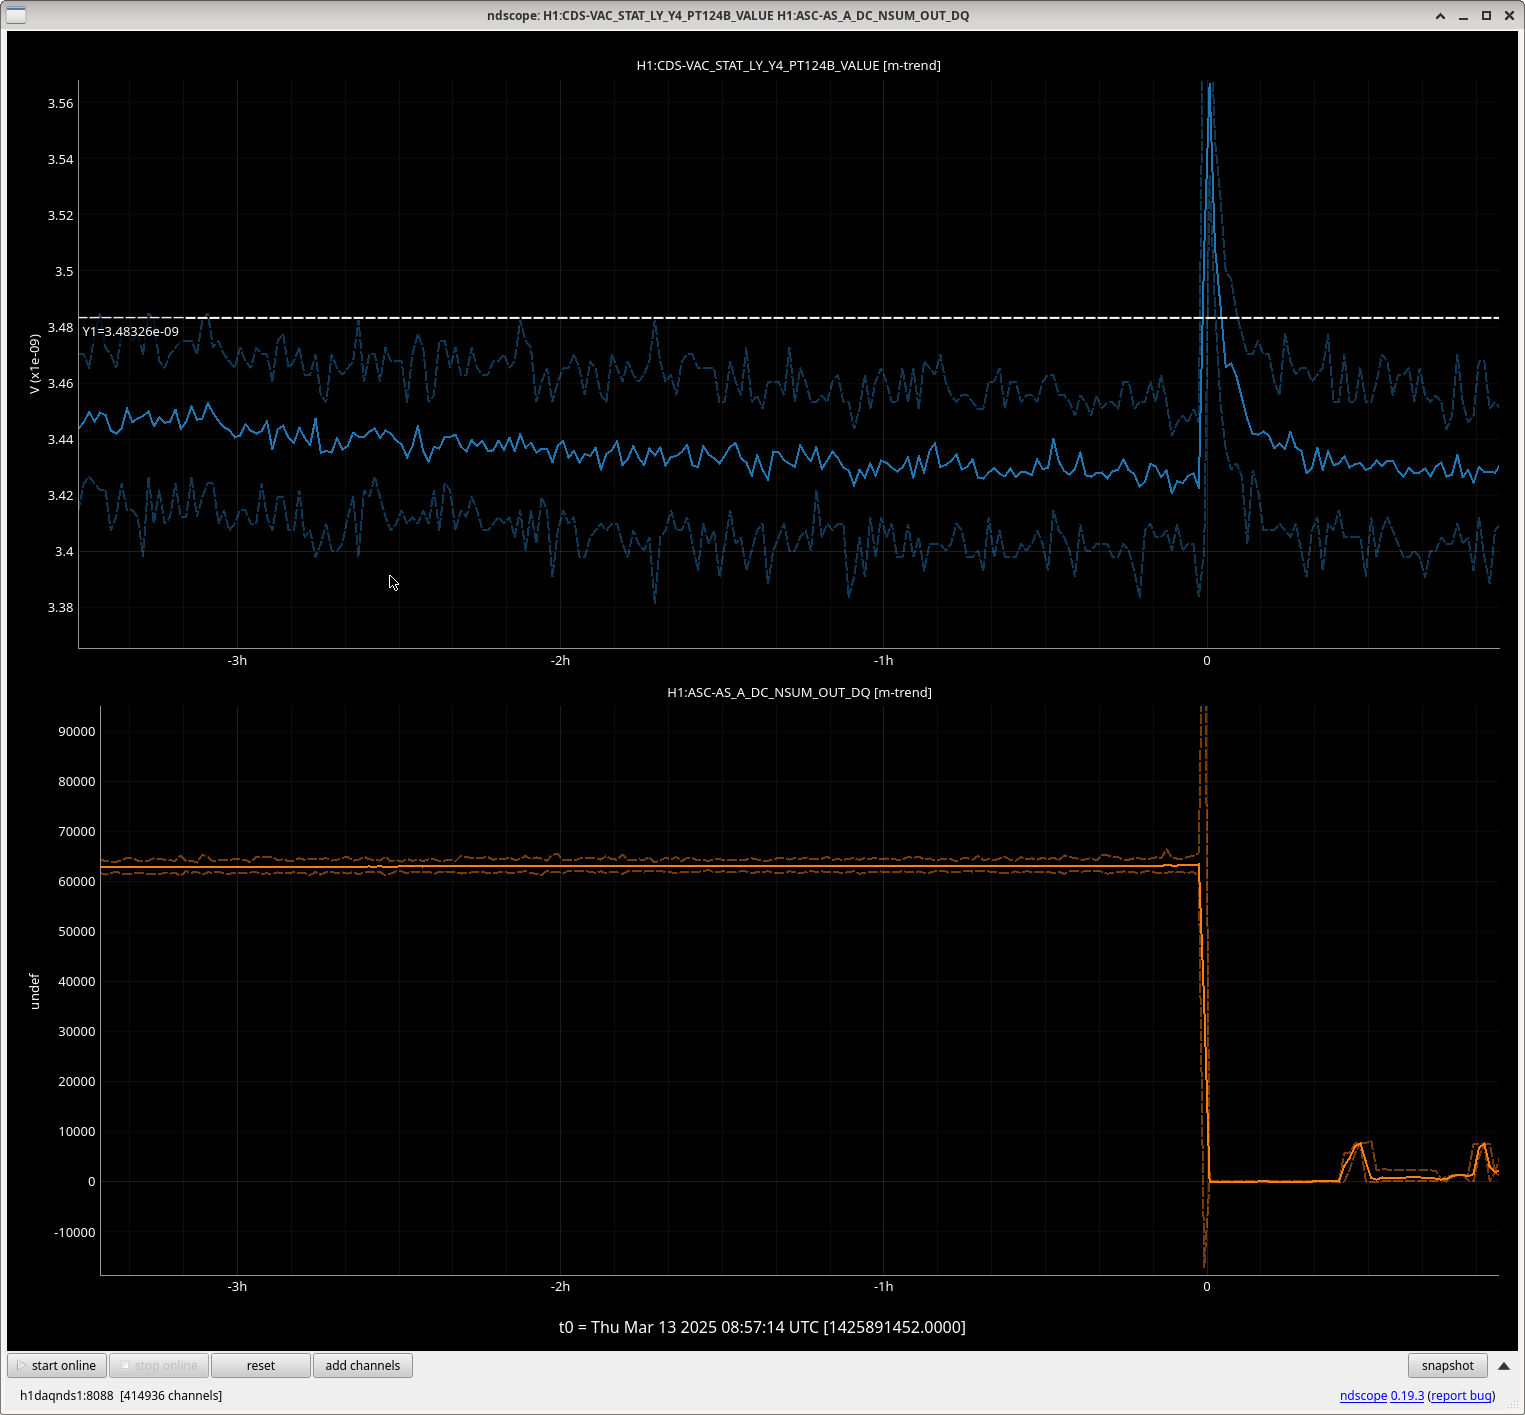
This may be a what-came-first the LL or the VAC spike scenario but looking at the past 3 hour trend of H1:CDS-VAC_STAT_LY_Y4_PT124B_VALUE attached, it does not go above 3.48e-9. However 3 seconds before the lockloss, it jumps to 3.52e-9 attached. This seems suspiciously like whatever caused the VAC spike came before the lockloss.
There is a LL issue open to add a tag for this: #227, as it was previously seen in 82907.
The only possible plausible vacuum glitch without the laser hitting something first, is IP-glitch. Gerardo is looking into this now.

Otherwise, I would say the laser hit something, which didn't cause lockloss right away (only 3 seconds later), but - obviously - caused pressure spike.

The rising wind is just too big of a coincidence to me..
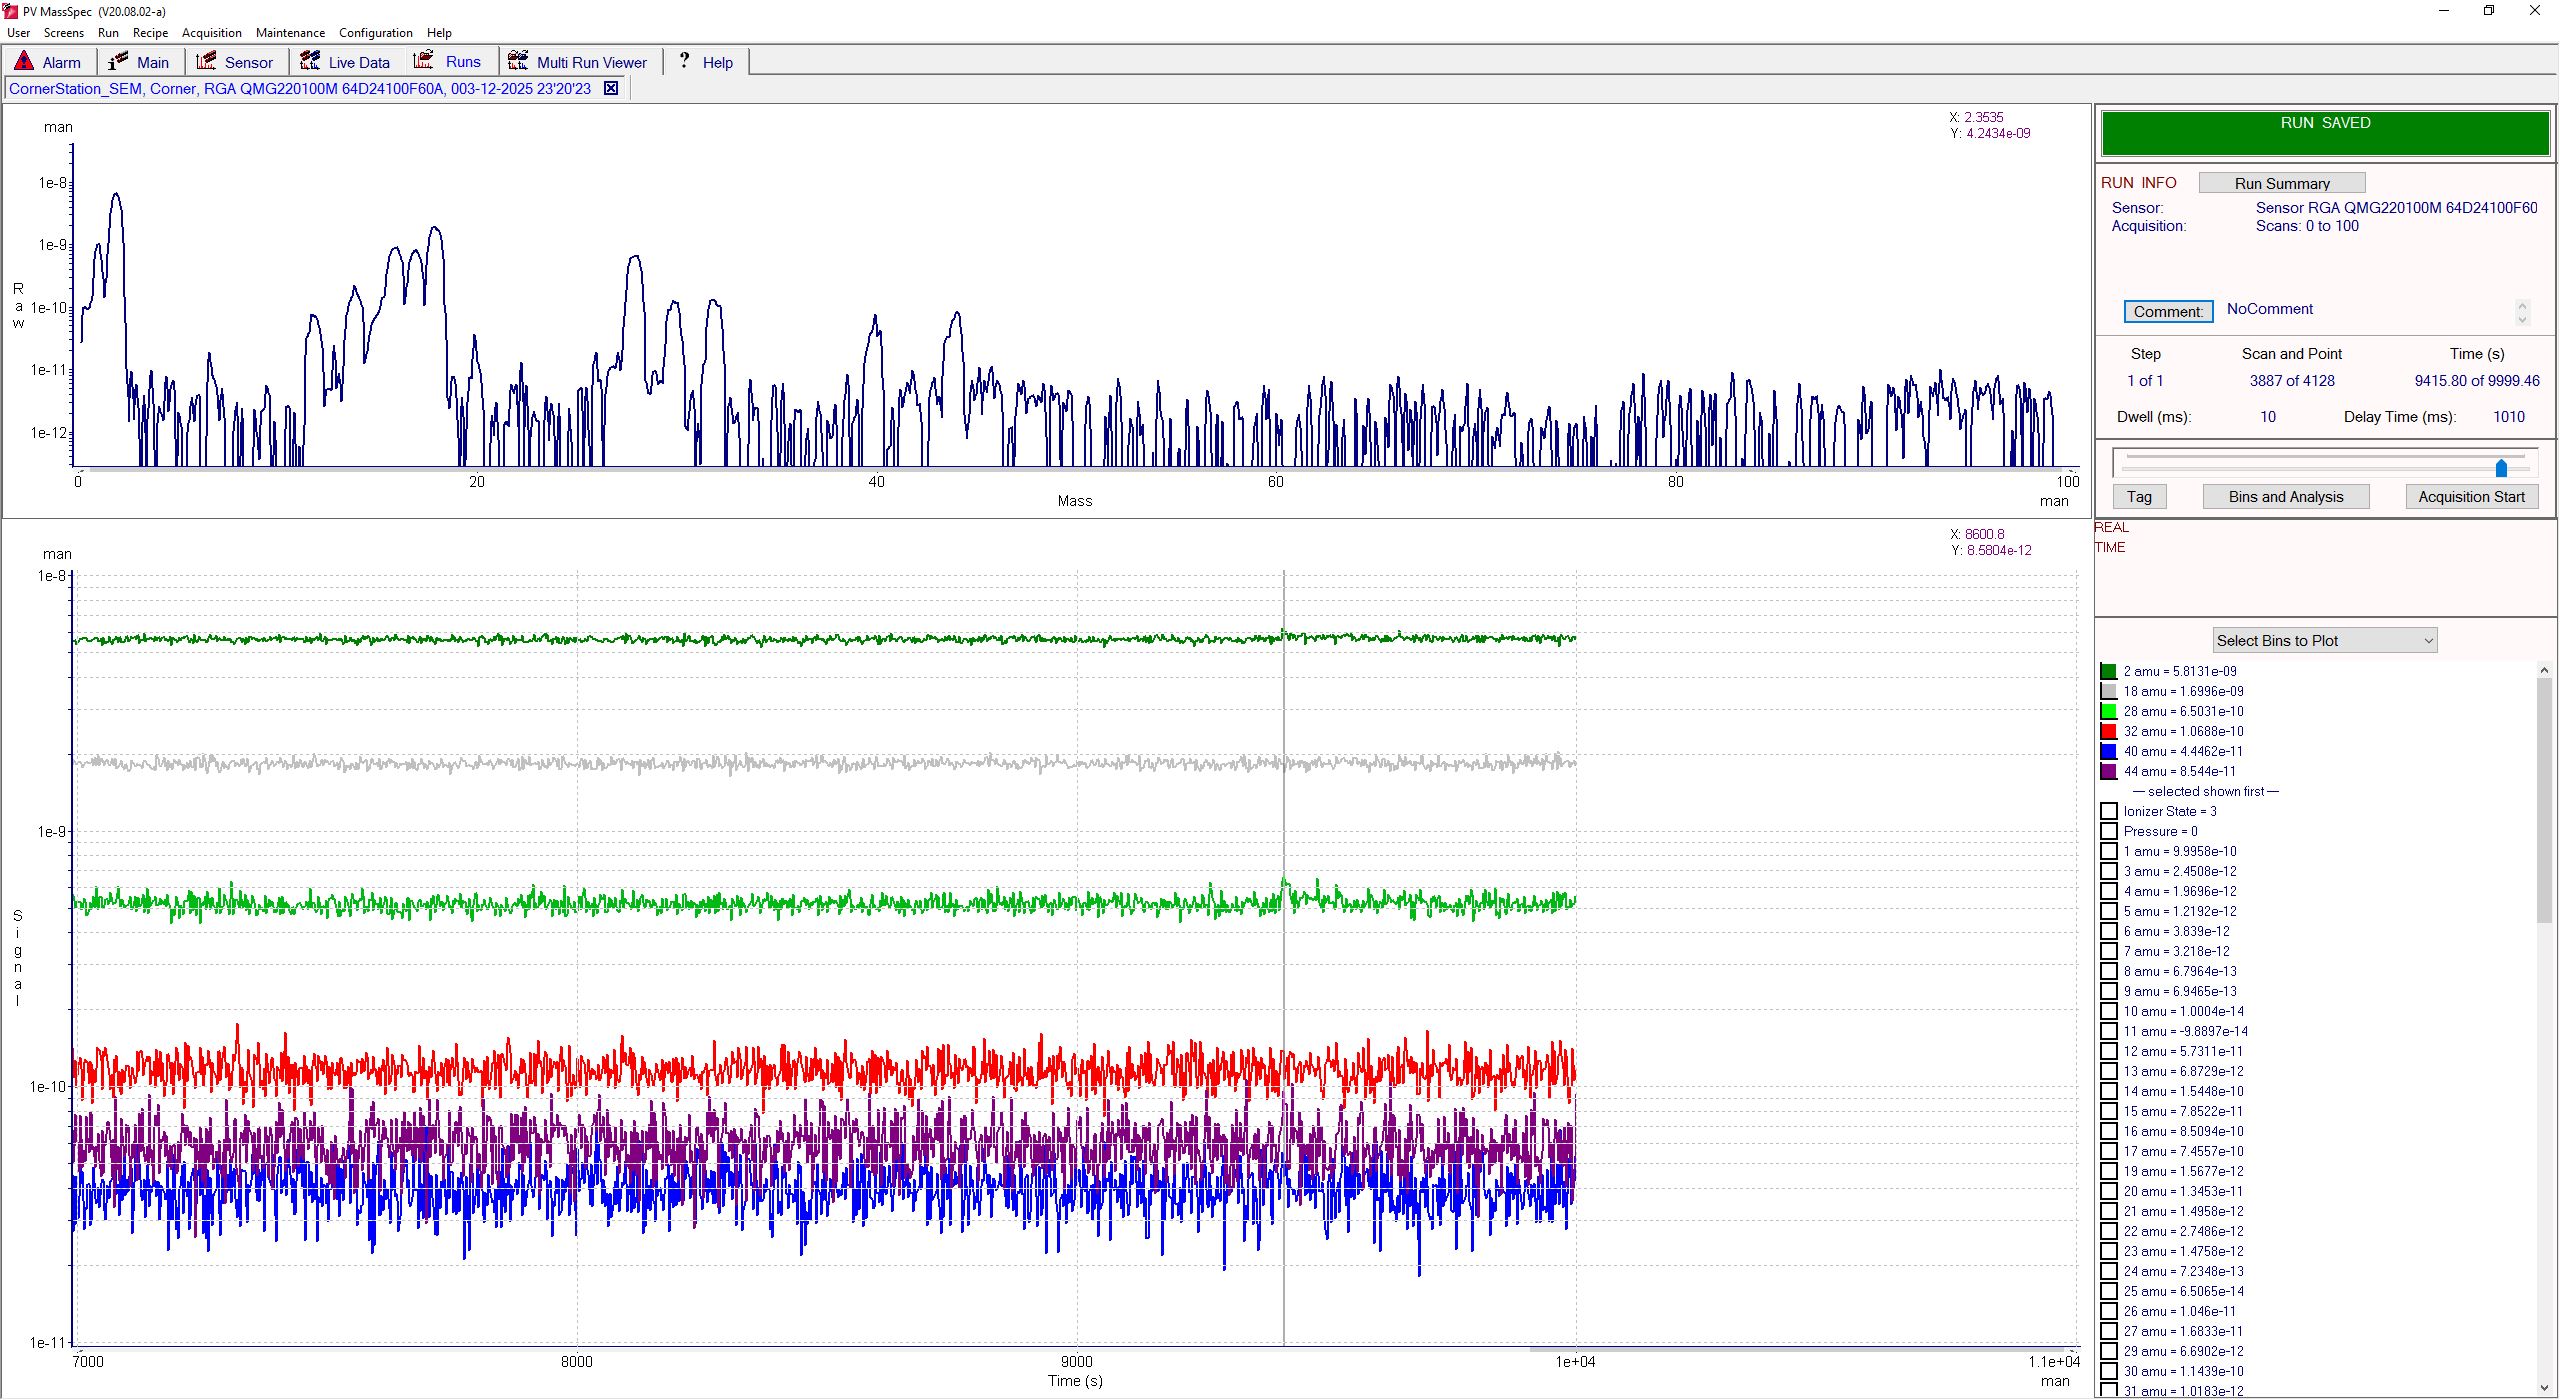
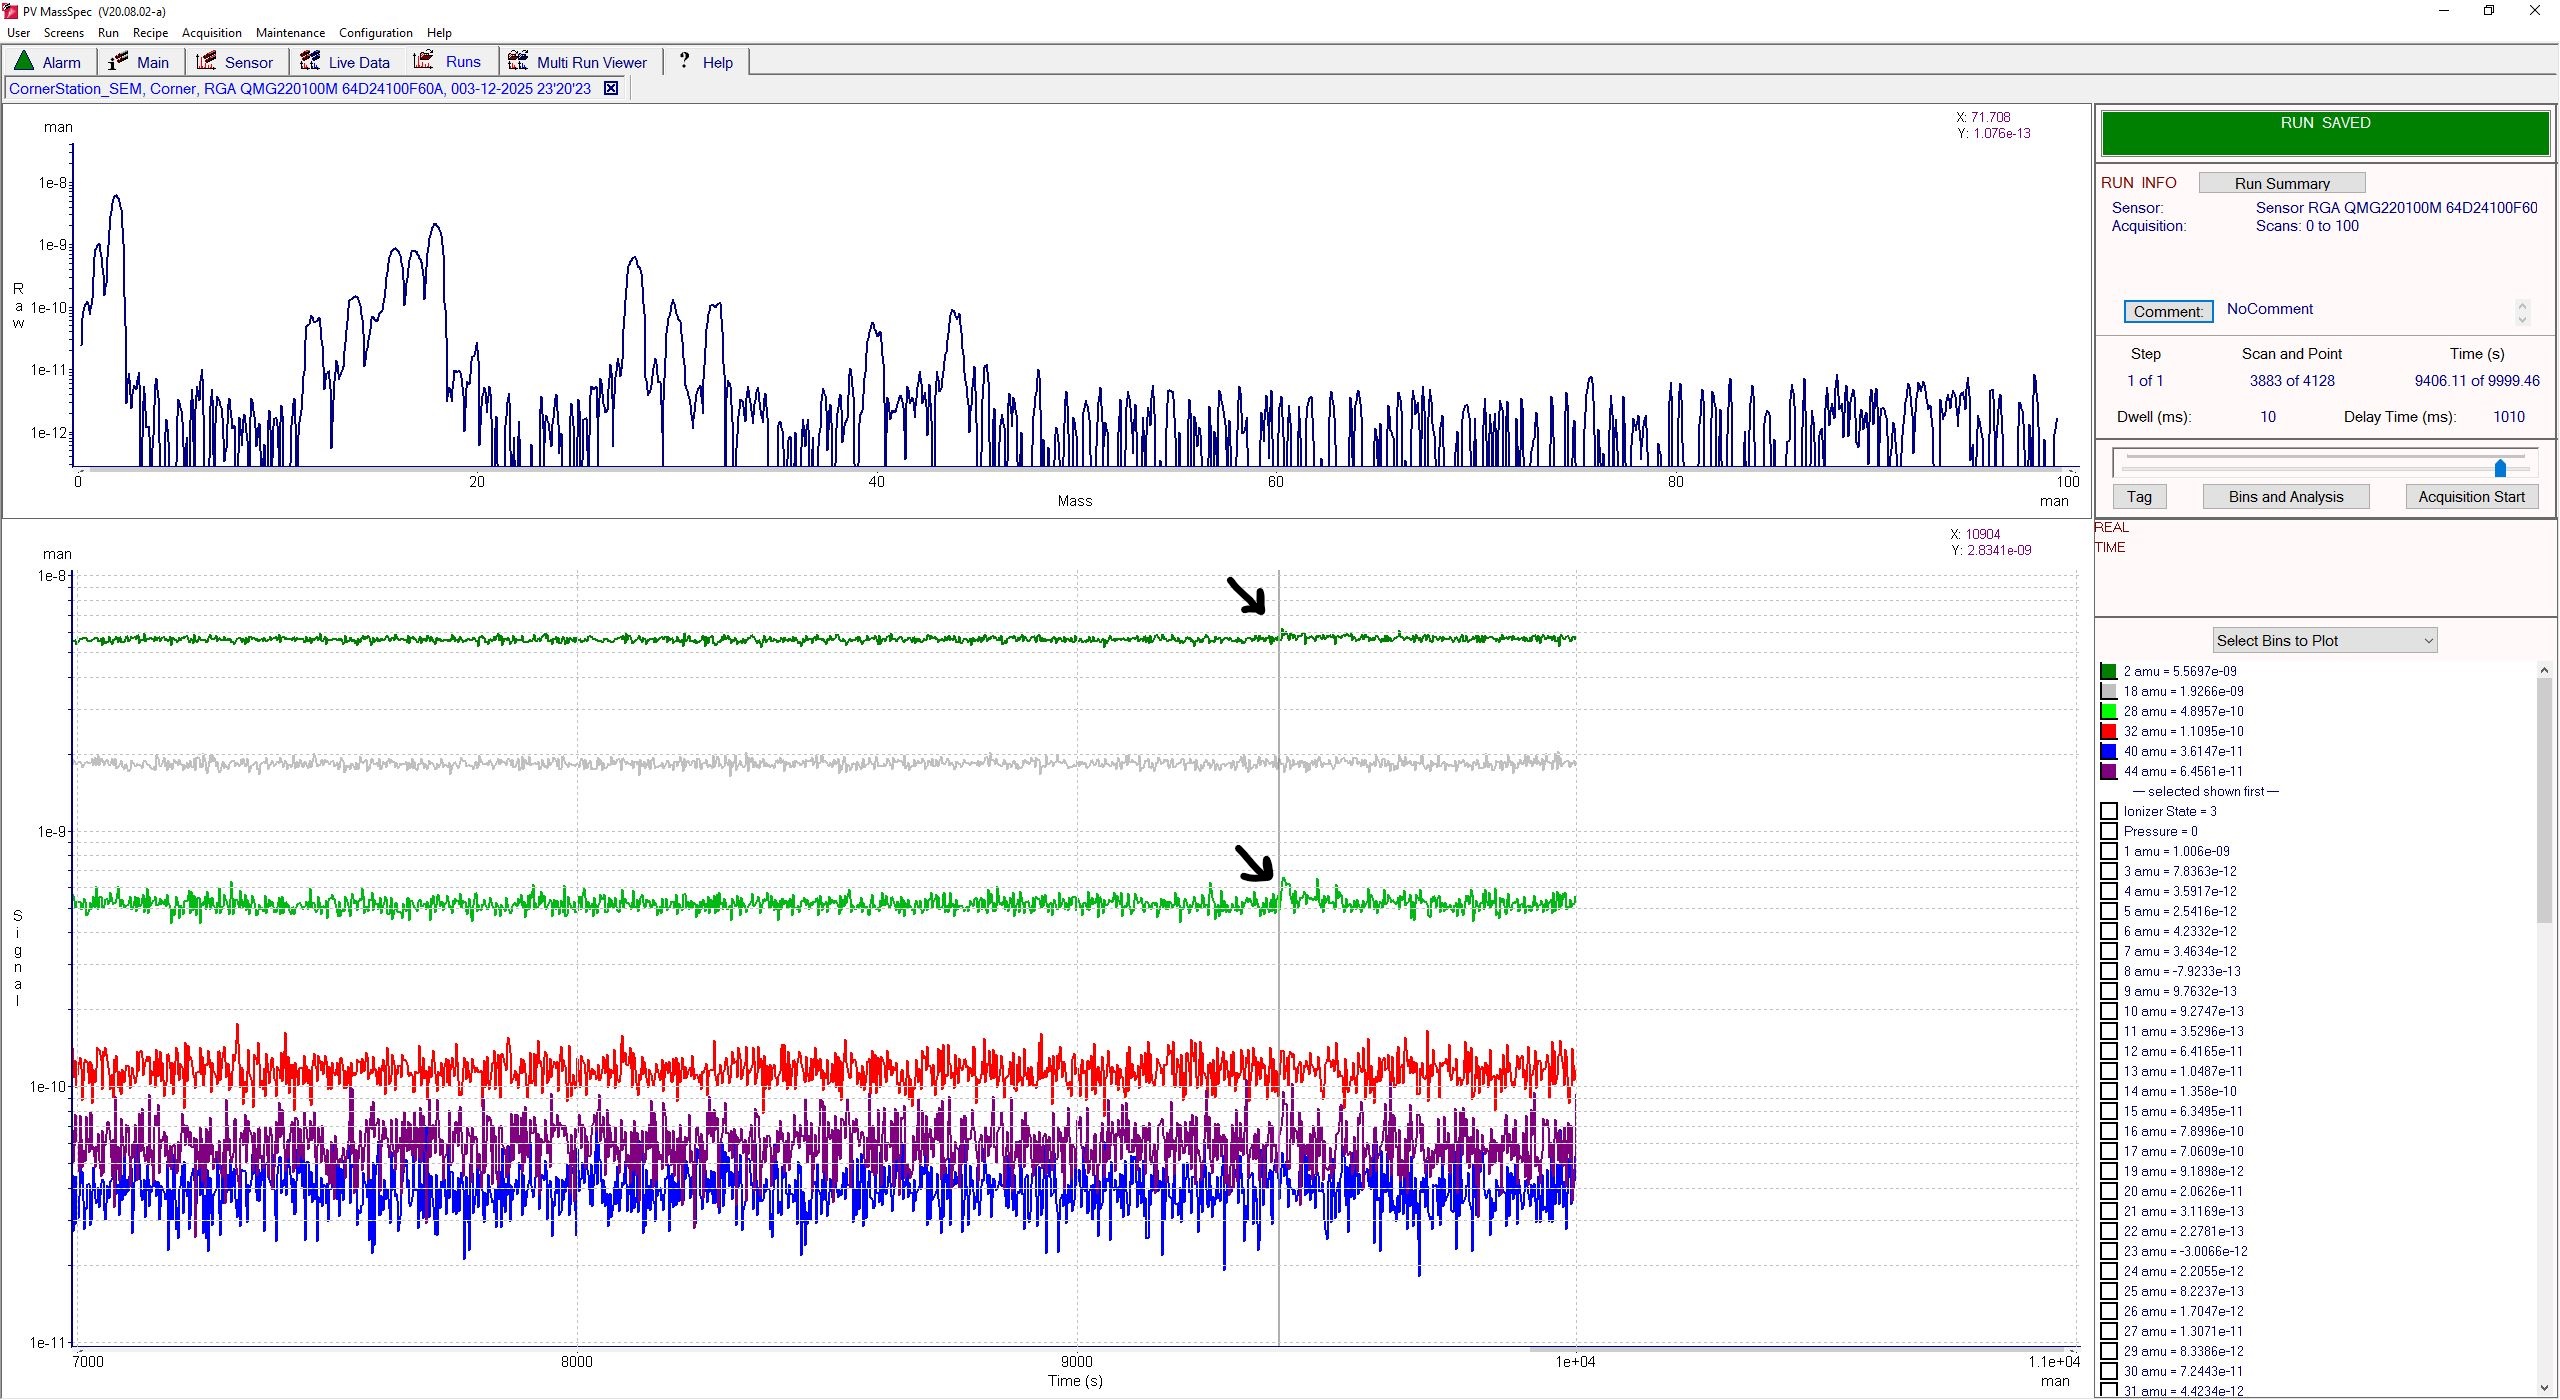
Corner RGA caught small change in H2 and N2 at the time of the vacuum glitch. AMU 2 delta = 5.4e-10 amp, AMU 28 delta = 1.61e-10 amp
Attached is a screenshot of RGA scan just before the vac glitch (1:57:02 AM 3/13/25), and second screenshot is ~10 seconds after. Top trace is the 0-100AMU scan at that time, bottom trace is the trend of typical gas components (AMU 2, 18, 28, 32, 40, 44), over ~50 minutes. Vertical line on bottom trace corresponds to time RGA was collected
RGA is a Pfeiffer Prisma Plus, 0-100AMU, with 10ms dwell time, EM enabled with 1200V multiplier voltage. Scans run continuous 0-100AMU sweeps
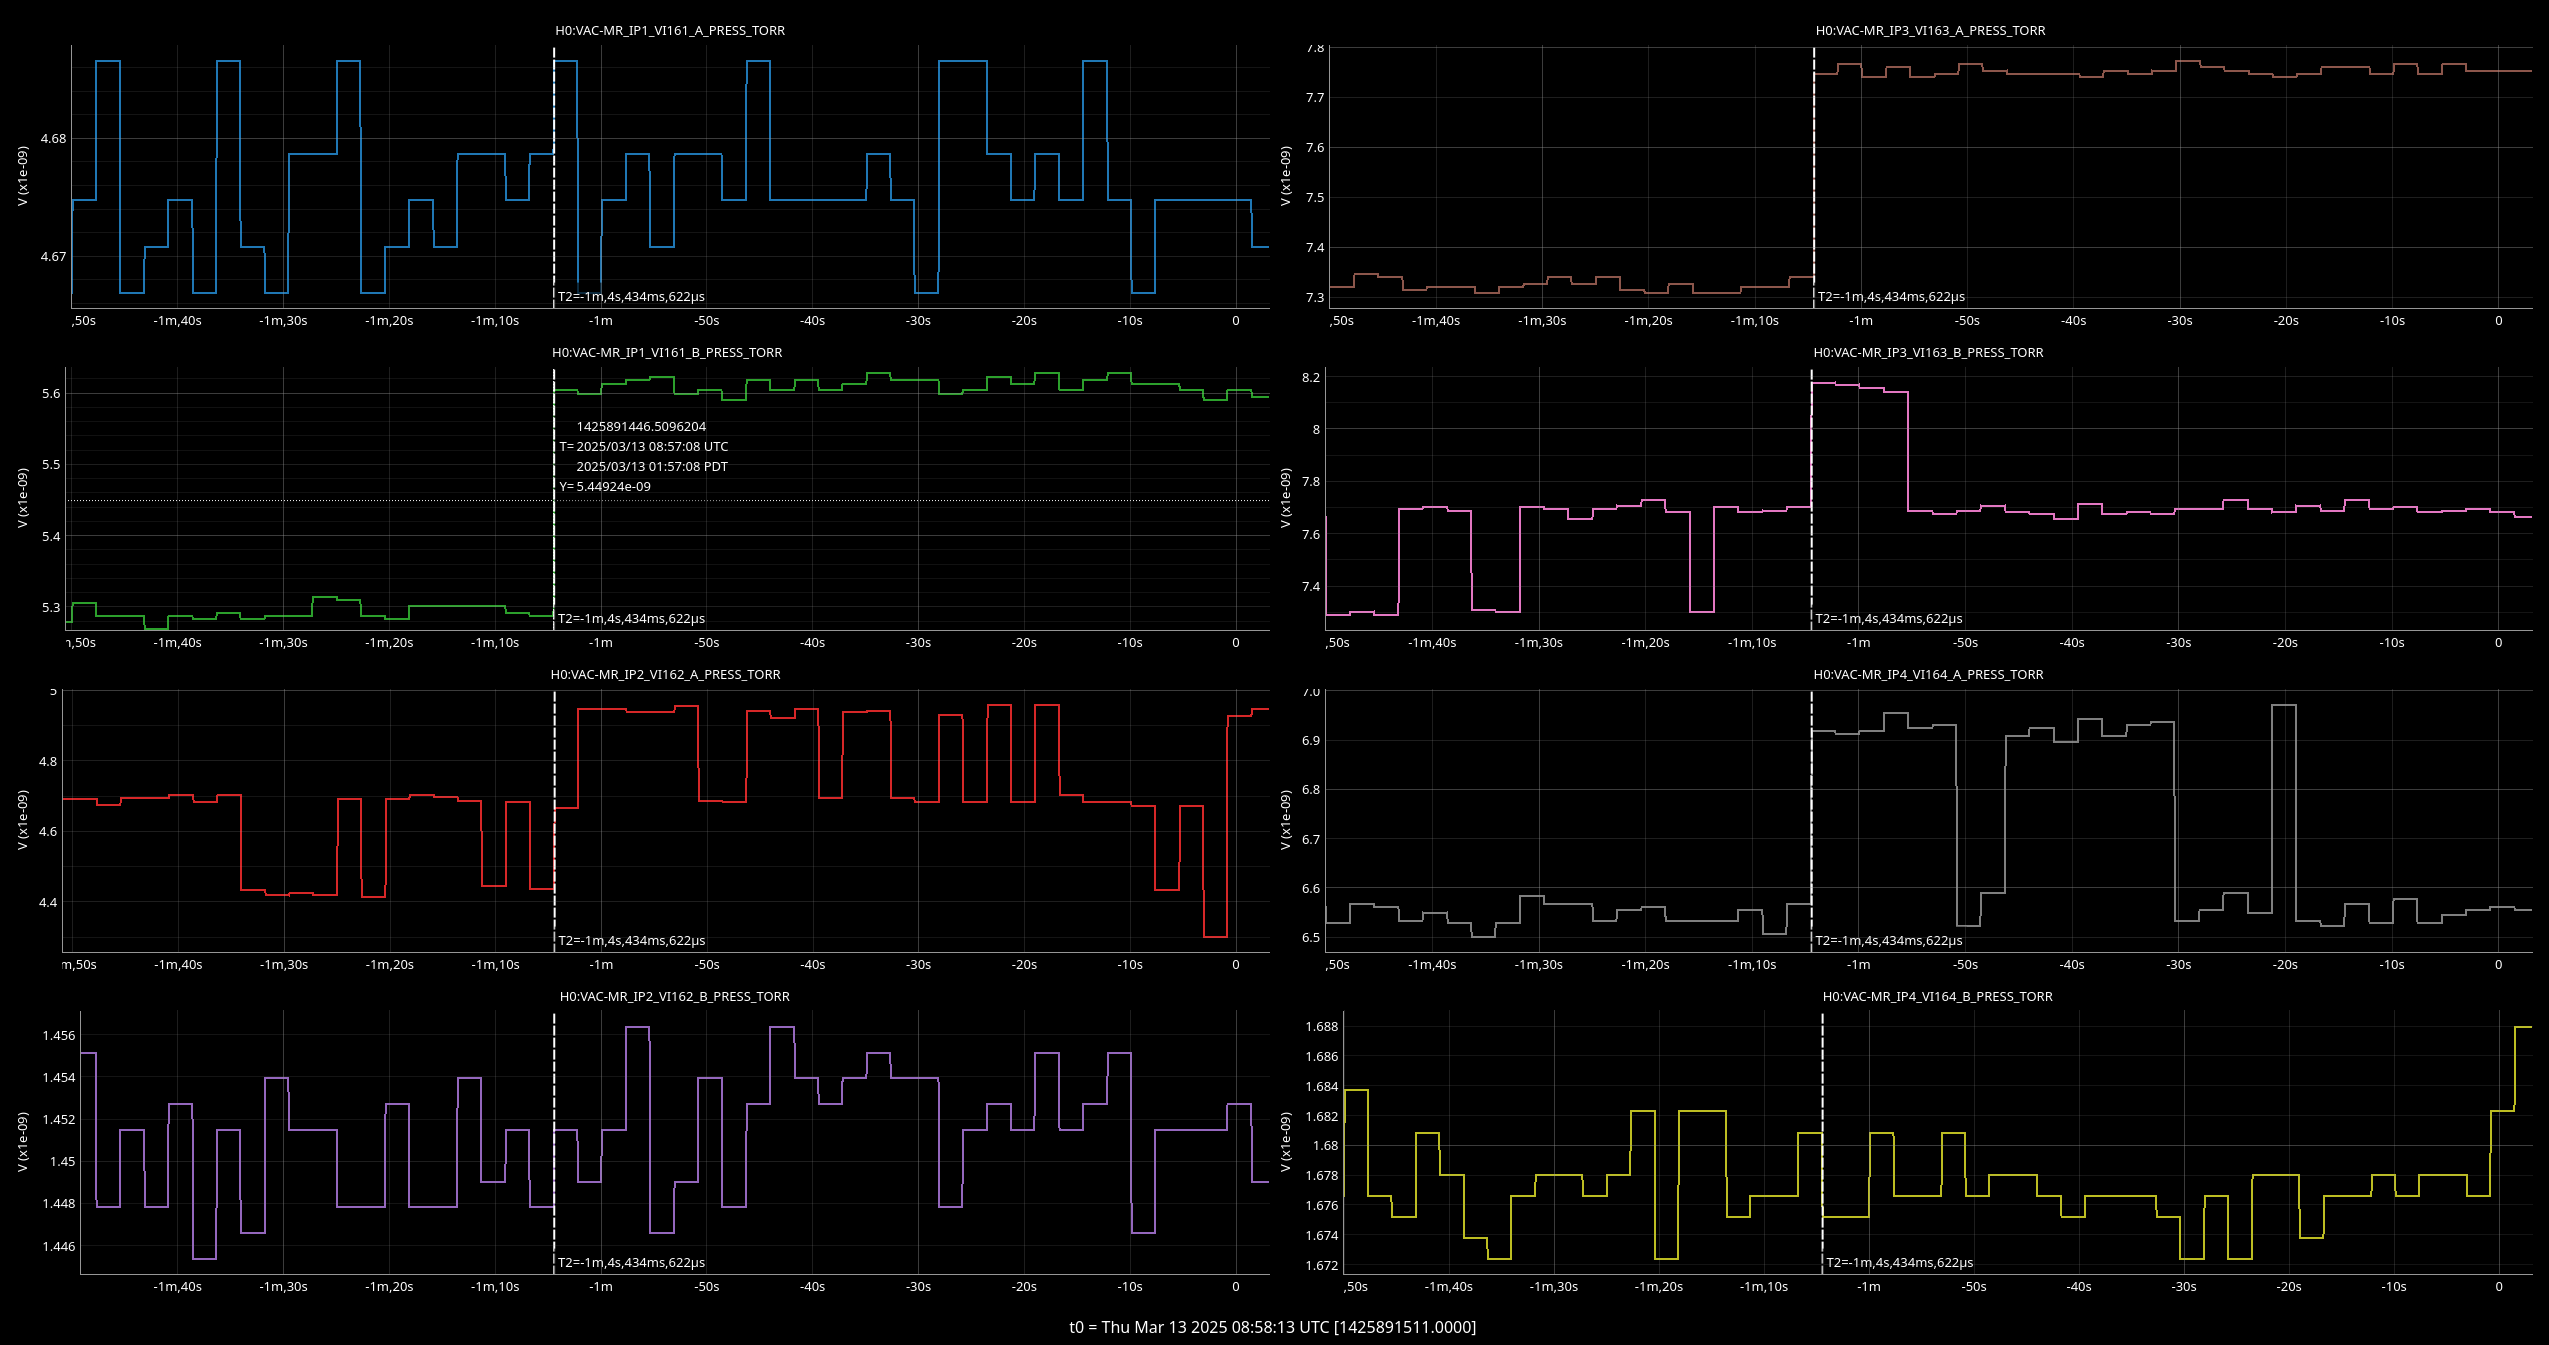
Main ion pumps reacted to the "pressure spike" after it was noted by other instruments such as the vacuum gauges, see attached plot, first one.
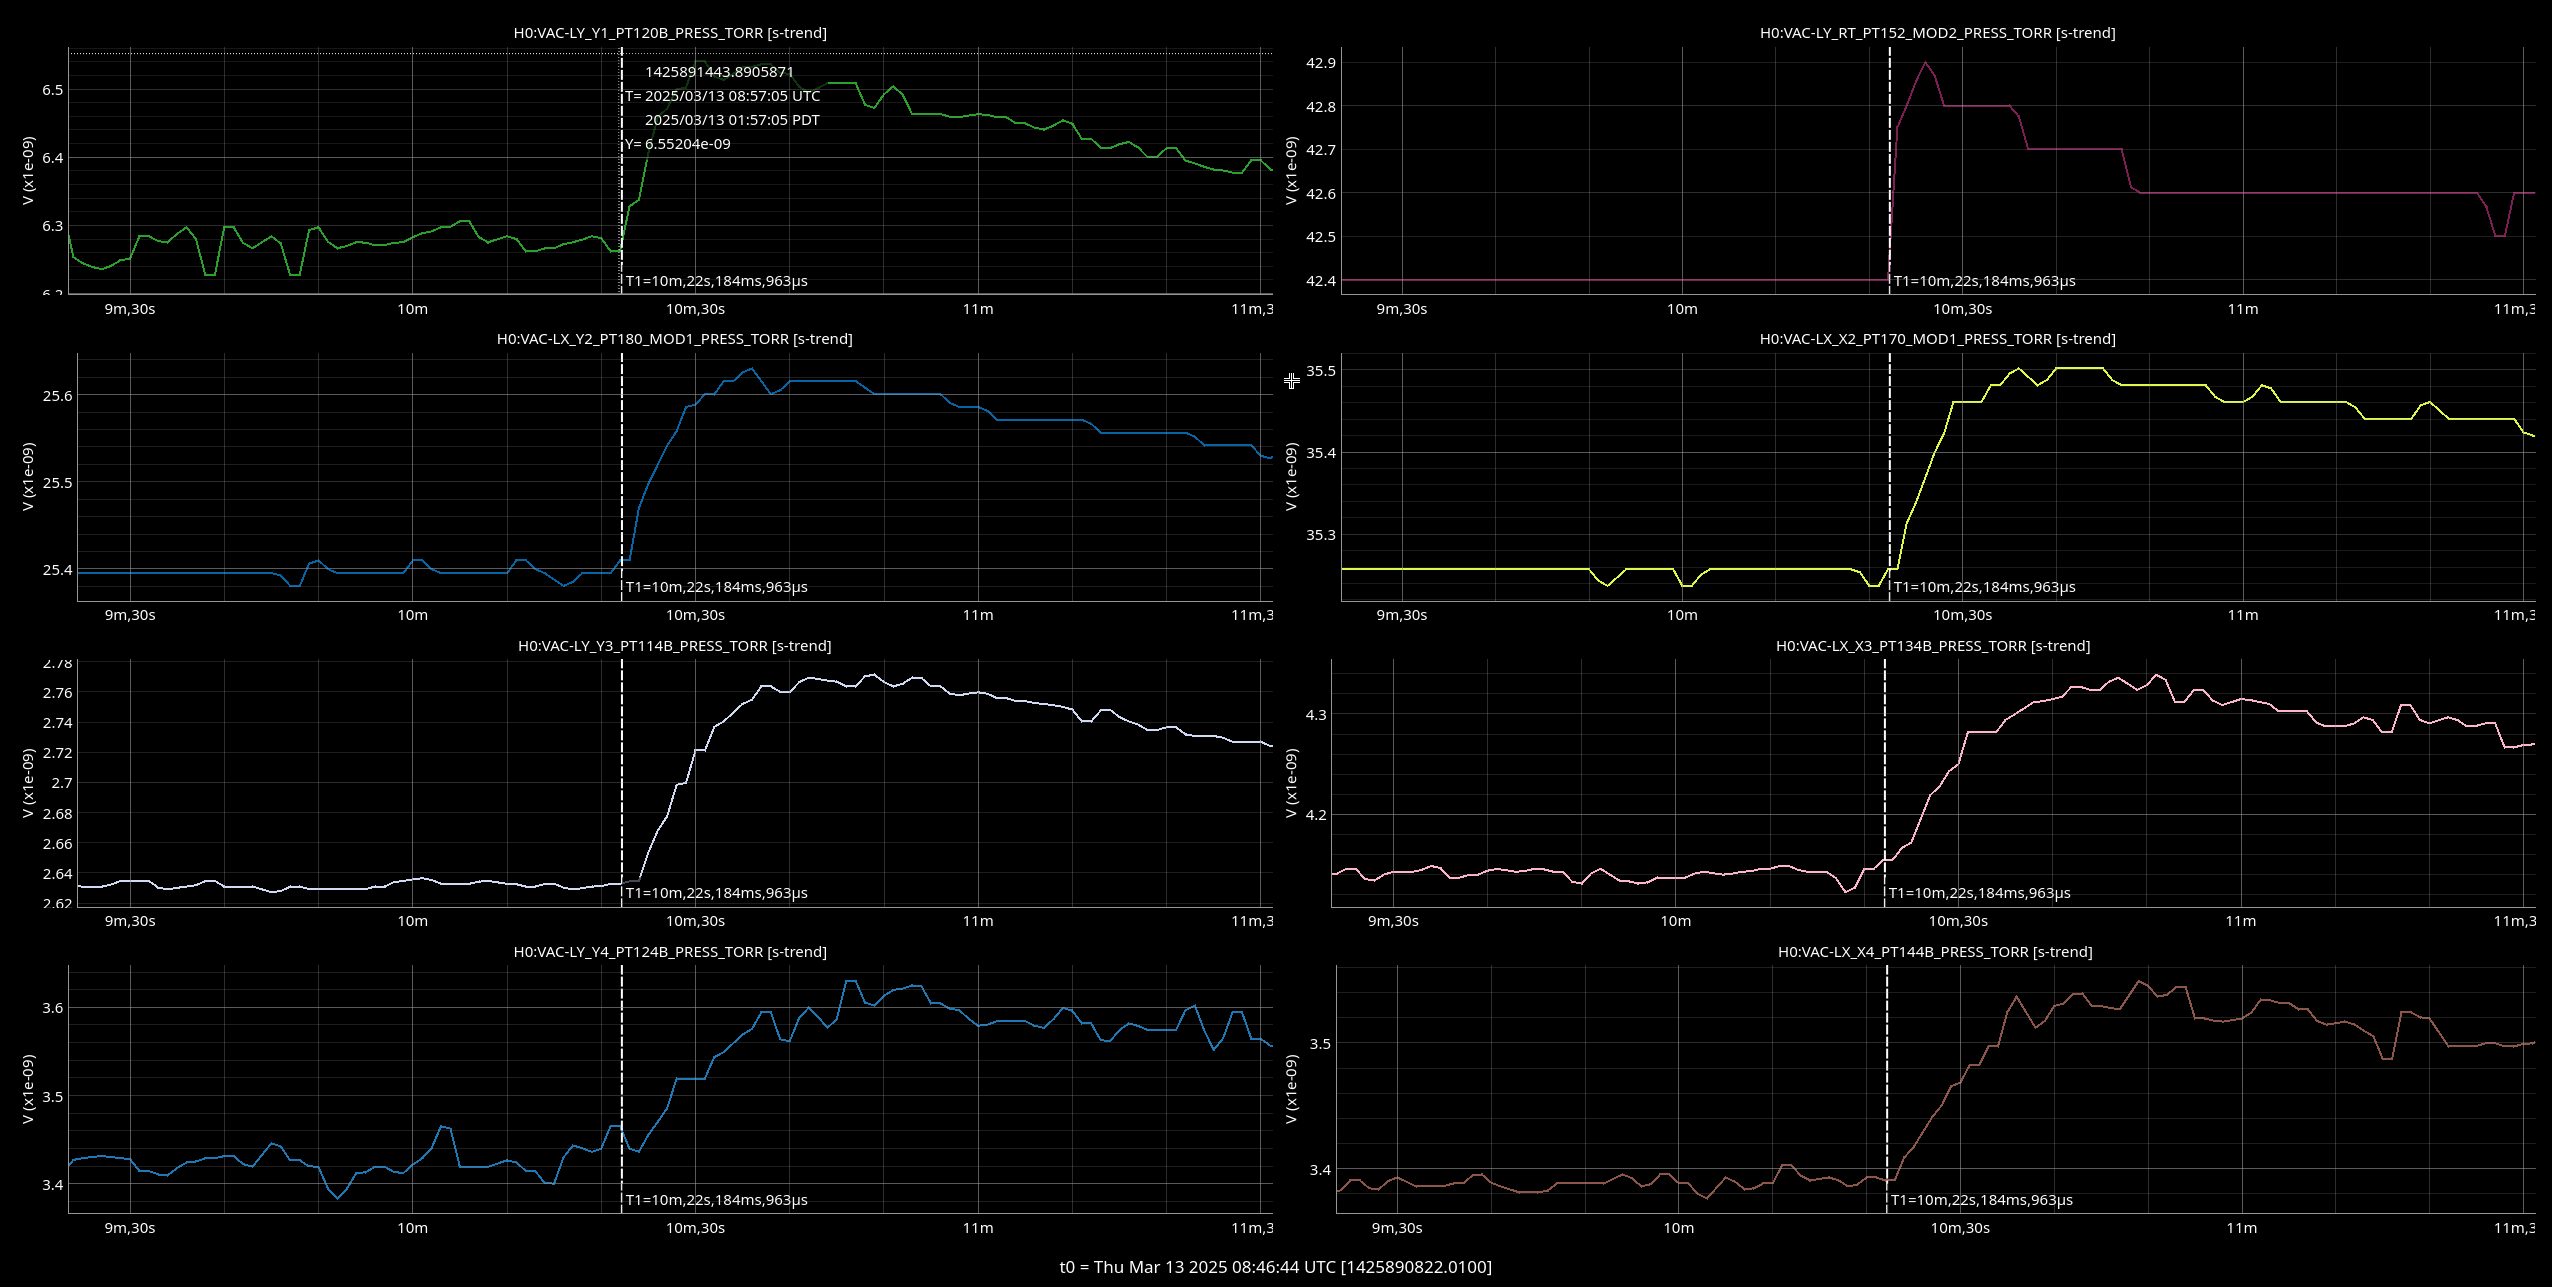
The second plot shows the different gauges located at the corner station, the "pressure spike" appears to be noted first by two gauges PT120 (gauge on dome of BSC2) and PT152 (gauge located at the relay tube). The amplitude of the "pressure spike" was very small, signature only was noted at the corner station, not noted at Mids or Ends.
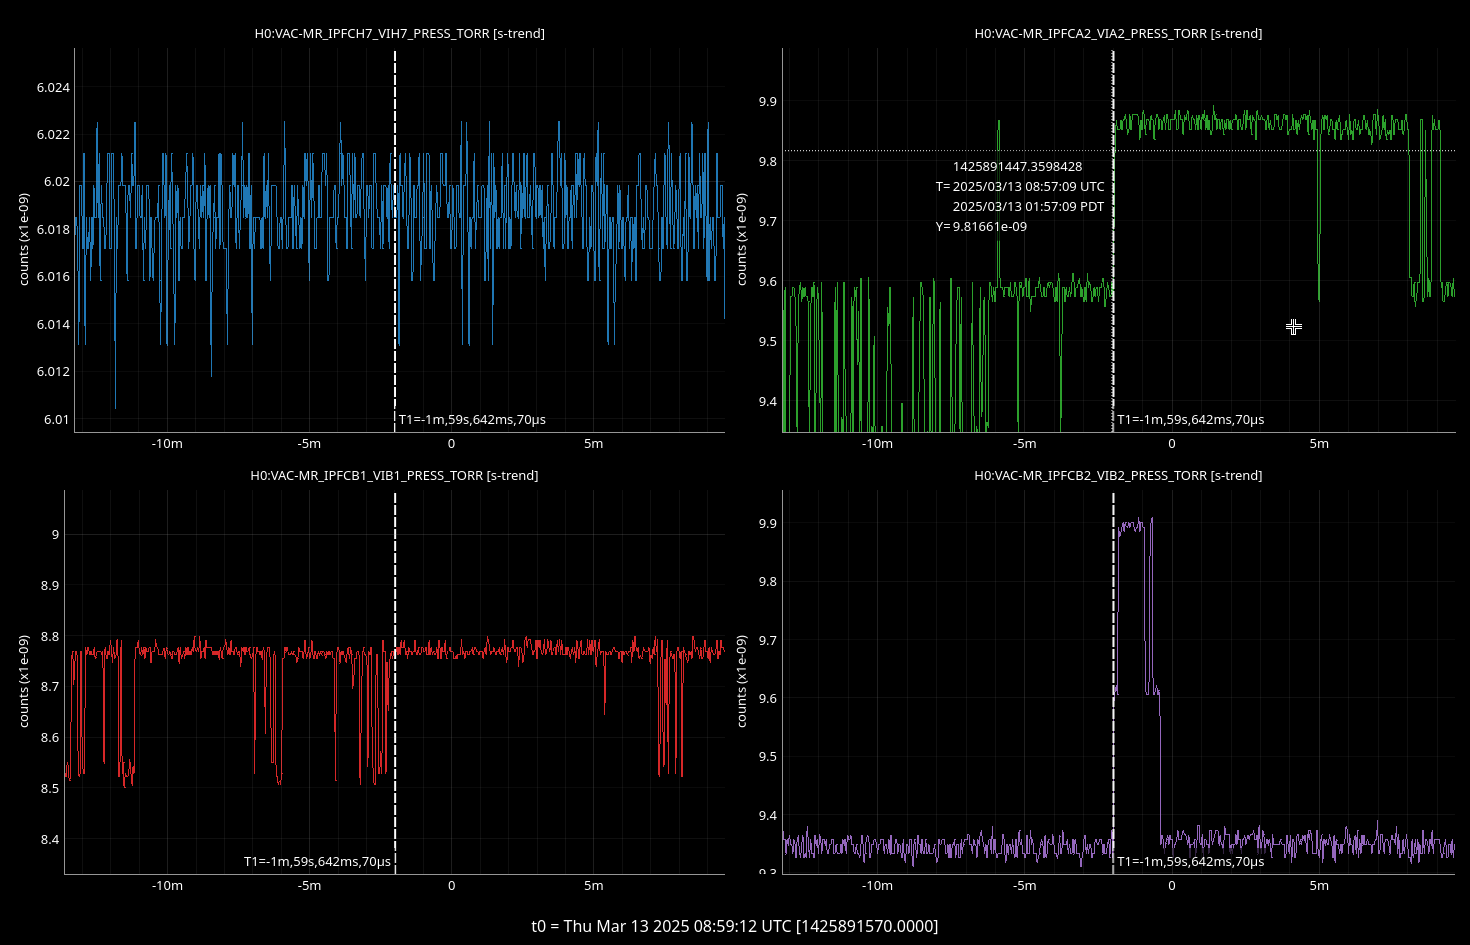
Two of the ion pumps at the filter cavity tube responded to the "pressure spkie", see third attachment.
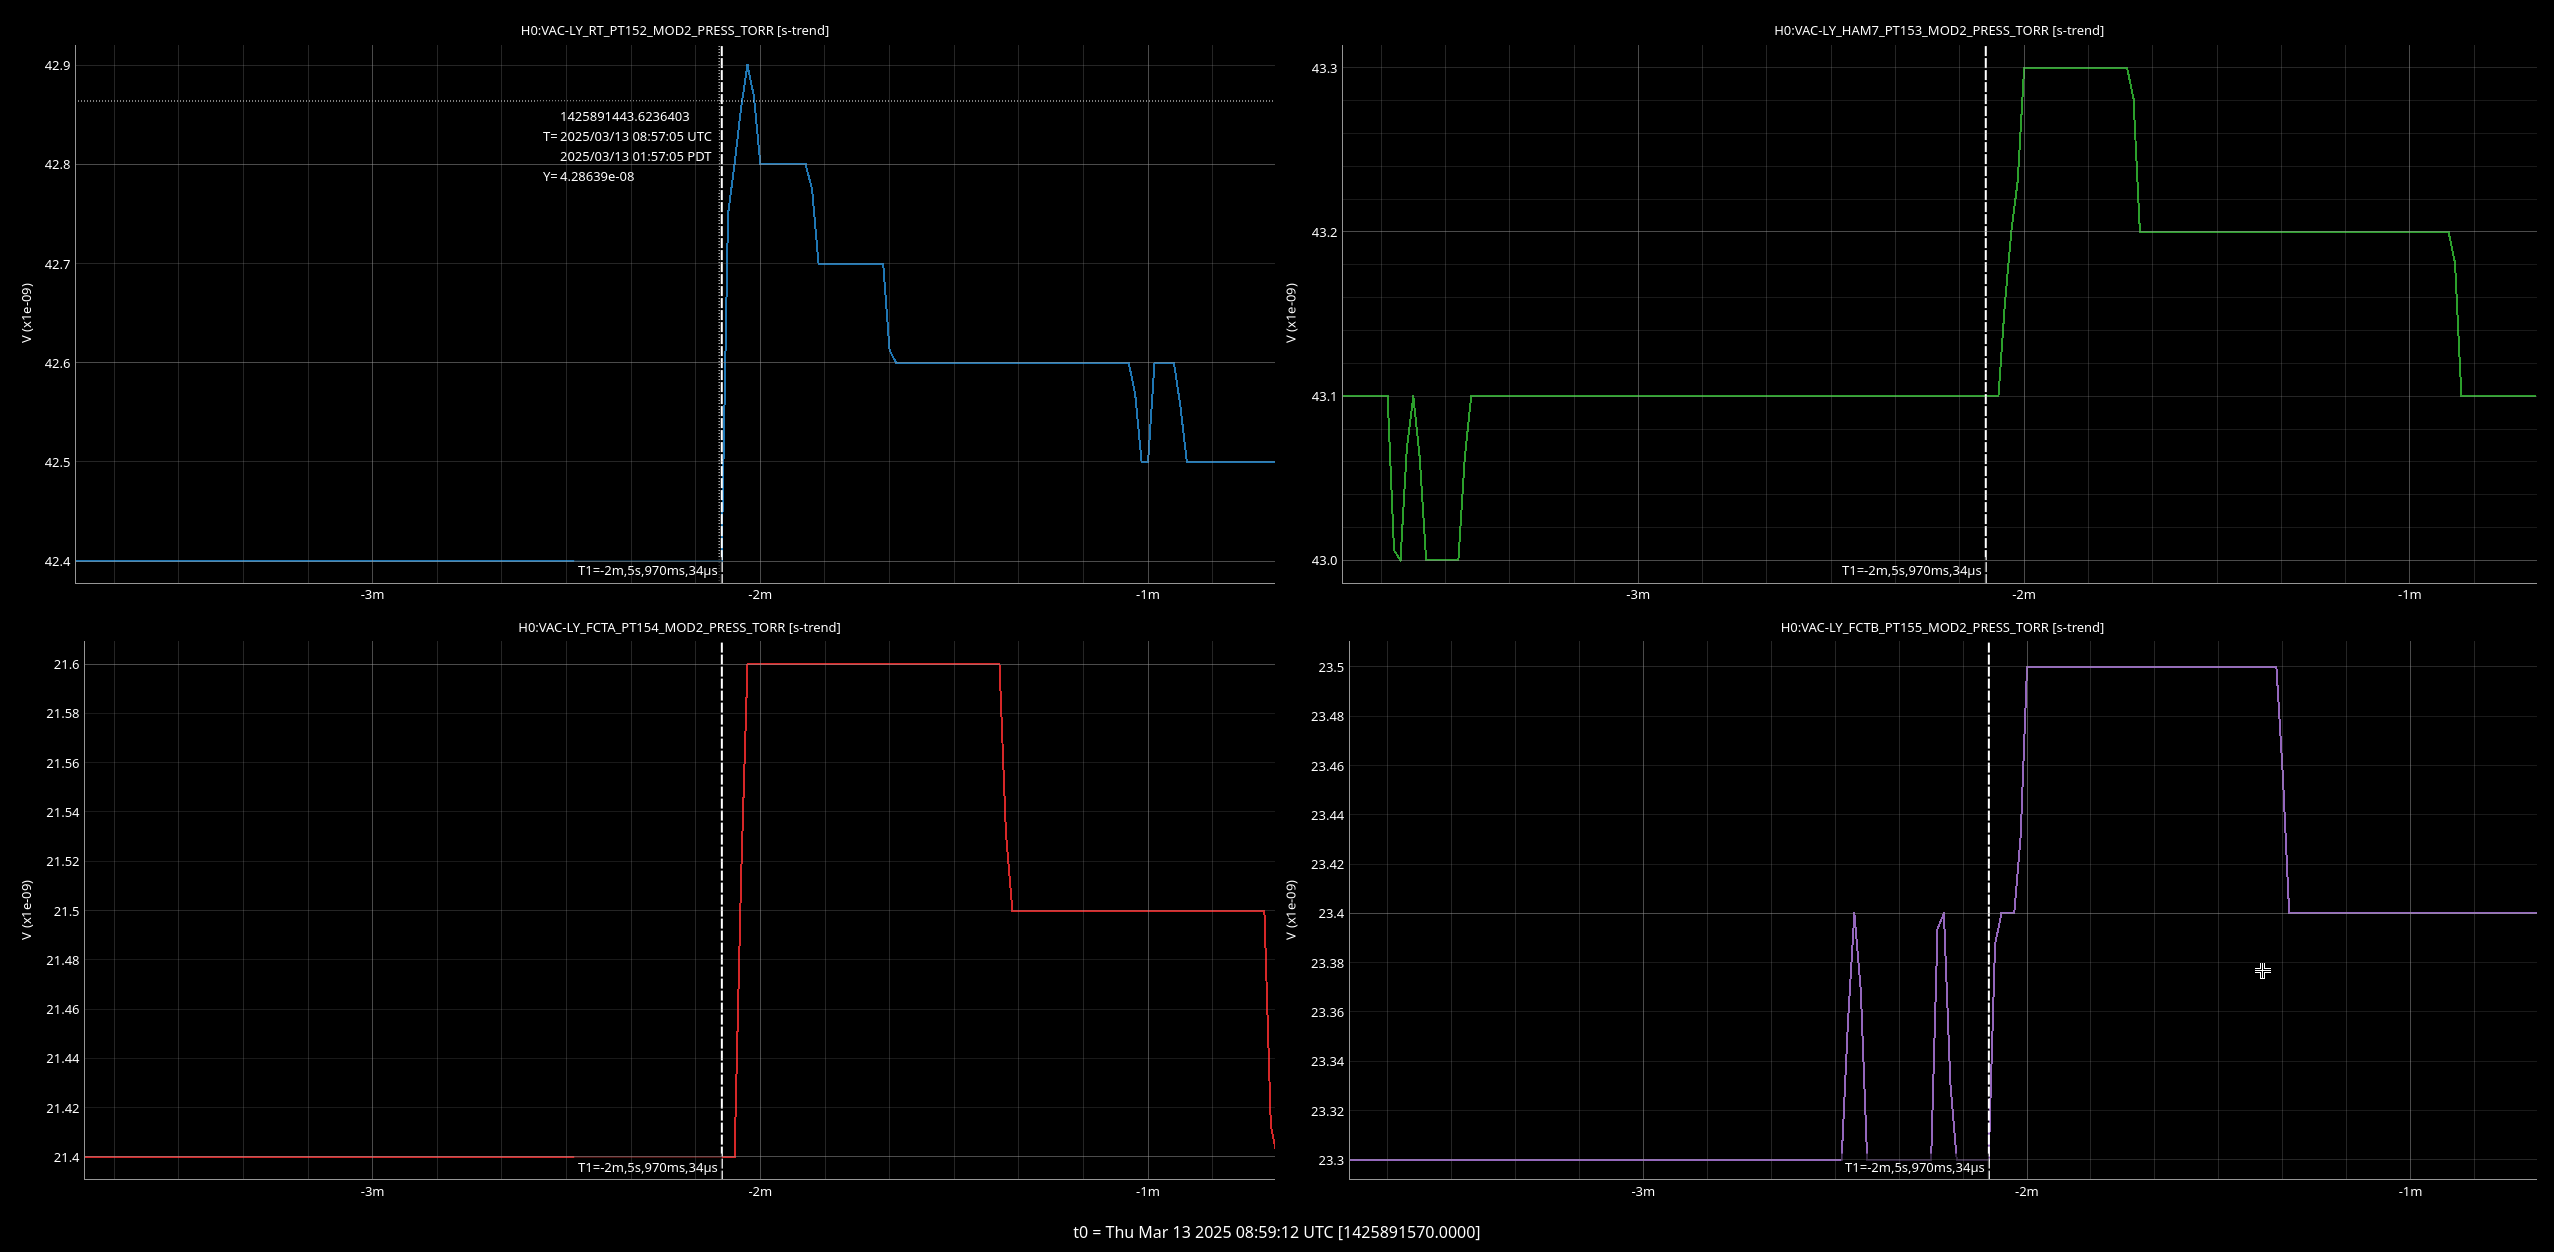
Also, the gauges located on the filter cavity tube noted the spike, including the "Relay Tube".