Today Francisco and I went down to the End station to make an End X measurement using PS4.
He took some time to do a Beam Spot move, and then we got started on the ES measurement following the instructions in the T1500062 Procedures and Log .
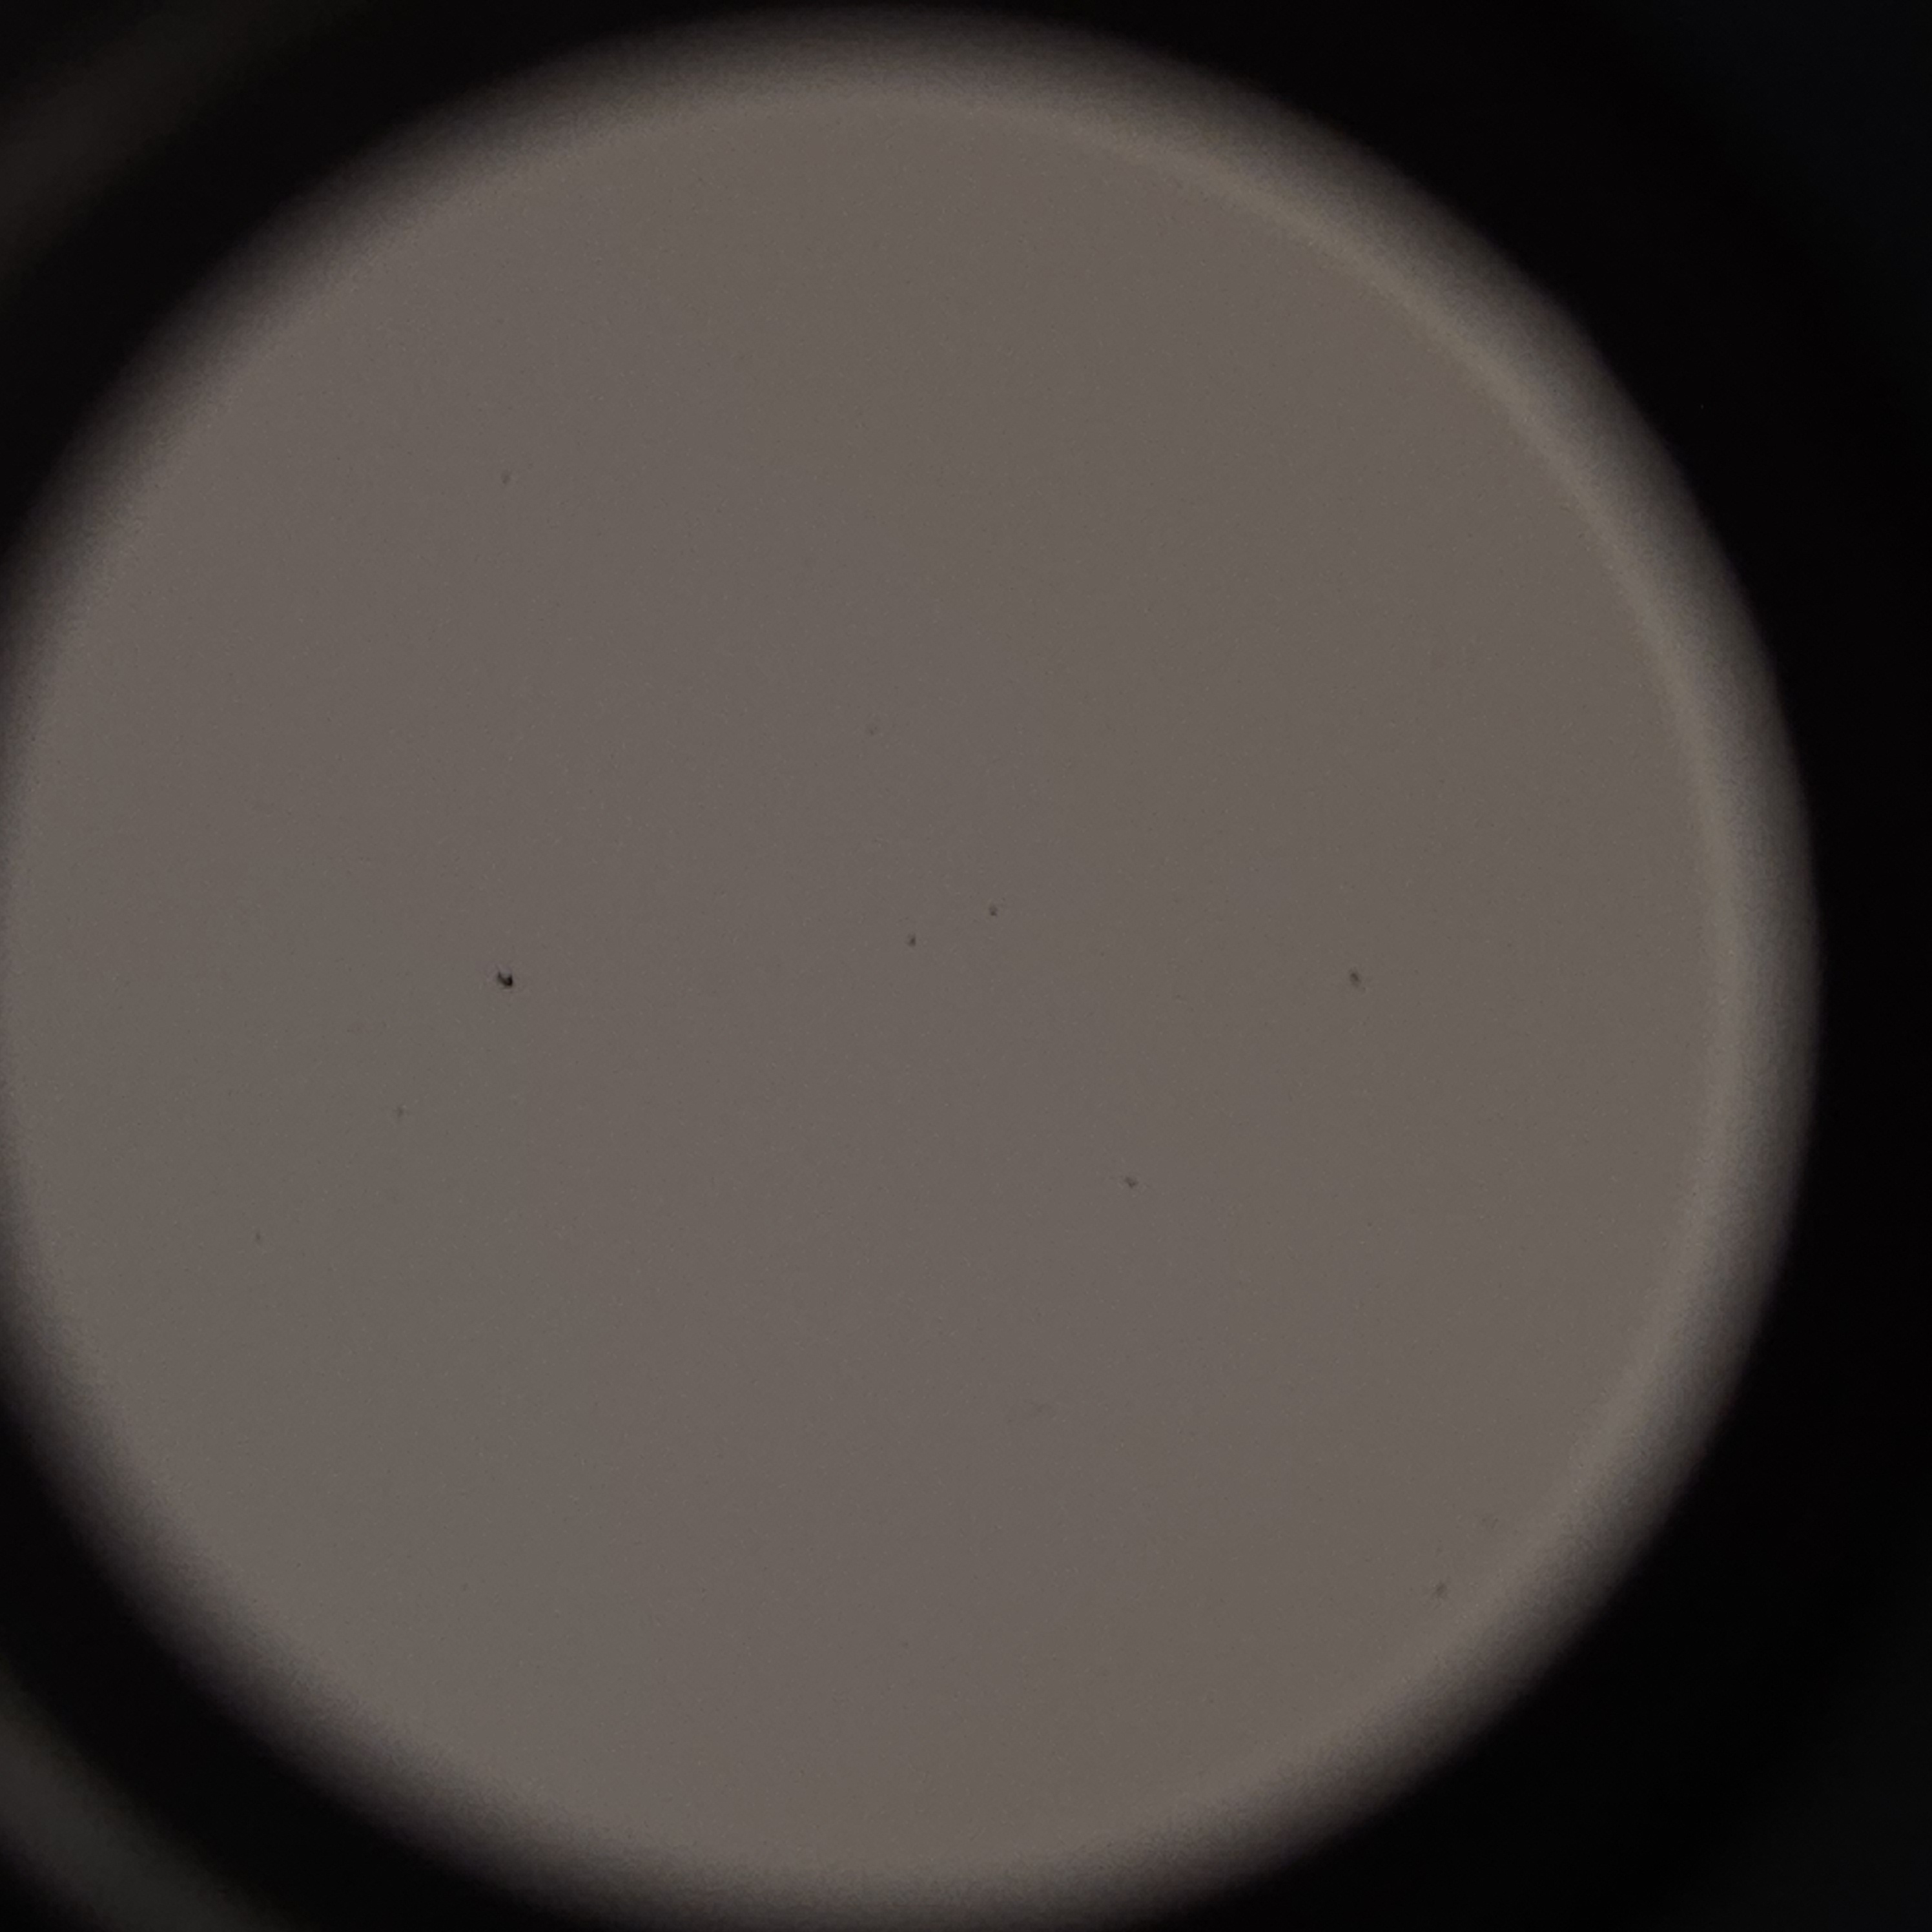
I did happen to look inside the RX sphere when swapping spheres and saw a small black dot on the spectralon on the inside of the shpere. It actually looks like it may be some tiny pitting in the spectralon shell.
(pcal_env) tony@LHOGC000360:~/Documents/PCAL/git/pcal/O4/ES/scripts/pcalEndstationPy$ python generate_measurement_data.py --WS "PS4" --date "2025-03-24"
Reading in config file from python file in scripts
../../../Common/O4PSparams.yaml
PS4 rho, kappa, u_rel on 2025-03-24 corrected to ES temperature 299.4 K :
-4.701550919294612 -0.0002694340454223 4.0632996079052654e-05
Copying the scripts into tD directory...
Connected to nds.ligo-wa.caltech.edu
martel run
reading data at start_time: 1426956240
reading data at start_time: 1426956650
reading data at start_time: 1426956970
reading data at start_time: 1426957350
reading data at start_time: 1426957720
reading data at start_time: 1426958030
reading data at start_time: 1426958180
reading data at start_time: 1426958960
reading data at start_time: 1426959280
Ratios: -0.46129682487781465 -0.4660359949229844
writing nds2 data to files
finishing writing
Background Values:
bg1 = 8.837346; Background of TX when WS is at TX
bg2 = 5.591501; Background of WS when WS is at TX
bg3 = 8.780952; Background of TX when WS is at RX
bg4 = 5.680601; Background of WS when WS is at RX
bg5 = 8.772249; Background of TX
bg6 = 0.562586; Background of RX
The uncertainty reported below are Relative Standard Deviation in percent
Intermediate Ratios
RatioWS_TX_it = -0.461297;
RatioWS_TX_ot = -0.466036;
RatioWS_TX_ir = -0.455766;
RatioWS_TX_or = -0.460962;
RatioWS_TX_it_unc = 0.088015;
RatioWS_TX_ot_unc = 0.088093;
RatioWS_TX_ir_unc = 0.093864;
RatioWS_TX_or_unc = 0.092606;
Optical Efficiency
OE_Inner_beam = 0.988107;
OE_Outer_beam = 0.989162;
Weighted_Optical_Efficiency = 0.988635;
OE_Inner_beam_unc = 0.059352;
OE_Outer_beam_unc = 0.059902;
Weighted_Optical_Efficiency_unc = 0.084326;
Martel Voltage fit:
Gradient = 1636.730463;
Intercept = 0.022399;
Power Imbalance = 0.989831;
Endstation Power sensors to WS ratios::
Ratio_WS_TX = -1.078361;
Ratio_WS_RX = -1.391797;
Ratio_WS_TX_unc = 0.053544;
Ratio_WS_RX_unc = 0.043735;
=============================================================
============= Values for Force Coefficients =================
=============================================================
Key Pcal Values :
GS = -5.135100; Gold Standard Value in (V/W)
WS = -4.701551; Working Standard Value
costheta = 0.988362; Angle of incidence
c = 299792458.000000; Speed of Light
End Station Values :
TXWS = -1.078361; Tx to WS Rel responsivity (V/V)
sigma_TXWS = 0.000577; Uncertainity of Tx to WS Rel responsivity (V/V)
RXWS = -1.391797; Rx to WS Rel responsivity (V/V)
sigma_RXWS = 0.000609; Uncertainity of Rx to WS Rel responsivity (V/V)
e = 0.988635; Optical Efficiency
sigma_e = 0.000834; Uncertainity in Optical Efficiency
Martel Voltage fit :
Martel_gradient = 1636.730463; Martel to output channel (C/V)
Martel_intercept = 0.022399; Intercept of fit of Martel to output (C/V)
Power Loss Apportion :
beta = 0.998895; Ratio between input and output (Beta)
E_T = 0.993751; TX Optical efficiency
sigma_E_T = 0.000419; Uncertainity in TX Optical efficiency
E_R = 0.994851; RX Optical Efficiency
sigma_E_R = 0.000419; Uncertainity in RX Optical efficiencyForce Coefficients :
FC_TxPD = 7.896238e-13; TxPD Force Coefficient
FC_RxPD = 6.188319e-13; RxPD Force Coefficient
sigma_FC_TxPD = 5.403288e-16; TxPD Force Coefficient
sigma_FC_RxPD = 3.778561e-16; RxPD Force Coefficient
data written to ../../measurements/LHO_EndX/tD20250325/
Martel Voltage Tests
WS_at_RX.png
WS_at_RX_BOTH_BEAMS.png
WS_at_TX.png
LHO_EndX_PD_ReportV5.pdf
This adventure has been brought to you by Matt Todd, Francisco L. & Tony Sanchez.

