FranciscoL, SheilaD, JeffK
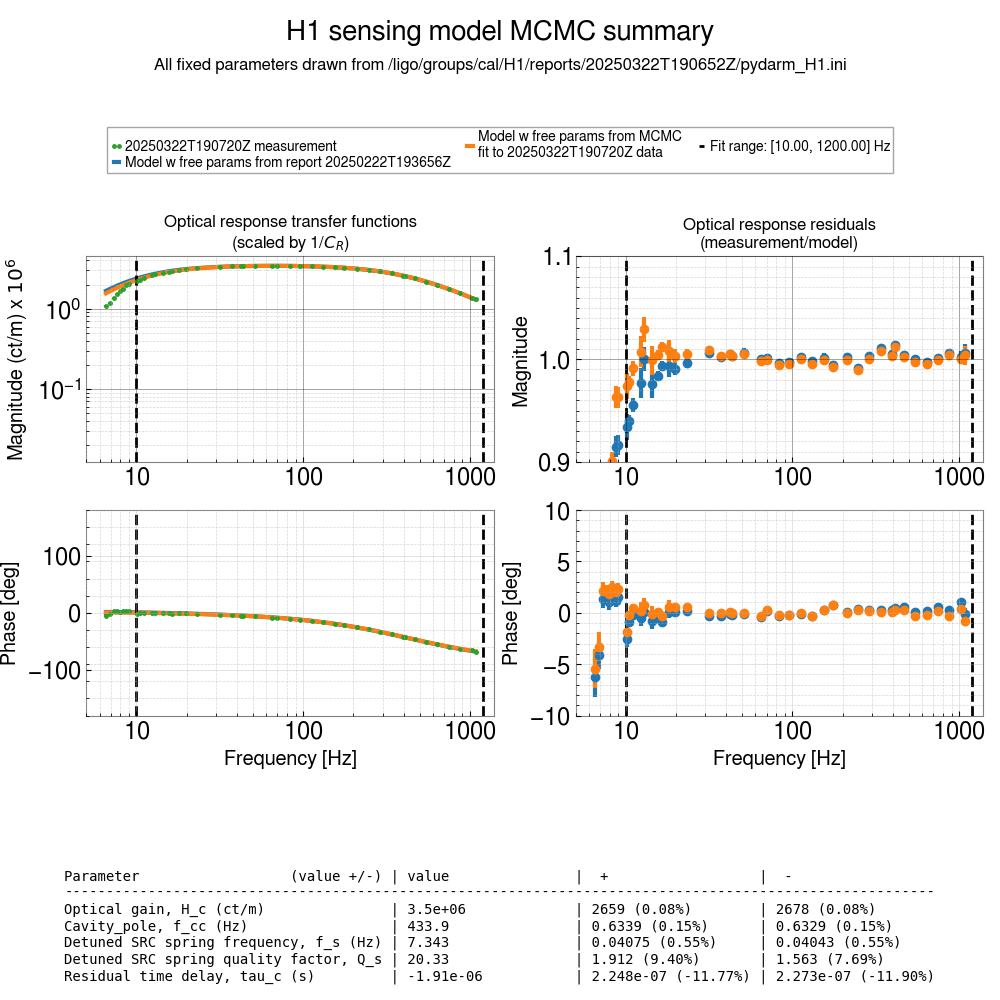
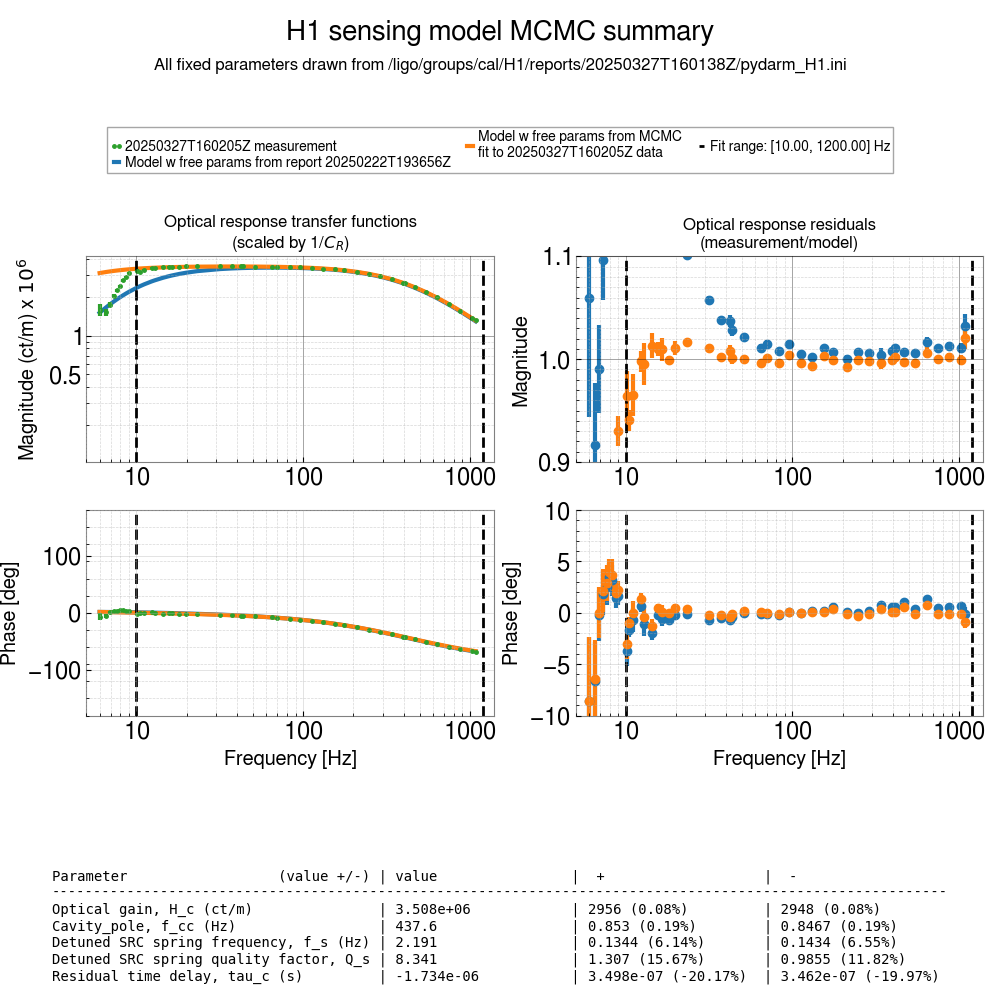
I compared the sensing functions from calibration reports 20250327T160138Z, and 20250322T190652Z to look for correlations with the SRCL offset change done before the routinely Thursday calibration measurement. We see a decrease of the detuned SRC spring frequency from 7.343 Hz to 2.191 Hz.
I am attaching each sensing model generated by pydarm. Second attachment (20250322T190652Z_sensing_mcmc_compare) is for the measurement done last Saturday, third attachment (20250327T160138Z_sensing_mcmc_compare) for the measurement done today. We trust the model because the fit (orange trace) and the data (green dots) match well above the 10 Hz fit range. Additionally, the data on both measurements below 10 Hz shows a similar behavior. This gives us (1) confidence that the change in the sensing function was indeed from SRCL detuning and (2) we may have other sources of coupling into the sensing function -- thinking about DHARD as the main culprit.
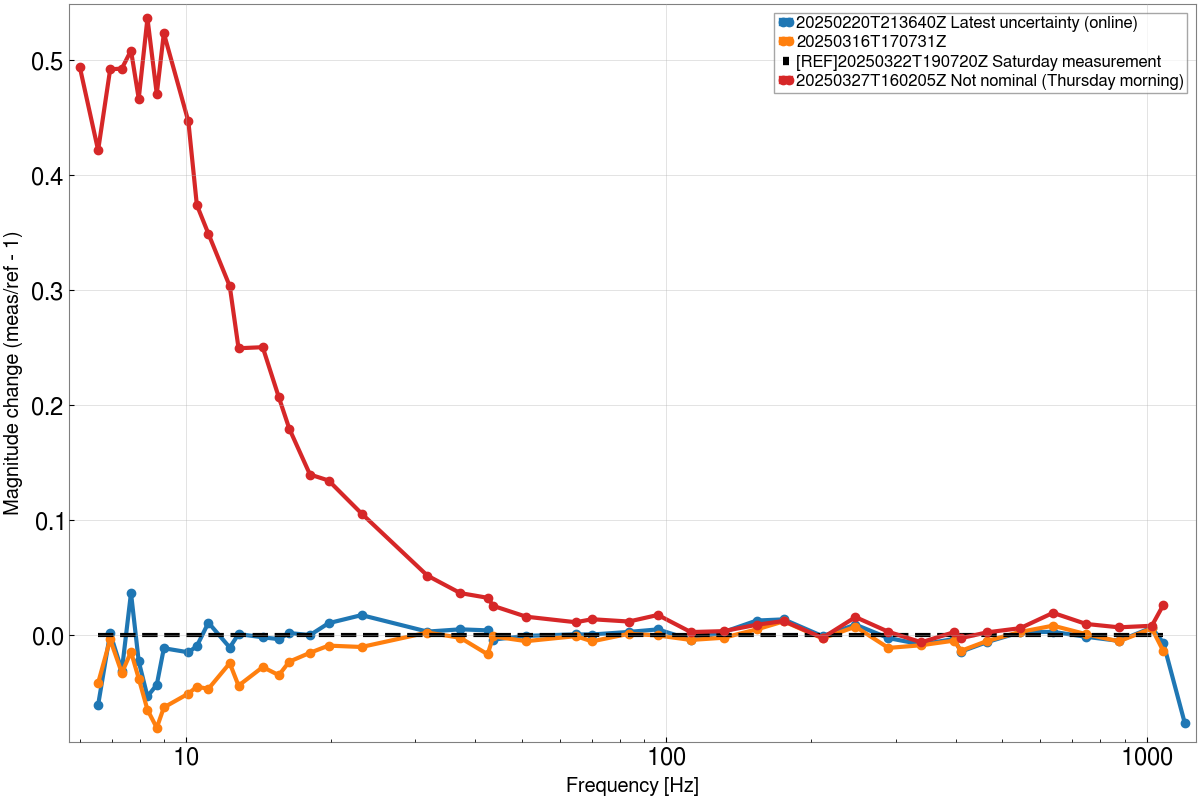
The first attachment (sensing_ratio) shows the relative change of each measurement labeled by their report id. We see that the latest calibration measurements (orange and black), have been consistent with the latest front-end calibration (blue) -- more confidence towards SRCL changing the sensing function.
While this improves the detuning of the interferometer, the overhead to update the calibration has deemed to high for the few days left that will be running. We will reassess when we are close to coming back into observing mode (June)
What I did to make plots:
(1) Get the report from the calibration measurement this morning:
In the terminal -- no need to activate any environments or configuring the terminal in any way -- running
will create a report of the latest measurement that was done. This command will not change FE calibration so, for now, this is a safe way to get data and manipulate/evaluate it.
(2) Used script to retrieve sensing function measurements from calibration reports:
The script located at
will load the measurements as provided by their report id. I personally chose a dictionary to add comments for labeling purposes. The function 'sensing' will load the measurement and get the response. The rest is plotting aesthetics.
NOTE To enable the pydarm package -- and run the script -- run in terminal
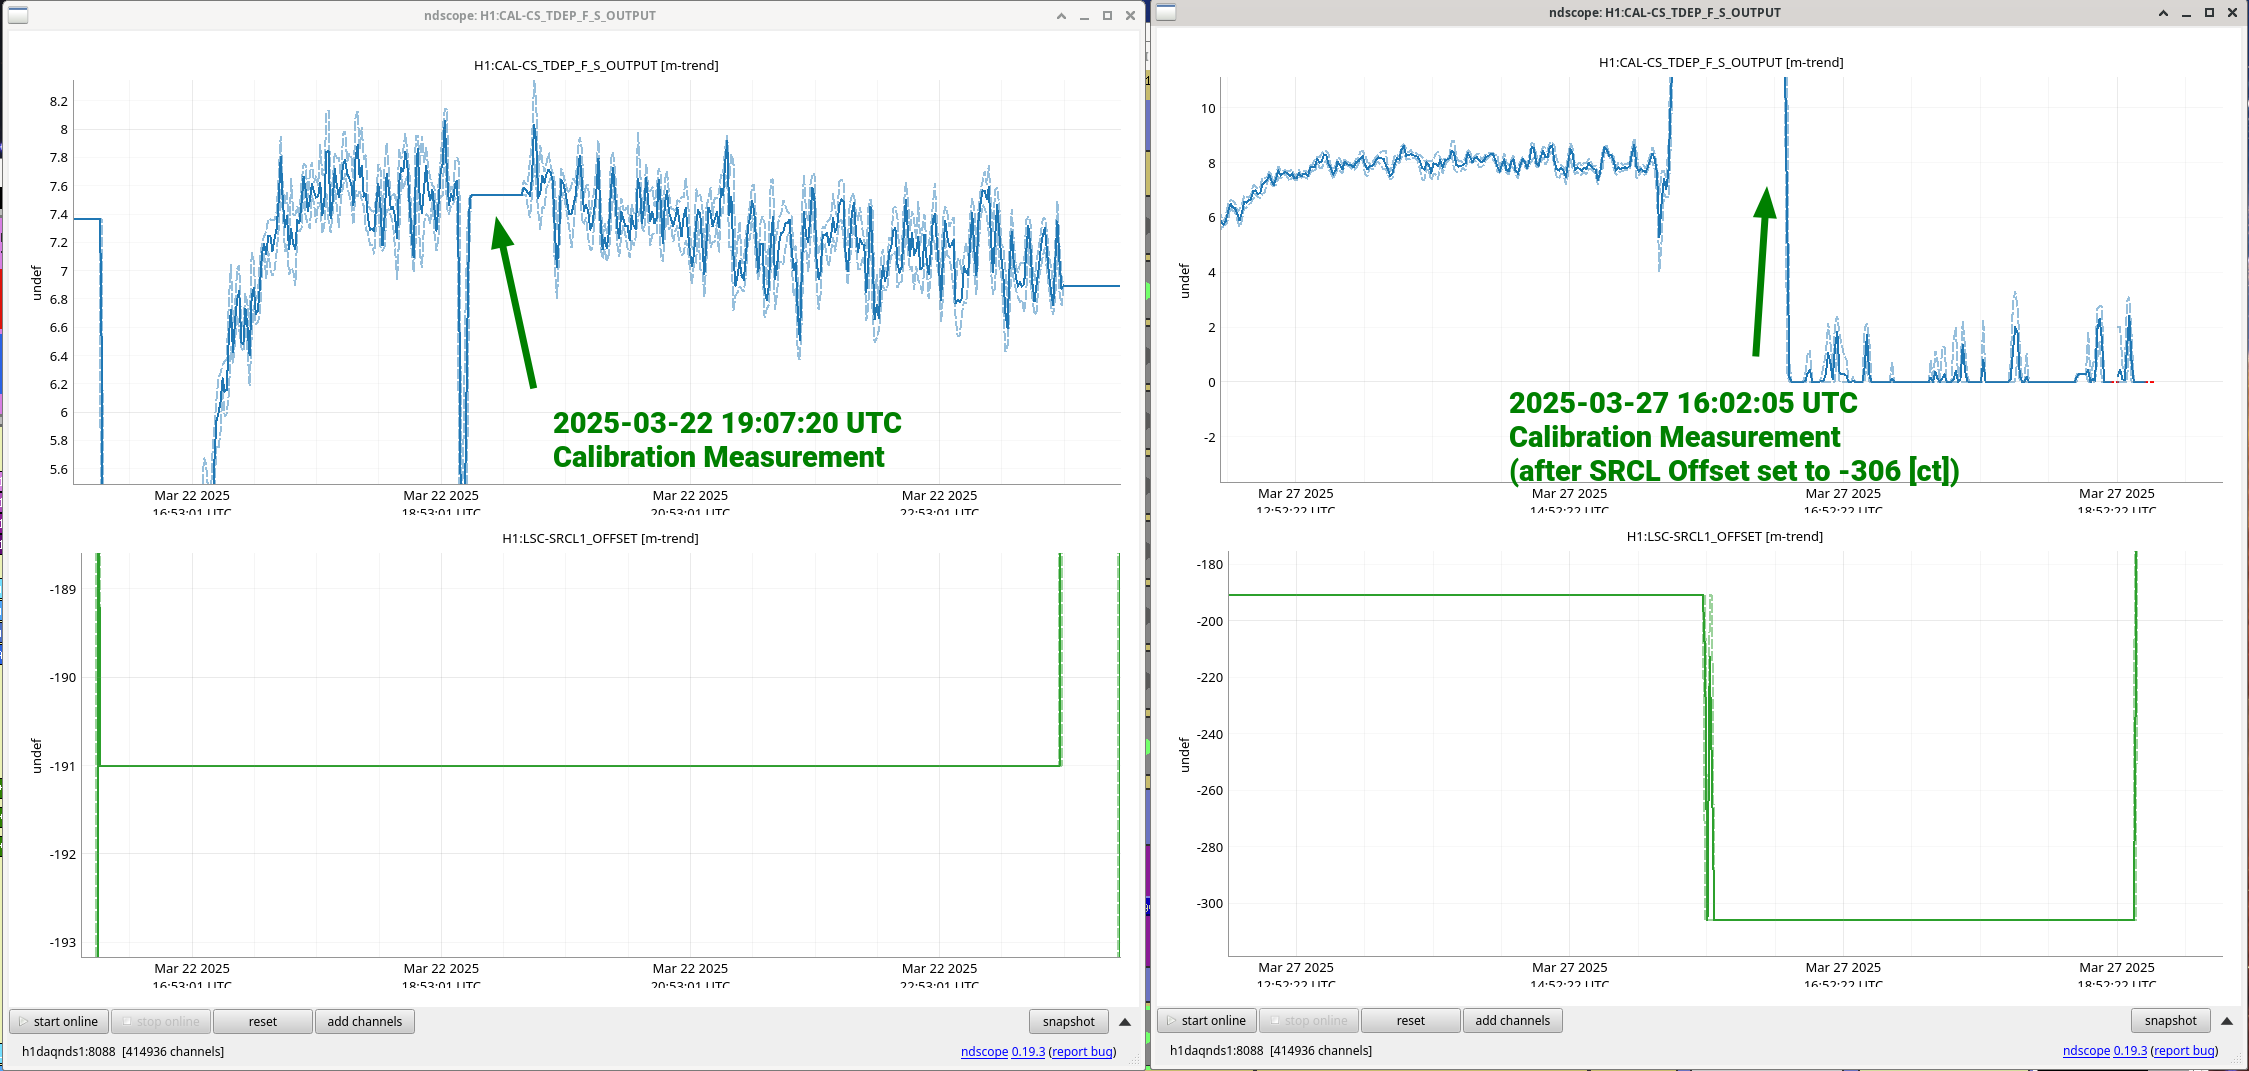
Also -- side note -- I'd been skeptical of the accuracy of the live spring frequency calculation, H1:CAL-CS_TDEP_F_S_OUTPUT.

Looks like it *is* a good measure, or at least the same measure as the sweeps, of the spring frequency.

See attached trends of f_s, surrounding the times of these calibration measurements.

Nice!