jeffrey.kissel@LIGO.ORG - posted 13:23, Thursday 27 March 2025 - last comment - 14:46, Thursday 27 March 2025(83595)
Loud 10.3 kHz Features in OMC DCPD ADC Input Don't Cause Broadband Down-Conversion
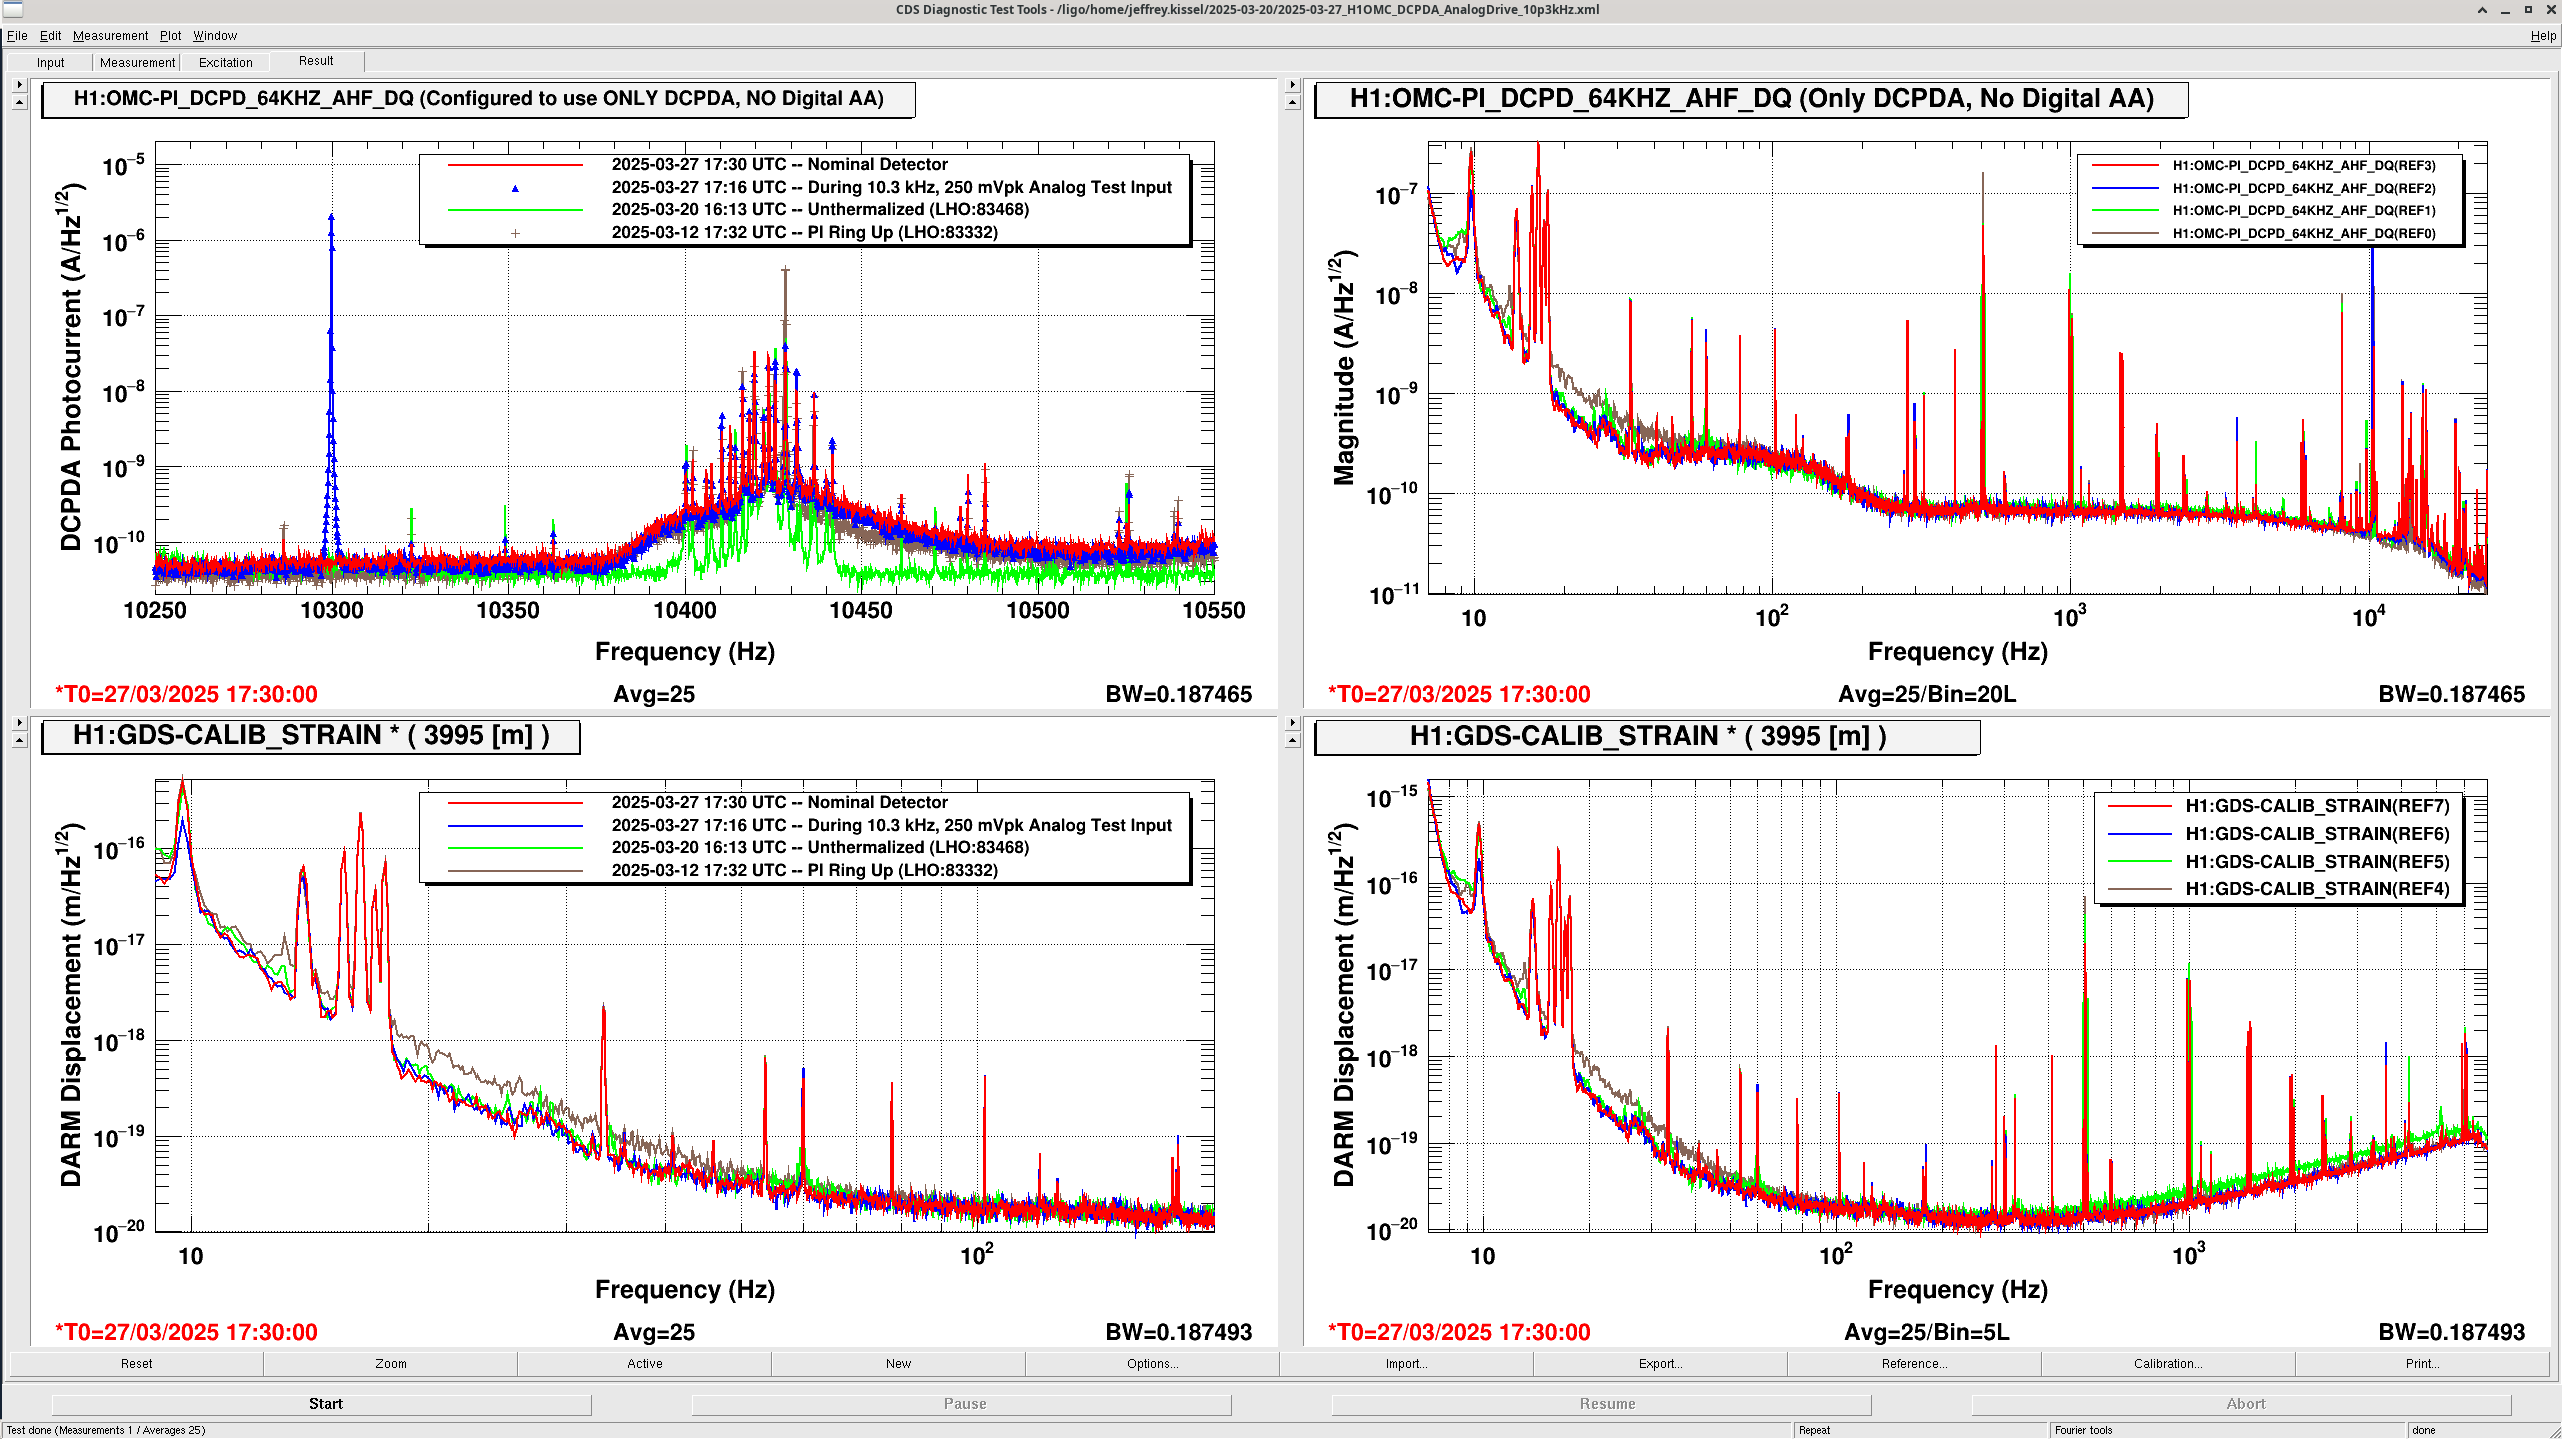
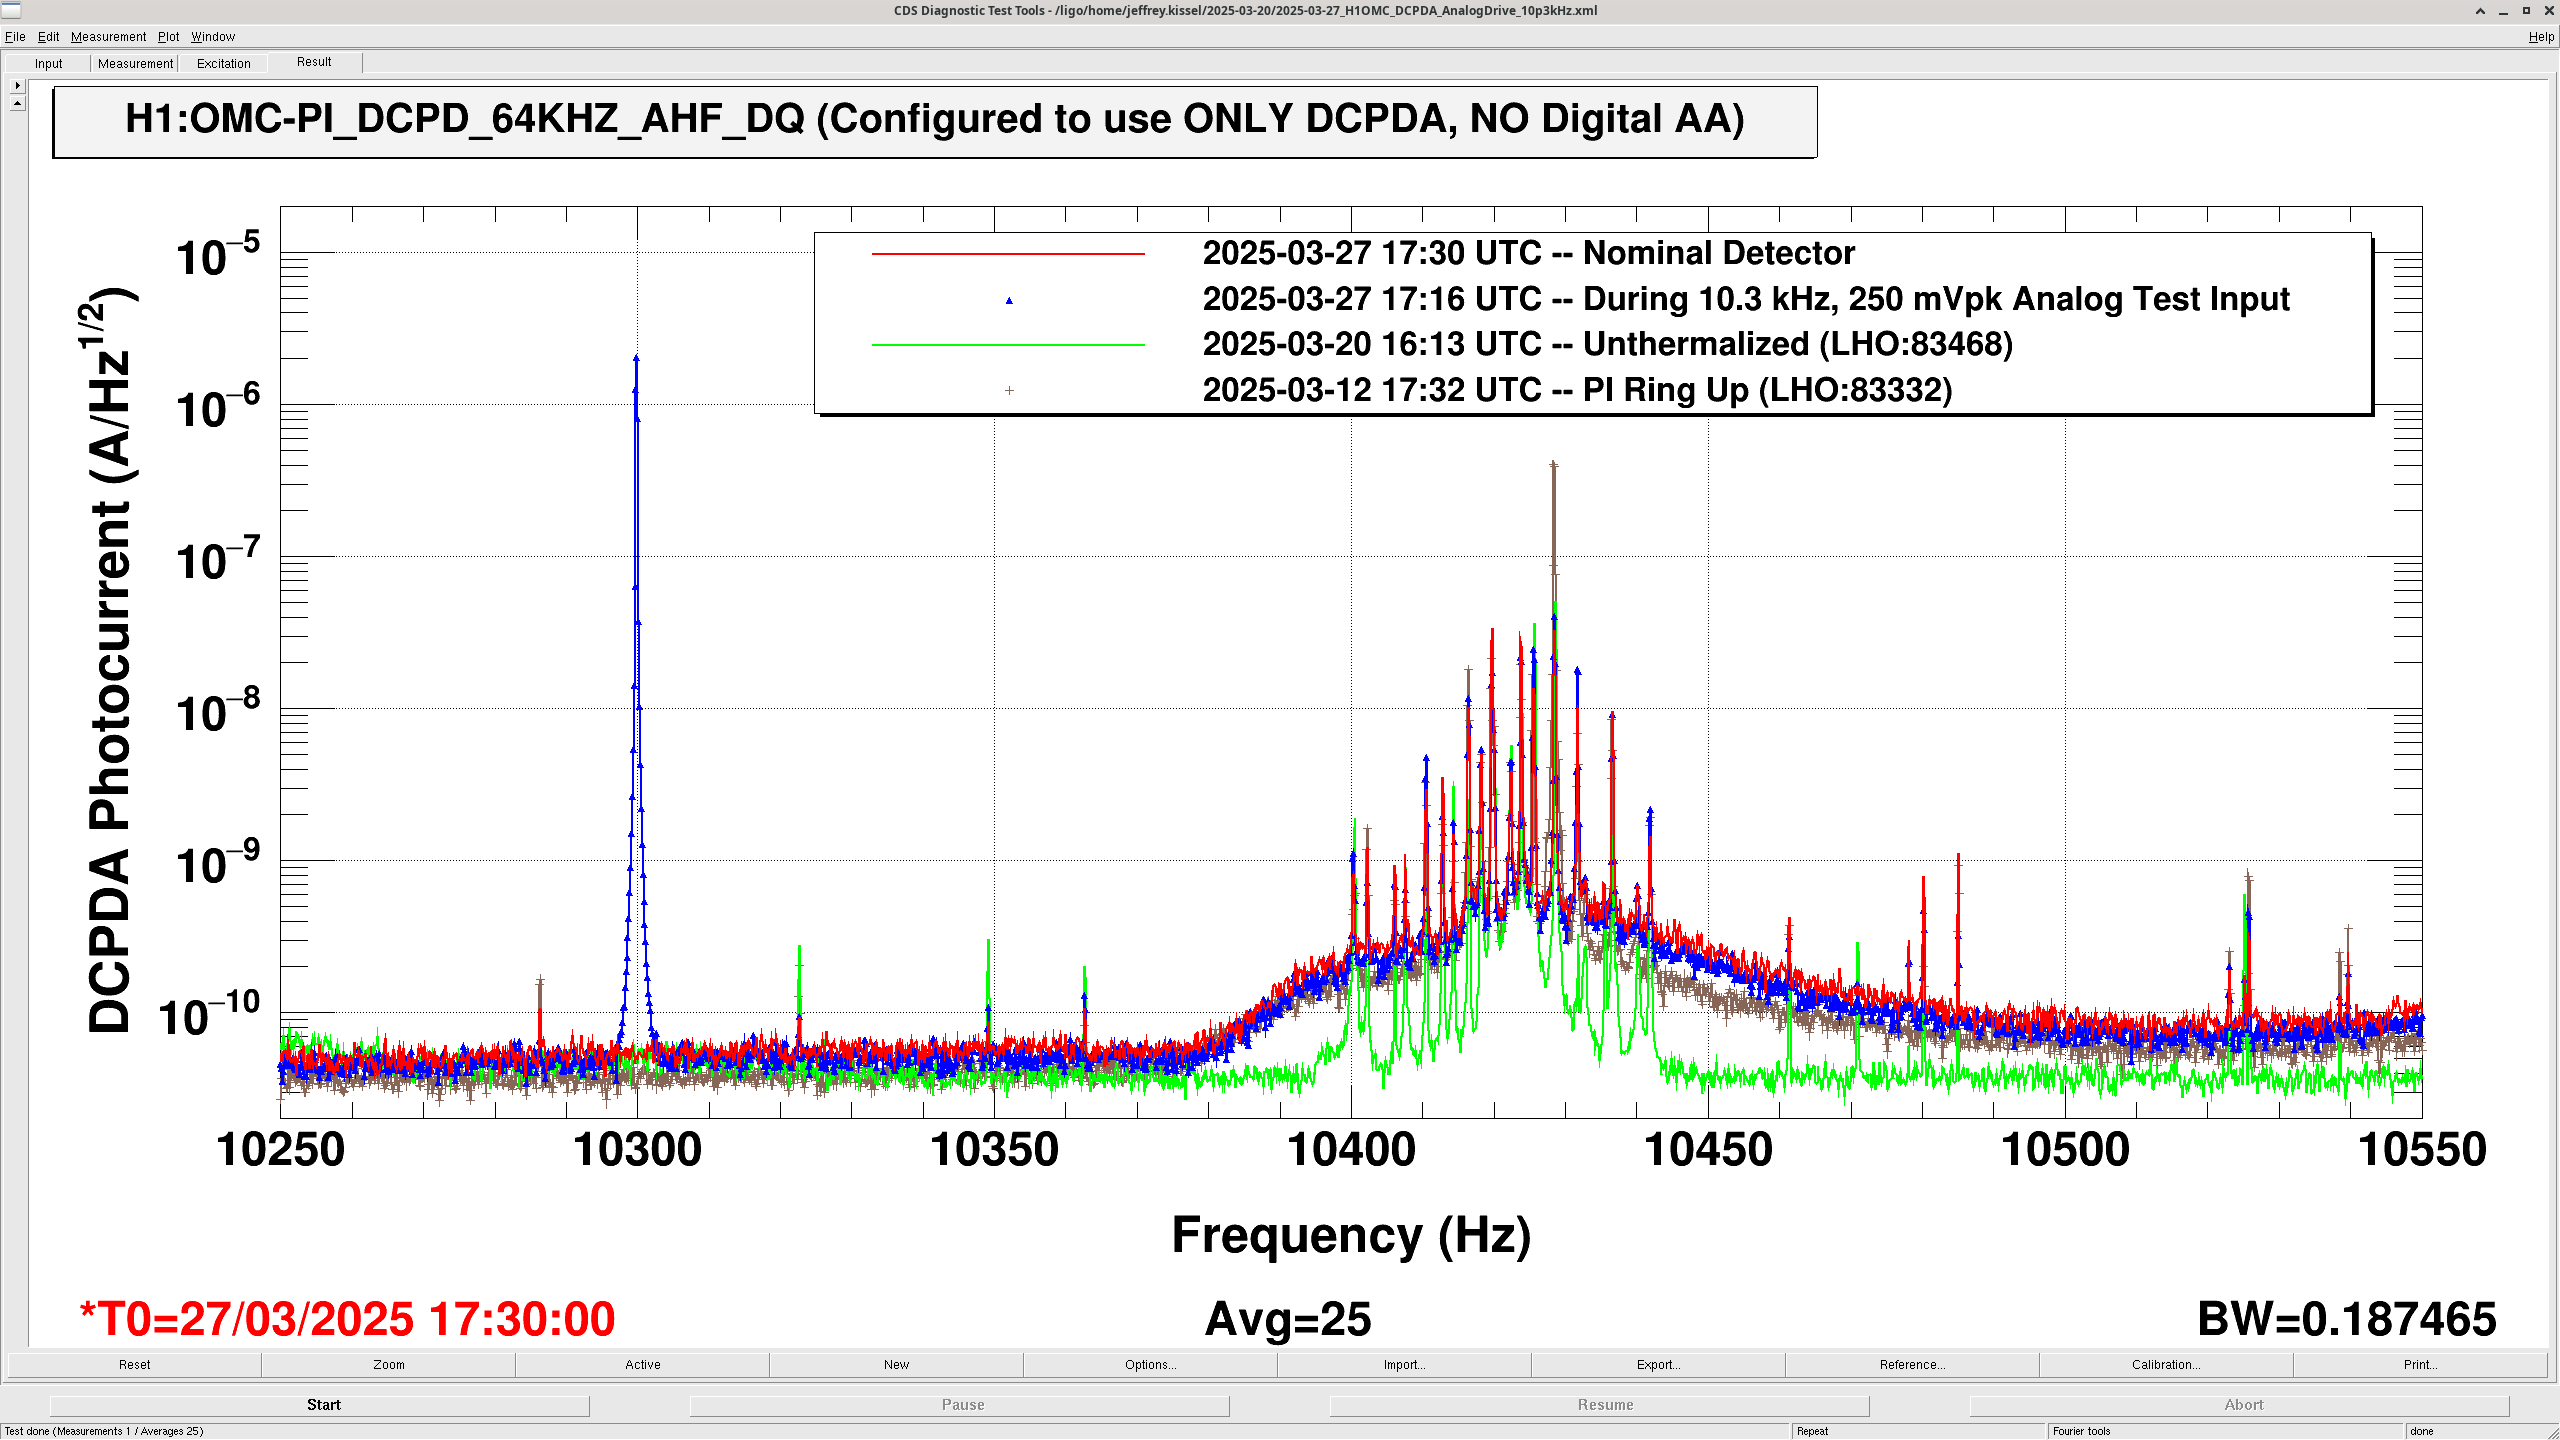
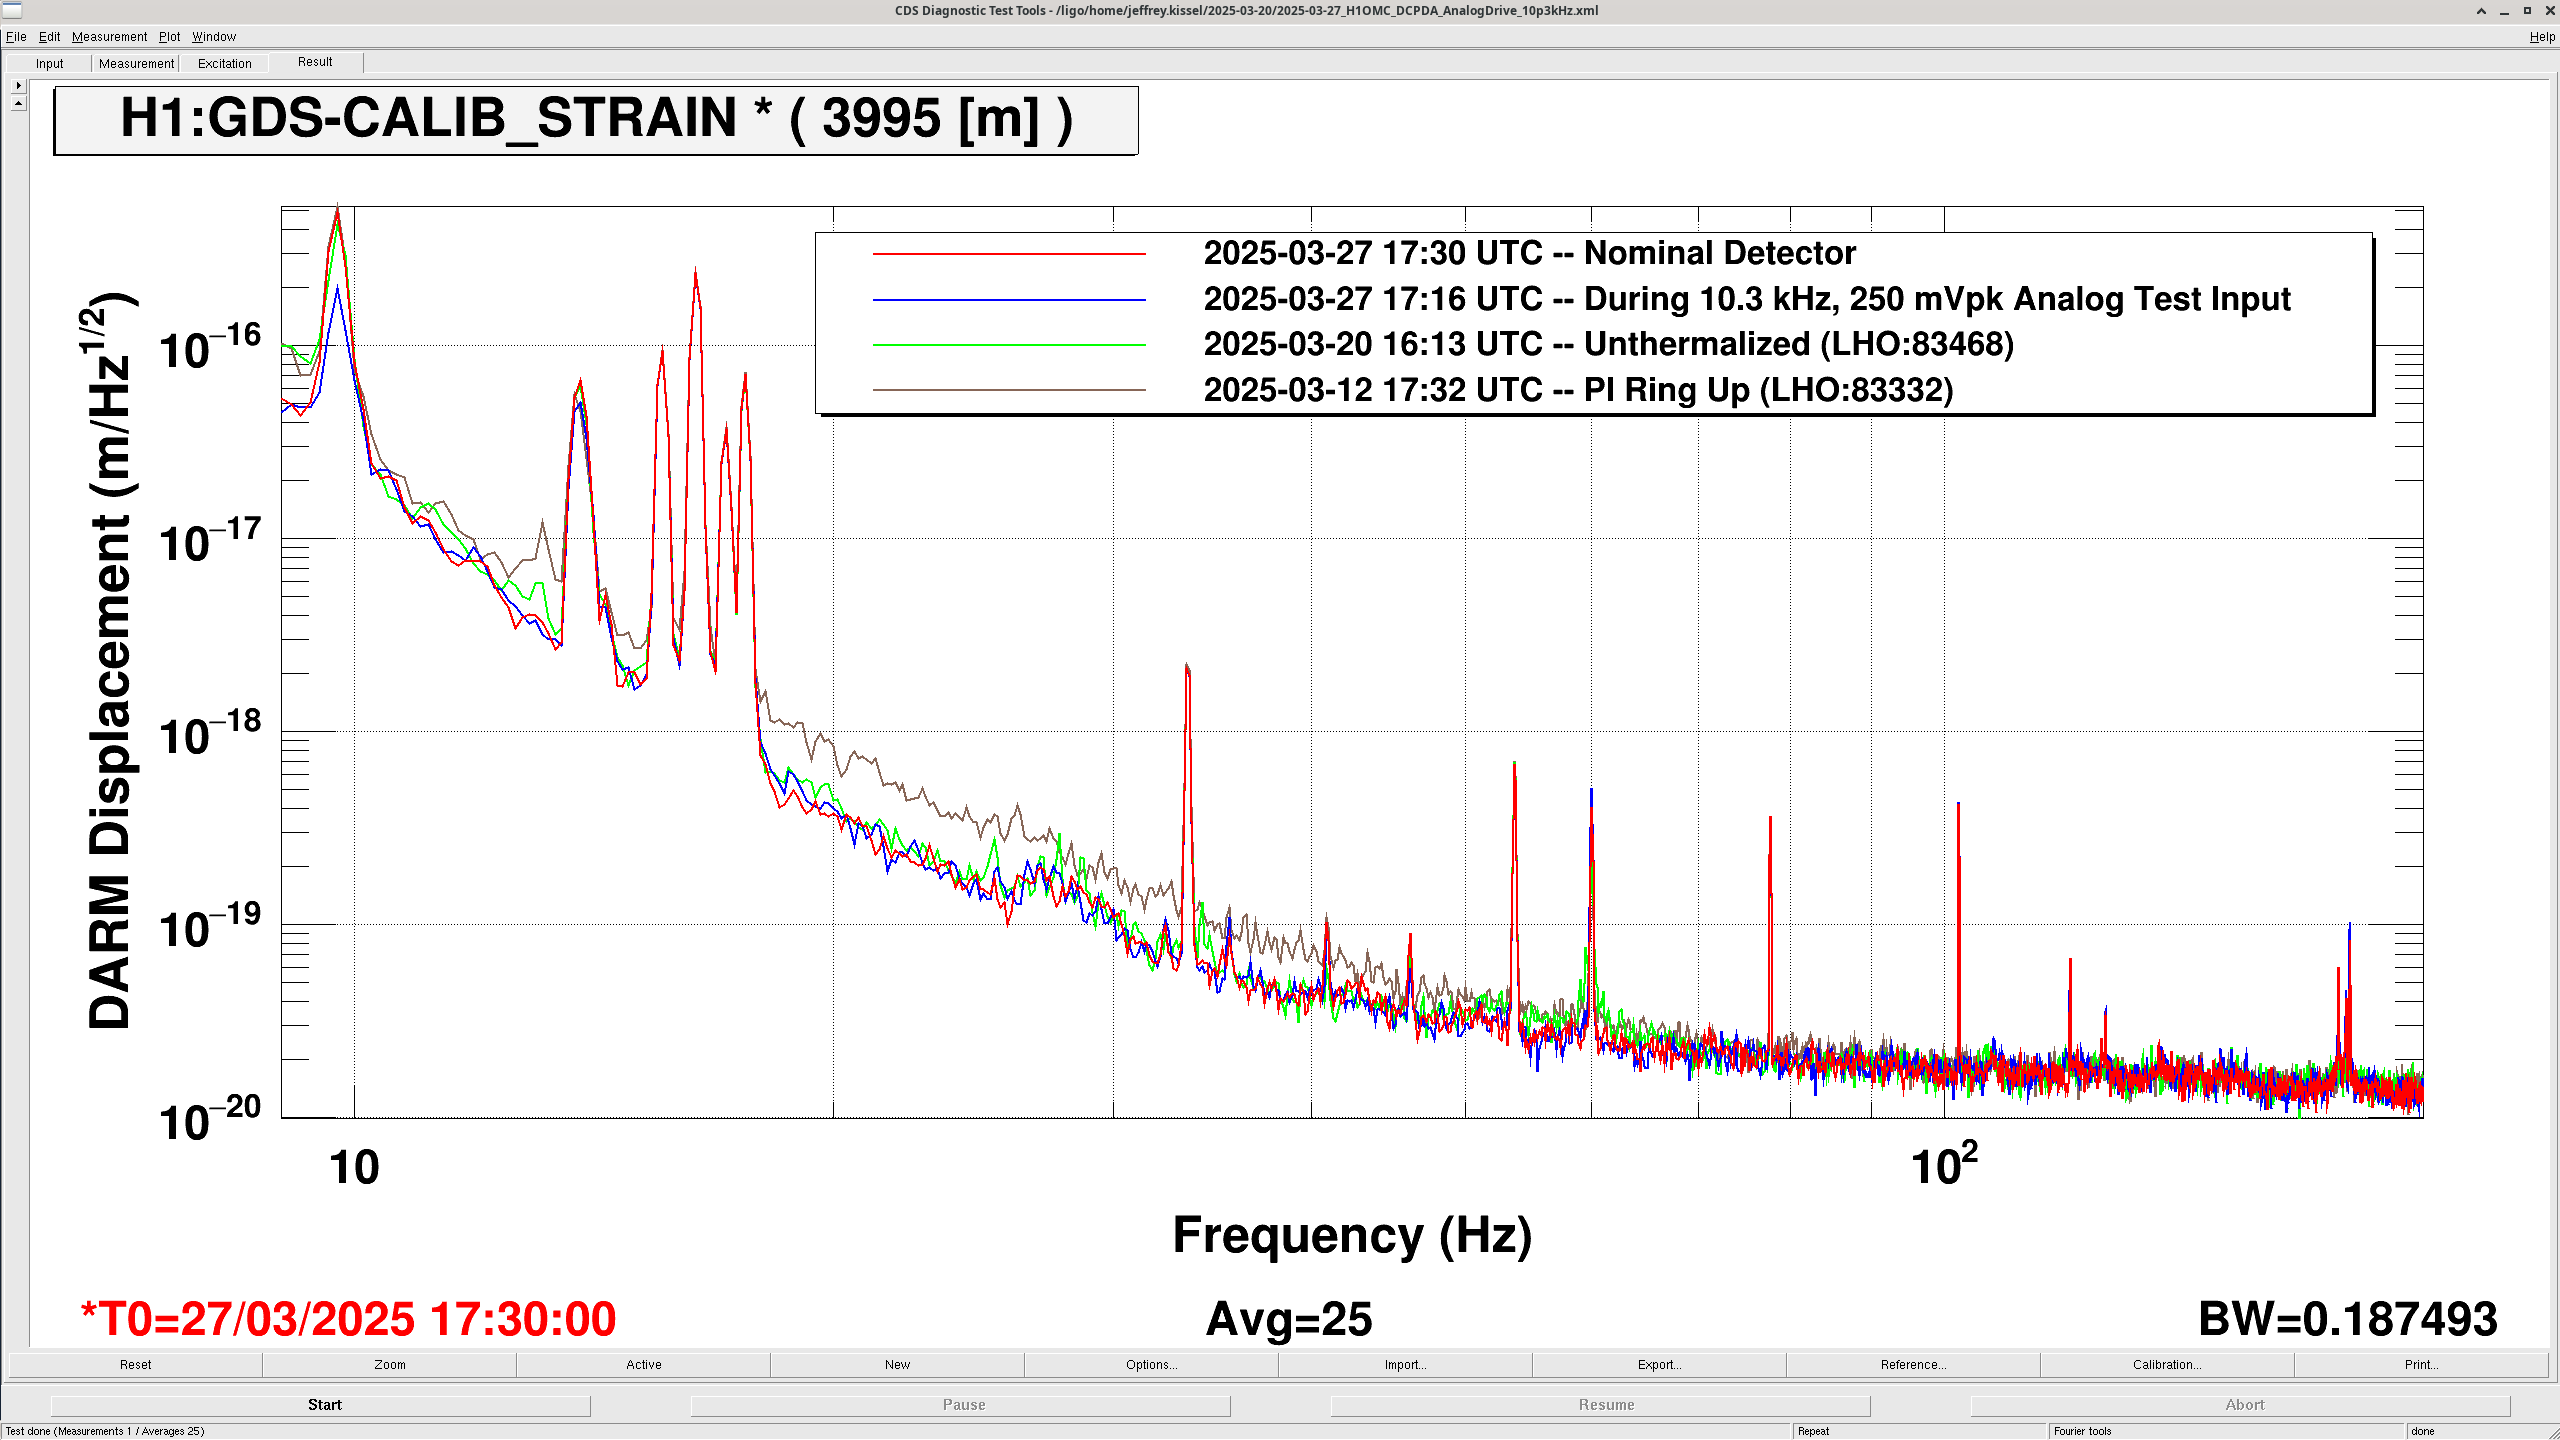
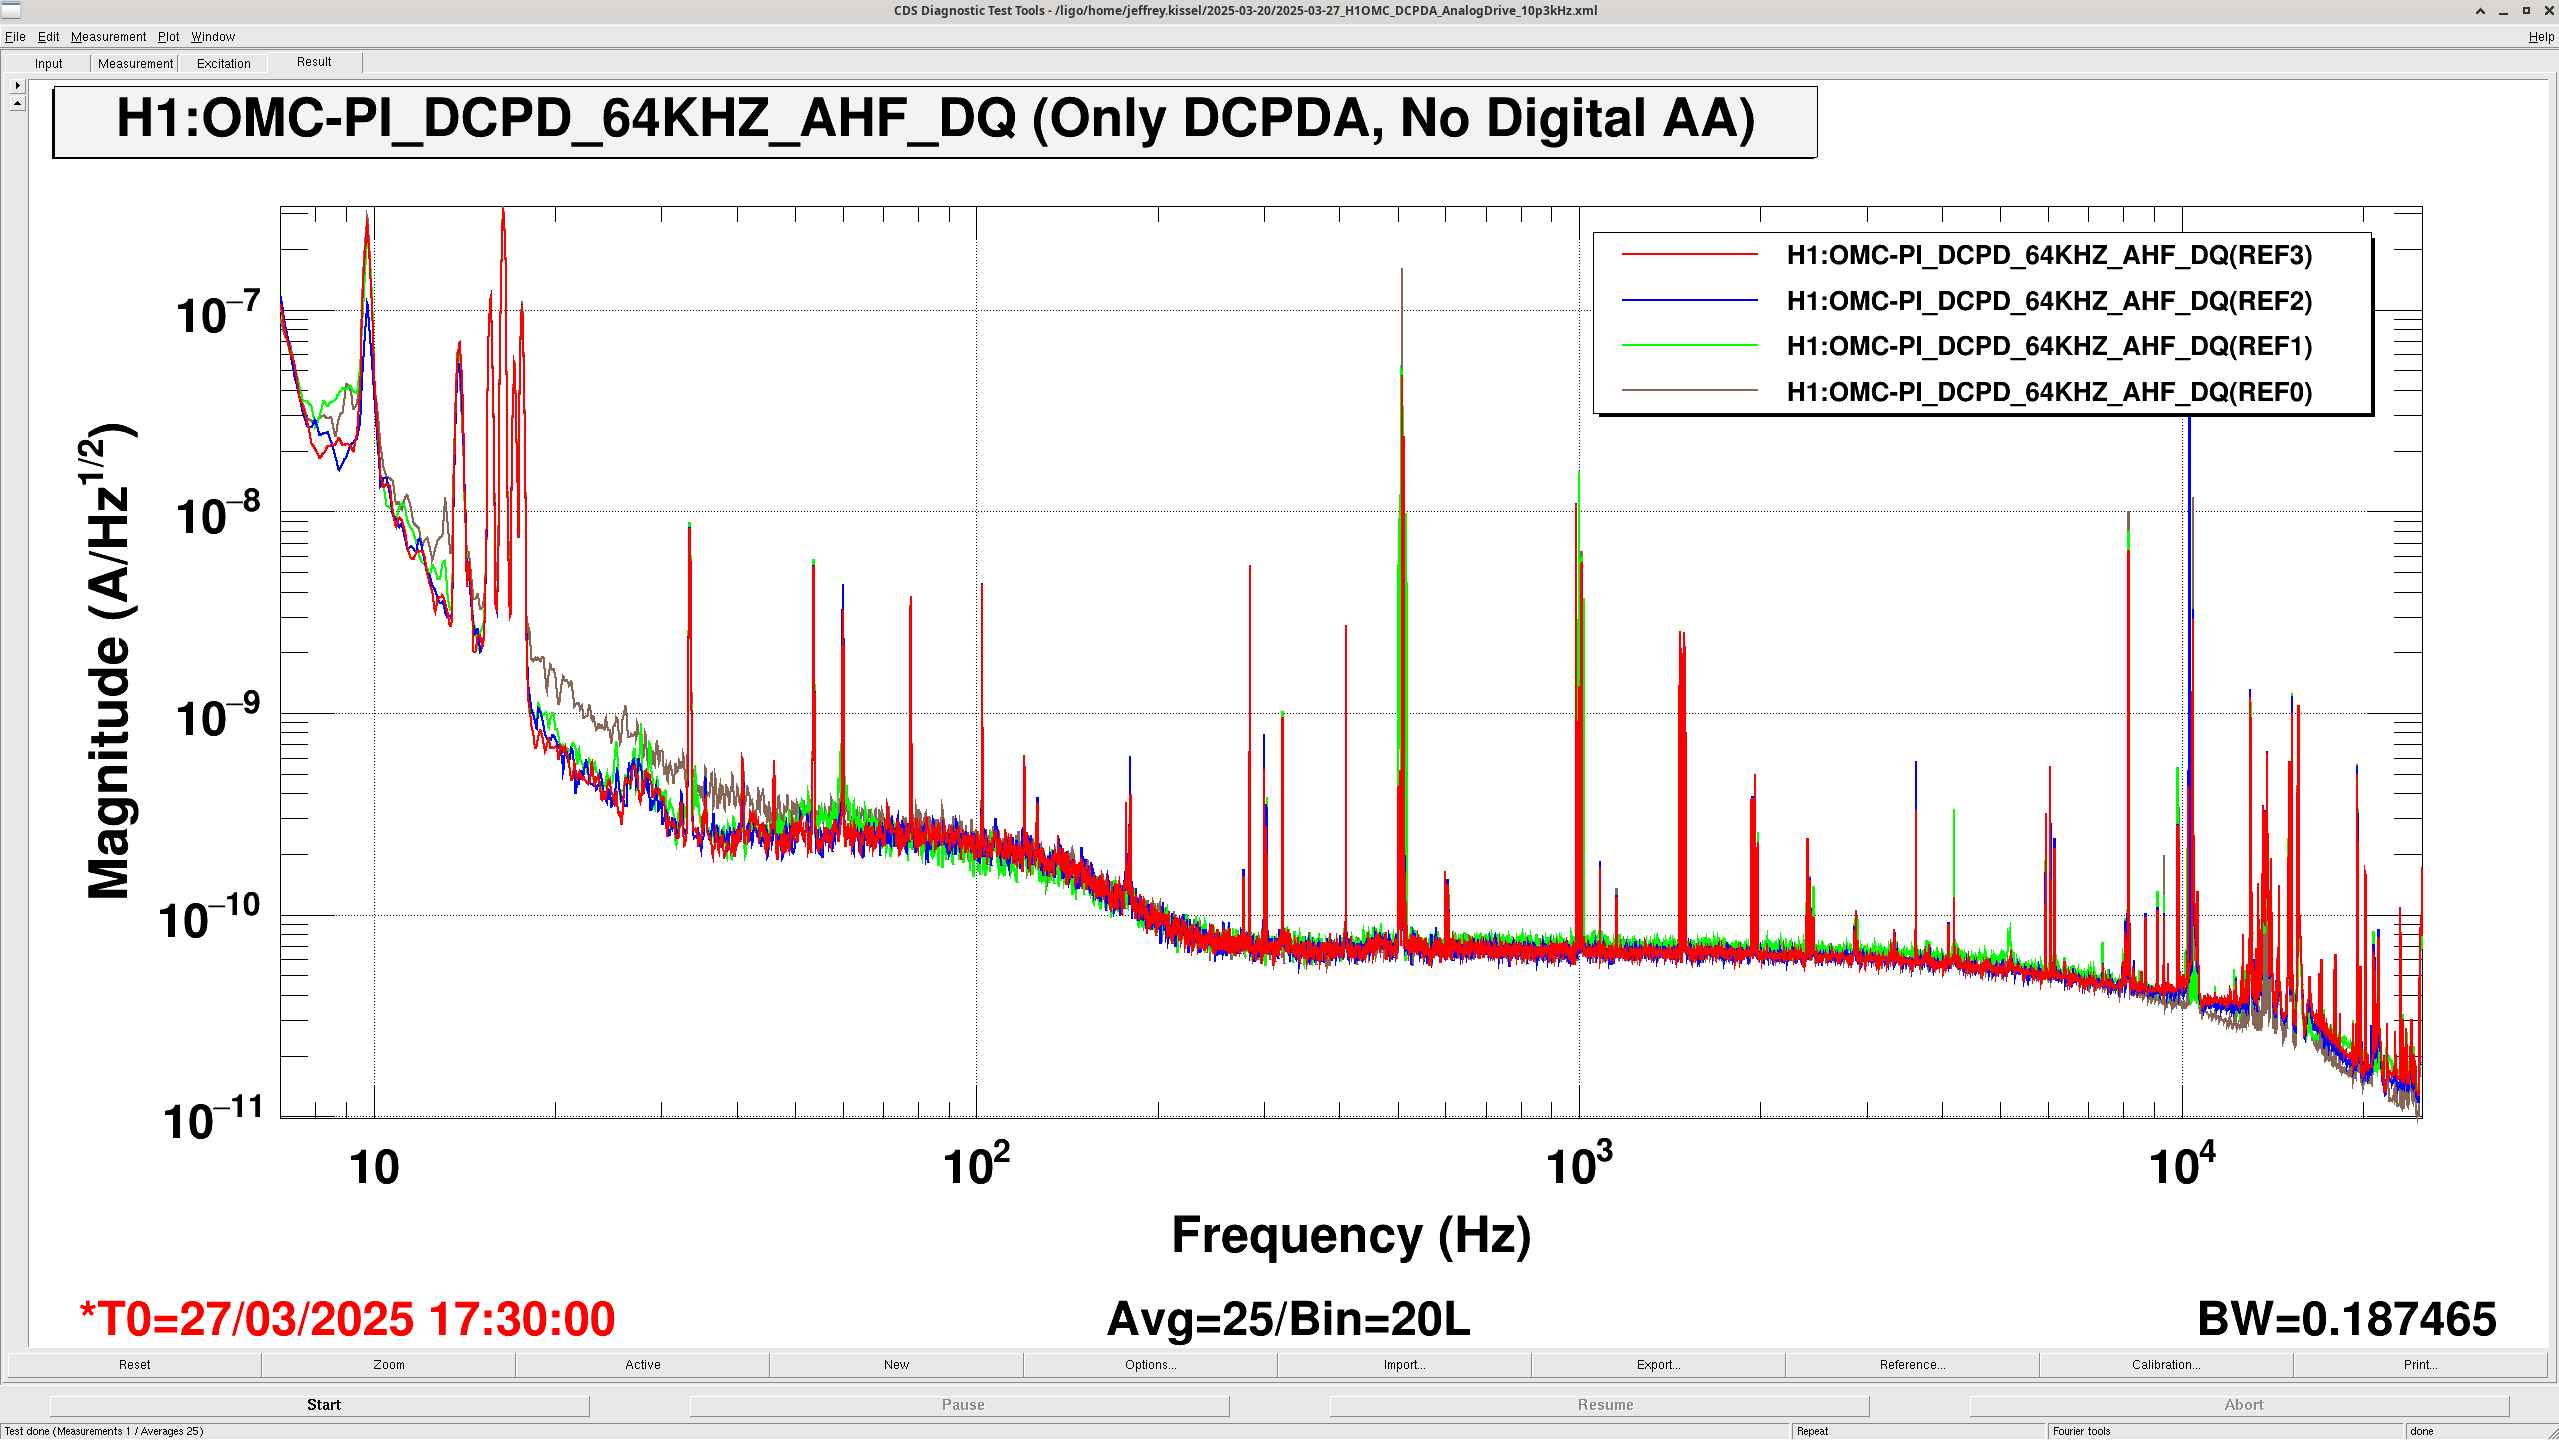
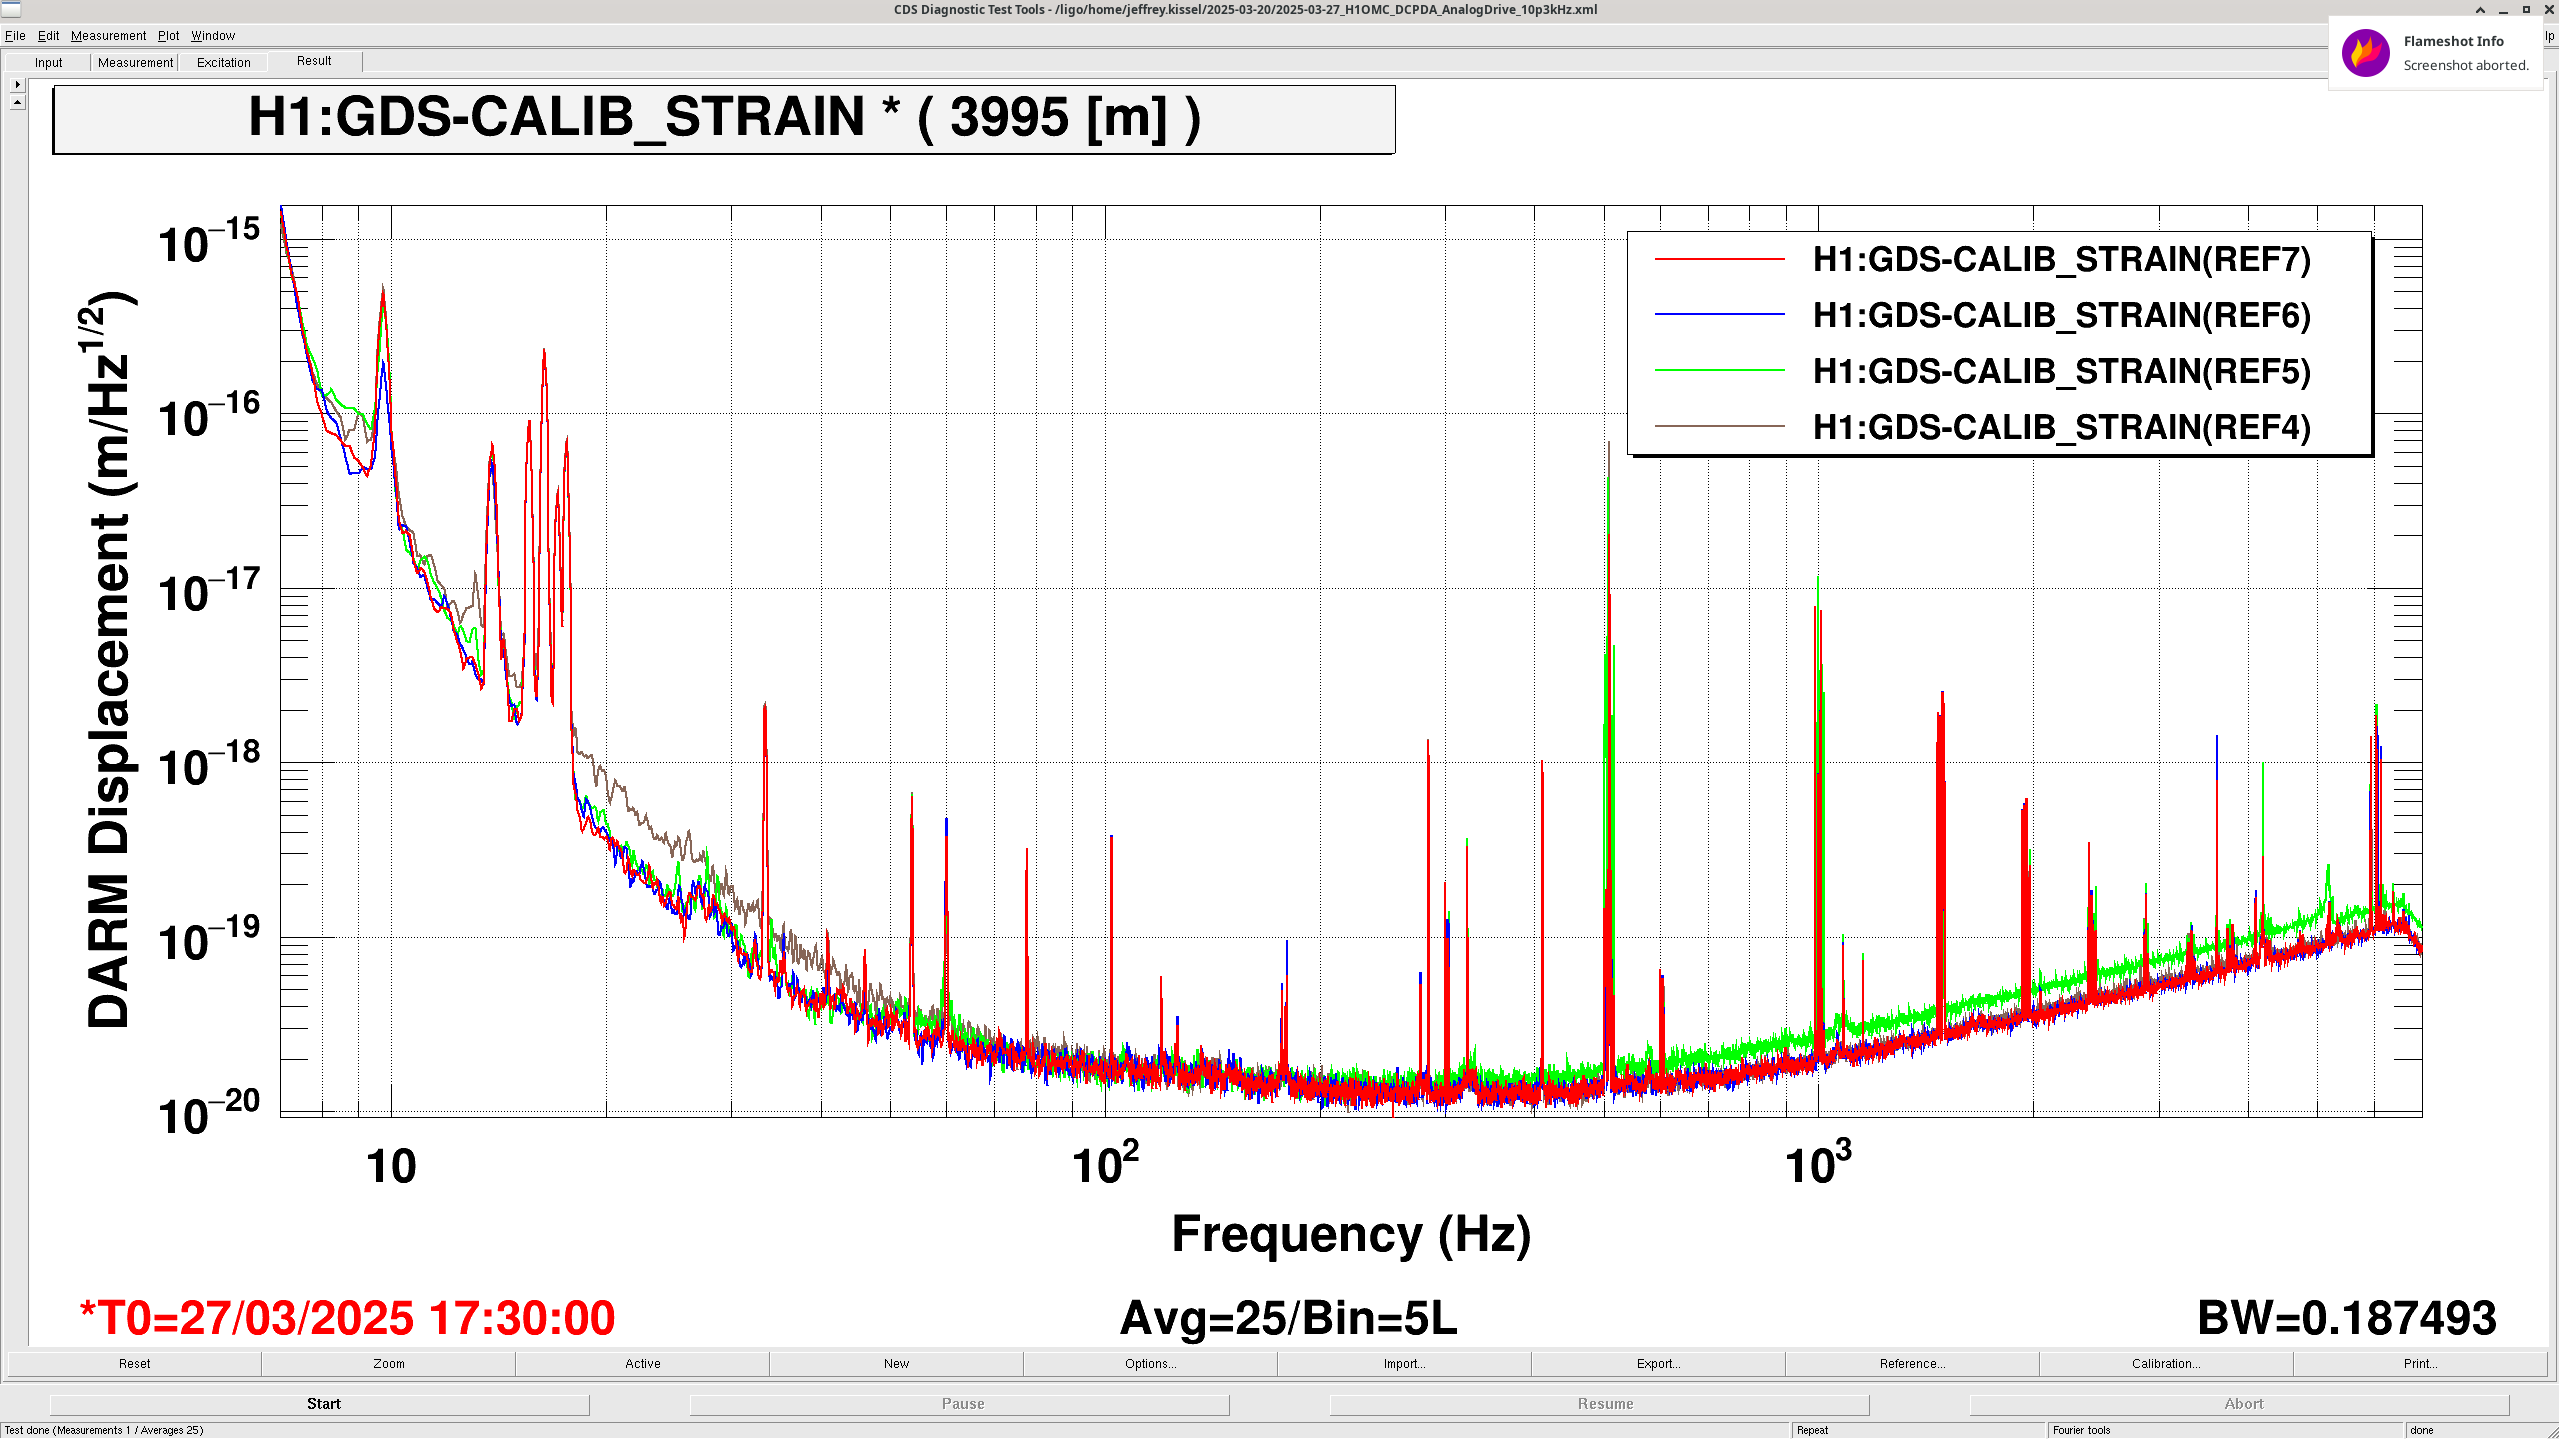
J. Kissel, S. Dwyer

Sheila and I were finally able to use an SR785 by HAM6 ISC-R5 (see setup and discussions in LHO:83523, LHO:83466, and LHO:83468) to inject a loud sinusoidal excitation into the OMC DCPD transimpedance amplifier TEST inputs via analog interface of the OMC DPCD whitening chassis.

Remember, this is in hopes to mimic a PI ring-up and identify whether or not this would cause ~10-100 Hz broadband noise increase in the detector sensitivity, as was seen on 2025-03-12 (LHO:83335).

We saw NO broadband low frequency noise increase with an excitation amplitude that results in a factor of 5x *higher* photocurrent on the DCPDs than during the PI ring-up.

I attach a four-panel plot, and because that makes each panel small, I also attach the same plots zoomed in to each panel.
In the plots, I'm comparing four different times:
    - (RED) 2025-03-12 17:32 UTC -- the time of the 10.4 kHz PI mode ring-up from LHO:83335
    - (BLUE) 2025-03-20 16:13 UTC -- the time I used in LHO:83468 to assess how much drive I should be able to put in,
    - (GREEN) 2025-03-27 17:16 UTC -- a time during the loudest, 250 [mVpk_SE, SR785 SRC output] excitation
    - (BROWN) 2025-03-27 17:30 UTC -- just after we're done with our tests and everything is unplugged in the nominal configuration

Upper panels of 1st Attachment (zoomed in with 2nd and 4nd attachment)-- the 65 kHz version of the OMC DPCD A channel that has NO digital anti-aliasing (under the obfuscated channel name H1:OMC-PI_DCPD_64KHZ_AHF_DQ), calibrated into photocurrent on DCPDA (which needs only a conversion of 0.001 [A/mA]).
    - Left panel (and 2nd attachment) is zoomed in around the 10.2 - 10.5 kHz region, showing the excitation, The acoustic mode forest, and except for the unthermalized data, the 02 (or 20) optical mode hump.
    - Right panel (and 4th attachment) is the full ASD across the 10 Hz - 25 kHz frequency range.

Lower panels of 1st Attachment (zoomed in with 3rd and 5th attachments) -- GDS-CALIB_STRAIN converted to DARM displacement (which needs only a multiplication by the length of the arms, L = 3995 [m]).
    - Left panel (and 3rd attachment) zooms in on the 10-100 Hz frequency region, and
    - Right panel (and 5th attachment) shows the whole 10 - 7000 Hz sensitivity.

There's NO change between BLUE (excitation OFF) and RED (excitation ON), and thus no evidence of broadband noise increase we saw in BROWN (during PI ring-up).

%%%%
Measurement notes
- For no particular reason, we turned on BOTH DCPDA and DCPDB test excitation relays (see LHO:83466 for how). That means our single-ended qqq [mVpk] analog excitation from the SR785, converted to qqq [mVpk] differential by the SR785 Accessory Box (whose TF is 1 [V_DIFF] / 1 [V_SE]), was driving that qqq [mVpk] amplitude into BOTH A & B channels' TEST inputs within the TIA. So, the excitation seen in OMC DCPDA's ADC input is also in DCPDB, and thus the sum of the the two, OMC_DCPD_SUM, the DARM error signal, actually sees twice this amplitude. But, the sum is done digitally, after down-converting to 16 kHz, so it's not relevant to "is the ADC getting saturated" discussions; just important to bring up in "how much of this excitation can the IFO handle" discussions.
Images attached to this report
Comments related to this report
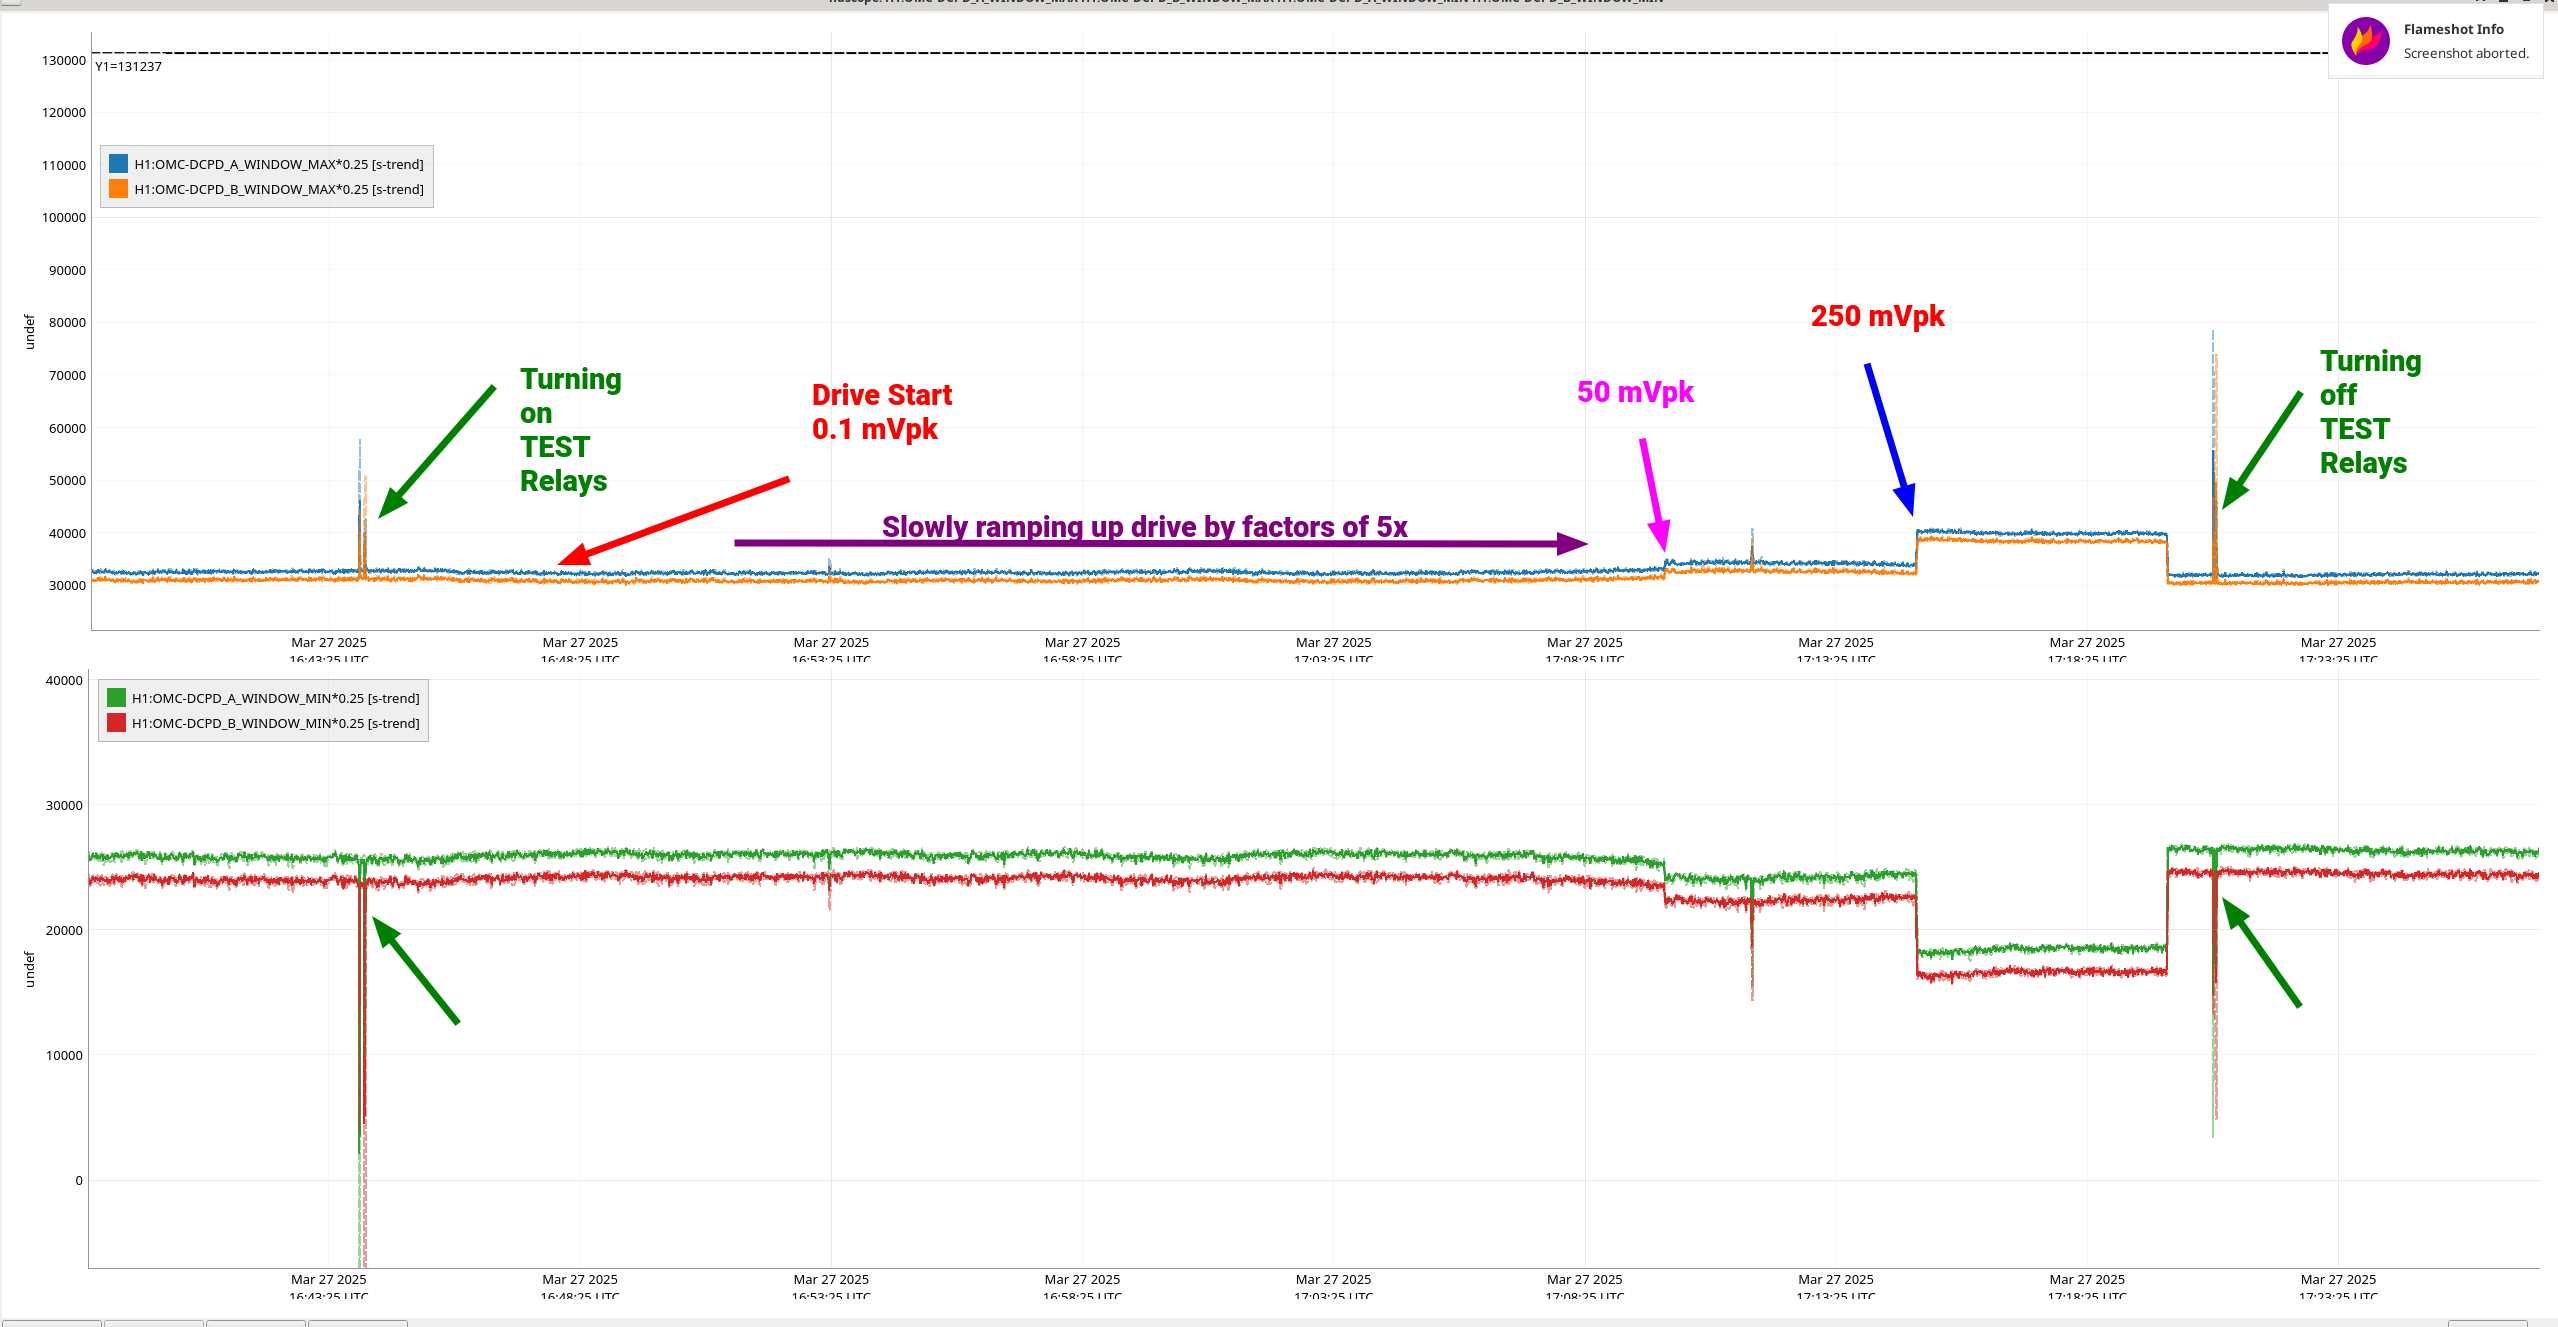
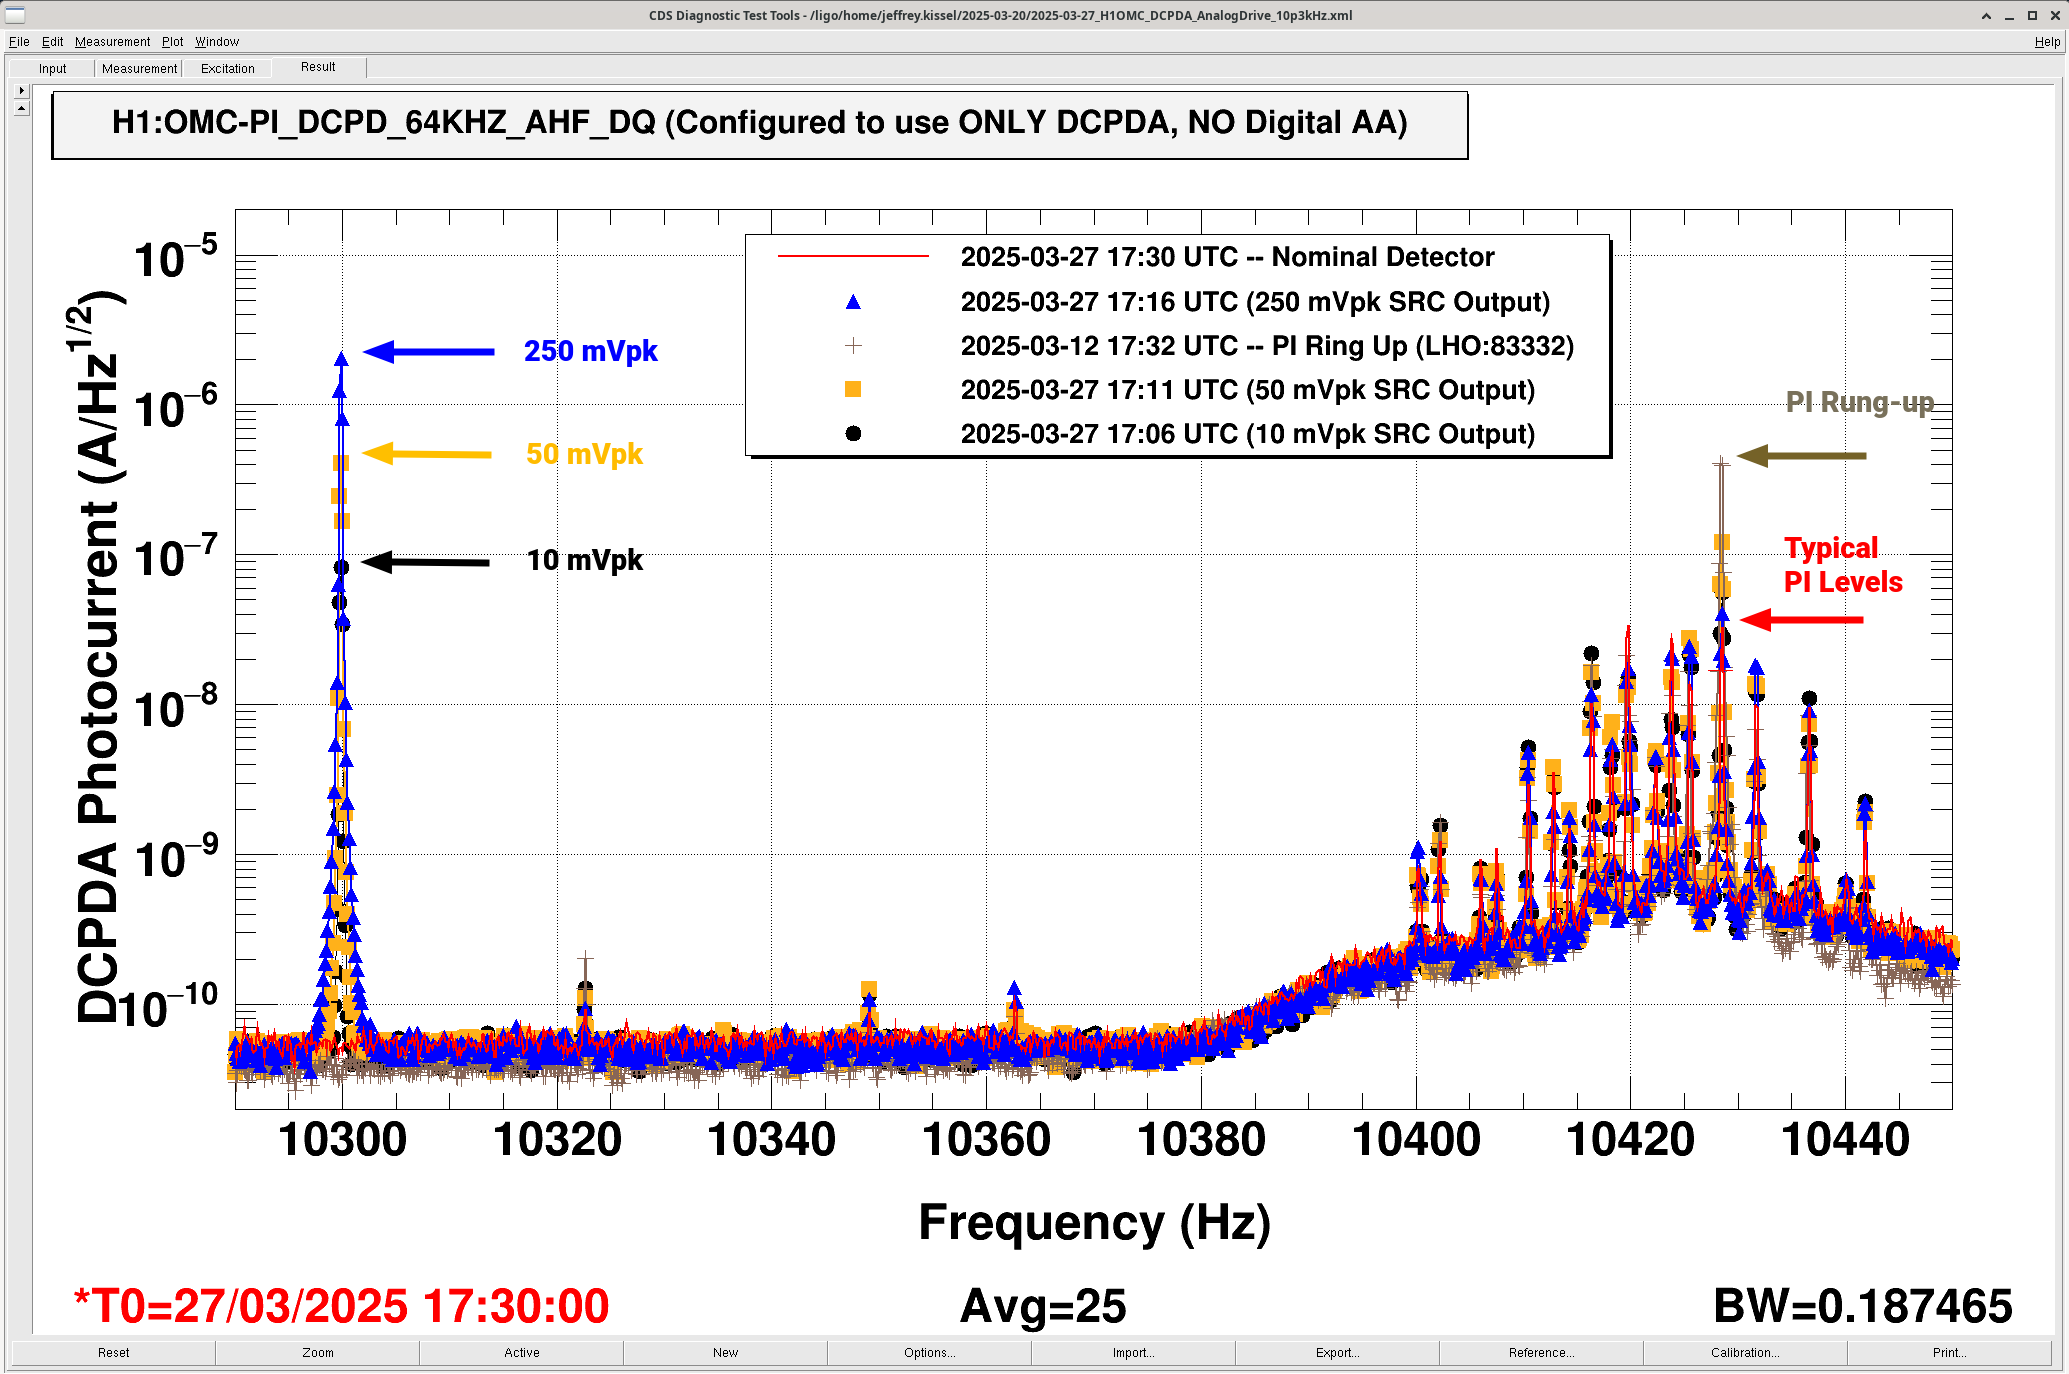
As an aside, here I attach a trend of the H1:OMC-DCPD_[A,B]_WINDOW_[MAX/MIN] channels (the details of which can be found in LHO:62310). In short they're looking at the 4-channel SUM of each DCPD's 4x analog copies of the voltage going into the the ADC, in units of 4x ADC counts.

In the attached trend, I divide these by 4 (or scale by 0.25), to compare against the saturation limit of a single ADC channel, which is what we really want.
Remember this the General Standards Low Noise Fast ADC, which spreads its 40 Vpp input range across 18 bits, so the saturation limit is +/-2^17 = +/- 131072 [ADC ct].

In the trend, I highlight when we engaged the relays (without any SR785 excitation on) and when we turned them off to show how loud that is. We did *not* break lock from those glitches, but it sure made the ETMX actuators sad for a bit and caused a big glitch in the detector.
I also highlight the period over which we increase the amplitude of our excitation from 0.1 to 250 [mVpk_SE, SR785 SRC Output].
Our excitation doesn't start to show up as contributing to this ADC channel MIN/MAX time-series until we hit excitation amplitude of 50 [mVpk_SE, SR785 SRC Output].
It reaches at most 40k [ADC ct] = 6.1 [Vpp_DIFF, ADC Input] (again, of 40 Vpp_DIFF, so 15% of the range) at our loudest excitation amplitude of 250 [mVpk_SE, SR785 SRC Output].

I also attach the same OMC DCPDA photocurrent ASD in the main entry, but I add what the DCPD photo current ASD looks like under lesser excitation amplitudes; 10 mVpk in BLACK, 50 mVpk in ORANGE, and the one I've already shown, 250 mVpk (again in BLUE).

Again, the 250 [mVpk SRC Output] excitation is a factor of 5x above the amplitude that this PI mode was at the time of the low frequency broadband noise.
Sheila reminds me that we've seen PIs *louder* than this time and *not* seen any broadband low-frequency noise increase.

But anyways, even at 50 [mVpk_SE, SR785 SRC Output] -- which according to this ASD
    (a) The equivalent to a photocurrent of 4.07e-7 [A/rtHz] at 10.3 kHz
    (b) Comparable to the height of 4.04e-7 [A/rtHz] at 10.428 kHz
 (for a 0.1 Hz frequency resolution, which DTT turns into an 8 sec FFT or 1/8 = 0.125 Hz resolution, and Hann window; ENBW = 0.187)
-- this starts to dominate the ADC's RMS, since there is a noticeable change in the WINDOW MAX/MIN channels.
But it's a small fraction of the ADC range.

I note that the OMC DCPD analog whitening was ON at all times during our measurements today, and during each of the old data sets.
So that means, at these frequencies, there's an extra gain of 10x on the TIA output voltage.
Images attached to this comment