FranciscoL, SheilaD, JoeB
In summary:
I regenerated the mcmc fit on report 20250327T160138Z at 5, 10 and 20 Hz, to compare how the mcmc model would change given different frequency ranges for the fit. We see that the residual of the measurement to the model is better as we increase the minimum frequency threshold. We think this is due to external effects, aside SRC, confusing the model.
We want to give more validity to our observations on alog 83592 -- that the sensing model at low frequencies is a good descriptor of the sensing function. On 83592, I claimed that the observed changes in the sensing function come from changes in SRCL detuning. This is backed up by a low residual on the measured/modeled sensing function. In today's alog, we evaluate how well the model describes the sensing function by (1) having a *low* residual and (2) decreasing the optical spring frequency.
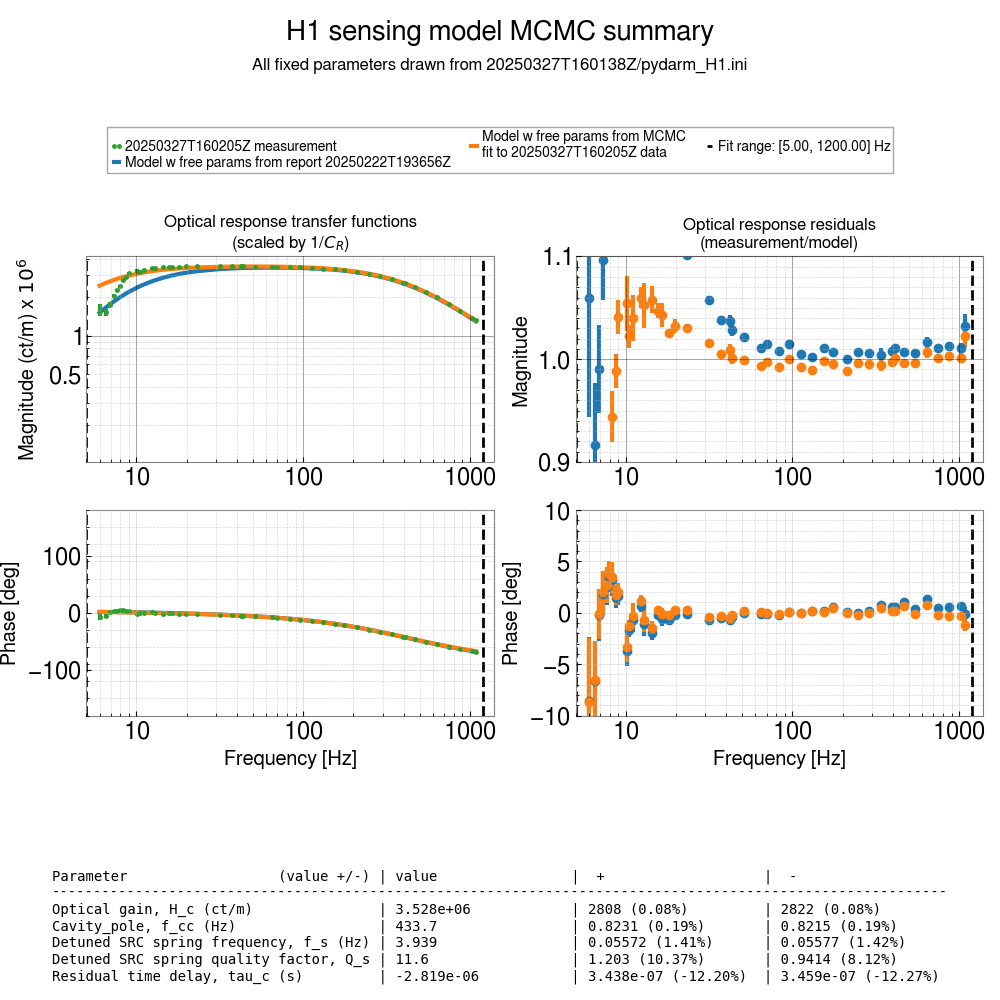
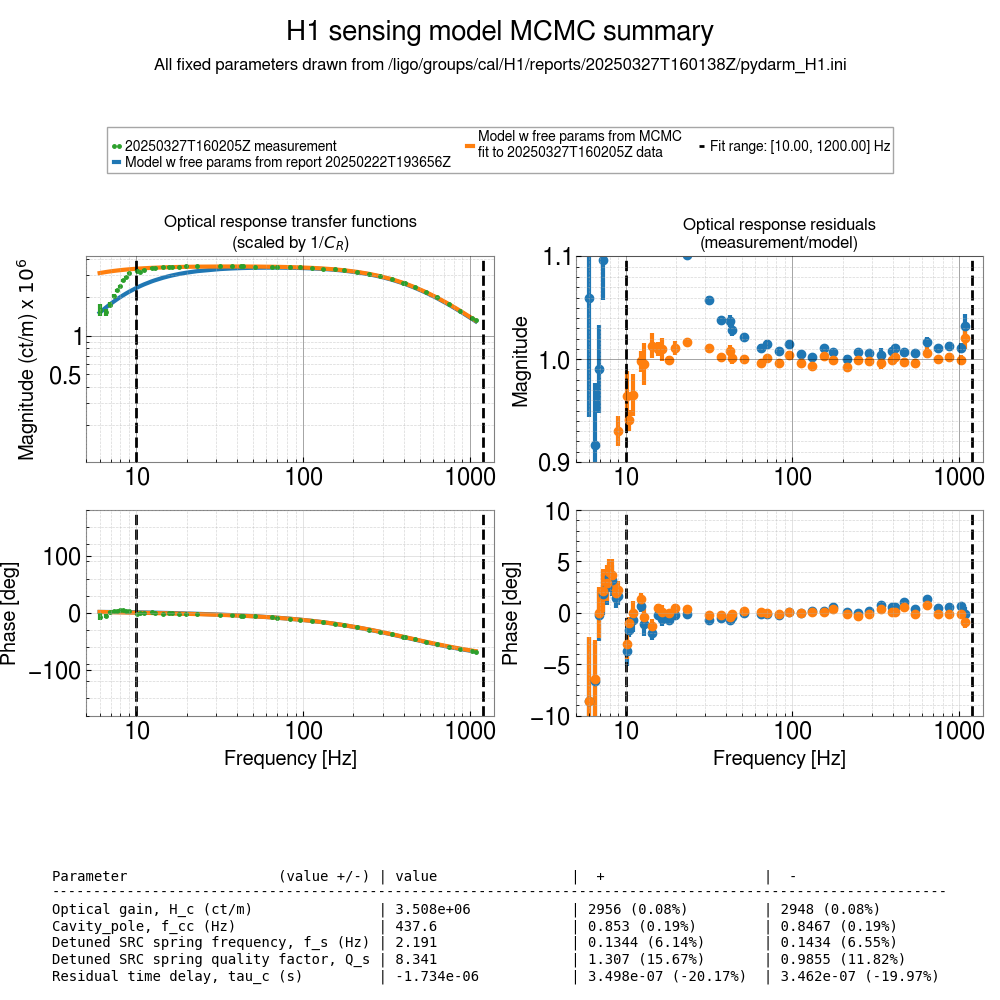
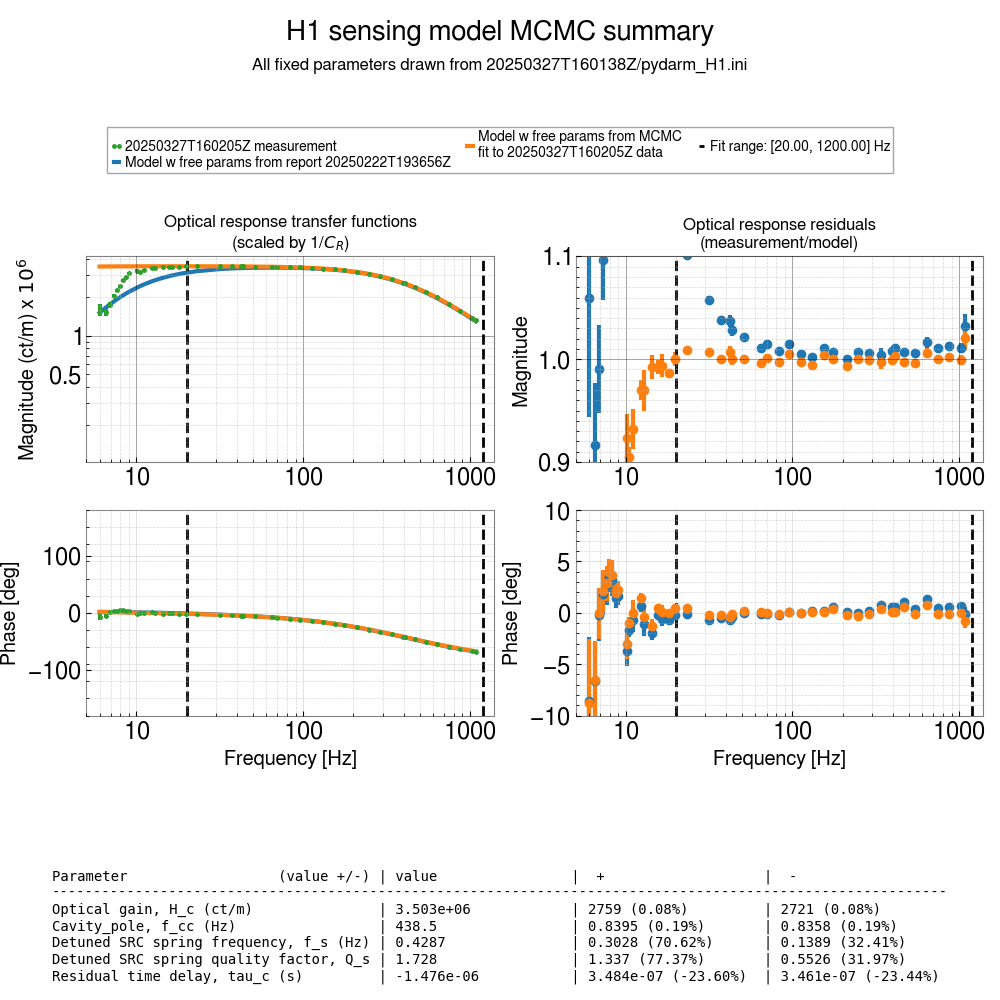
The first three figures attached ('sensing_mcmc_compare_*Hz.png') are the sensing function plots generated by pydarm for measurement 20250327T160138Z. This measurement is not a representation of a calibrated interferometer, since we tuned the SRCL detuning (83585).
From the transfer function on the left, the green dots represent the measurement, the orange trace is the mcmc model from the measurement, and the blue trace is the mcmc model from the last validated calibration measurement (20250222T193656Z). The residual from the measurement to both models are plotted on the right, matching the colors of the respective models. We are interested in the change of the orange trace when we modify the frequency range of the fit.
Each figure has a pair of vertical lines denoting the limits on the frequency range used for the fit. I regenerated the measurement report for 05, 10, and 20 Hz for the minimum frequency. The maximum frequency at 1200 Hz was not changed.
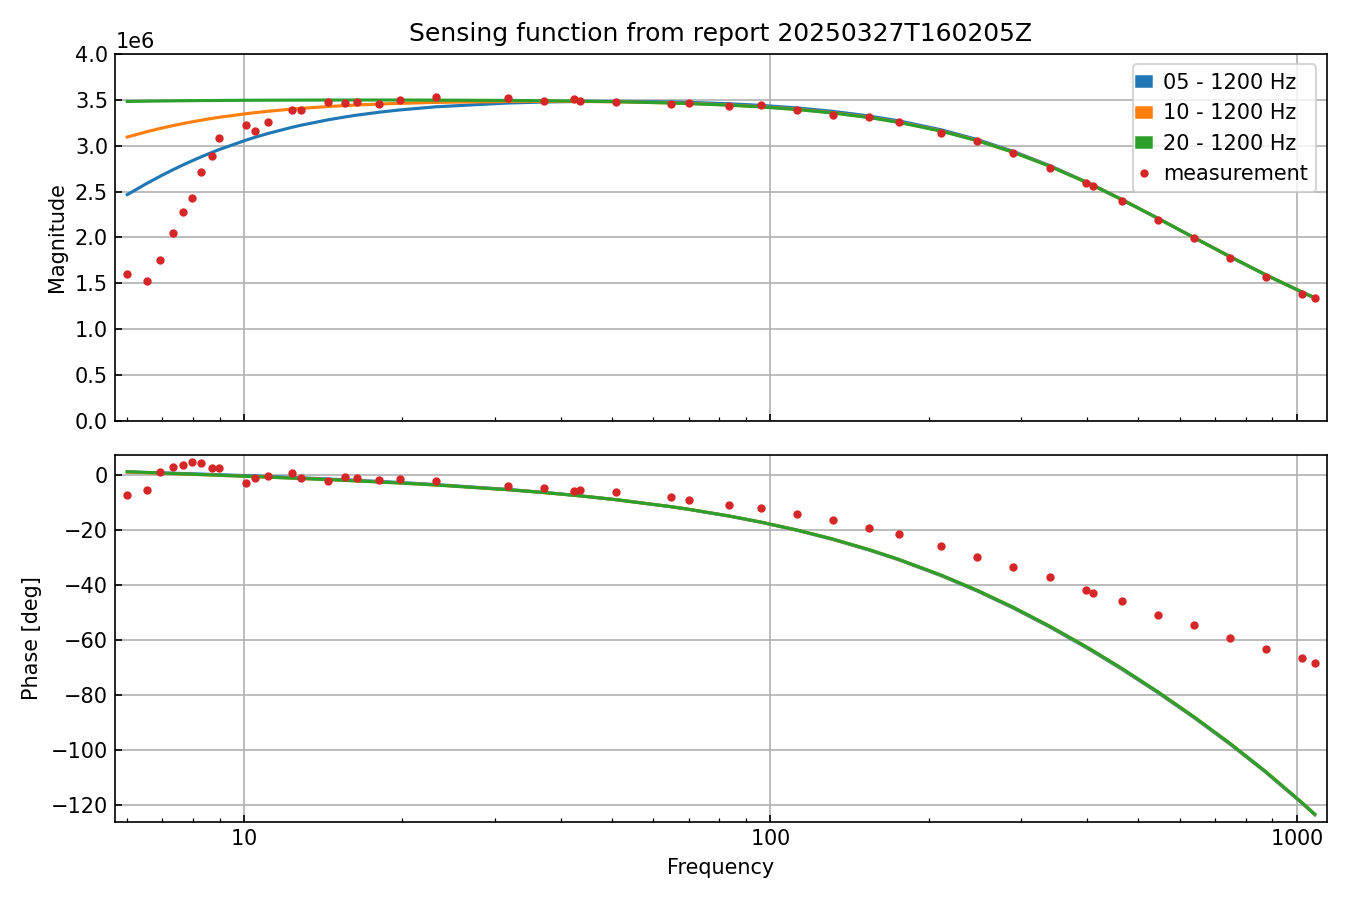
For the residual plots, we see that the magnitude is largest when fitting to 5 Hz, and that the change between the 10 and the 20 Hz fits is negligible. For illustration purposes, I plotted the different sensing models, along with the measurement, together in the last figure (20250327T160205Z_compare_models). The phase plot is not the same as the plots given by pydarm due to missing factors. We see that the three models match above 30 Hz in magnitude.
For the optical spring frequency, we see a decrease from 2.19 Hz to 0.43 Hz when fitting to 10 Hz, and 20 Hz, respectively. This decrease on the SRC spring suggests that the model does not fit the sensing function well, below 20 Hz.
So, regenerating the sensing model shows that the model is good when we see anything above 20 Hz. But we see from the measurement that the SRCL detuning does change the sensing function at low frequencies. The model, however, cannot fit the data from the measurements at these frequencies. We have seen before (80267) that angle to length cross coupling influences the sensing function in the low frequencies. A scenario of cross coupling affecting the sensing function could explain why the model cannot fit the measurement.
Repeating the analysis on cross-coupling, as done in 80267, could improve the sensing function.
TIL; pydarm edition:
The approach that enabled me to regenerate pydarm reports, albeit messy, was to
-
Modify the
pydarm_cmd_H1.yamlthat is in the report to be regenerated, in this case 20250327T160138Z. In particular, themcmc_fminvalue. -
Once the YAML file is configured, run
This command will re-run the calibration report, and, by using the configuration that lives in that directory, make a new model to the sensing function measurement.