M. Todd, C. Compton, S. Dwyer, A. Brooks
As a continuation of the last alog, this is discussing how we can estimate thermal actuator contributions to the surface curvature to the test masses.
Summary:
The dataset used to estimate the ring-heater to surface curvature gain factor contained several ring heater settings and the corresponding HOM spacings at various "positions" in the span of time when that ring-heater power was used. For example, if the ring-heater power was changed and kept the same for 3 months, the HOM spacing data was examined at a random (long-lock time) portion of this 3-month period. This time, I tried to be a bit more systematic, such that we have a dataset with HOM spacing data at the beginning and end of each ring-heater power setting period. This can give us an idea if there are any drifts over time in the HOM spacing or coupling factors of the ring-heater power to surface curvature.
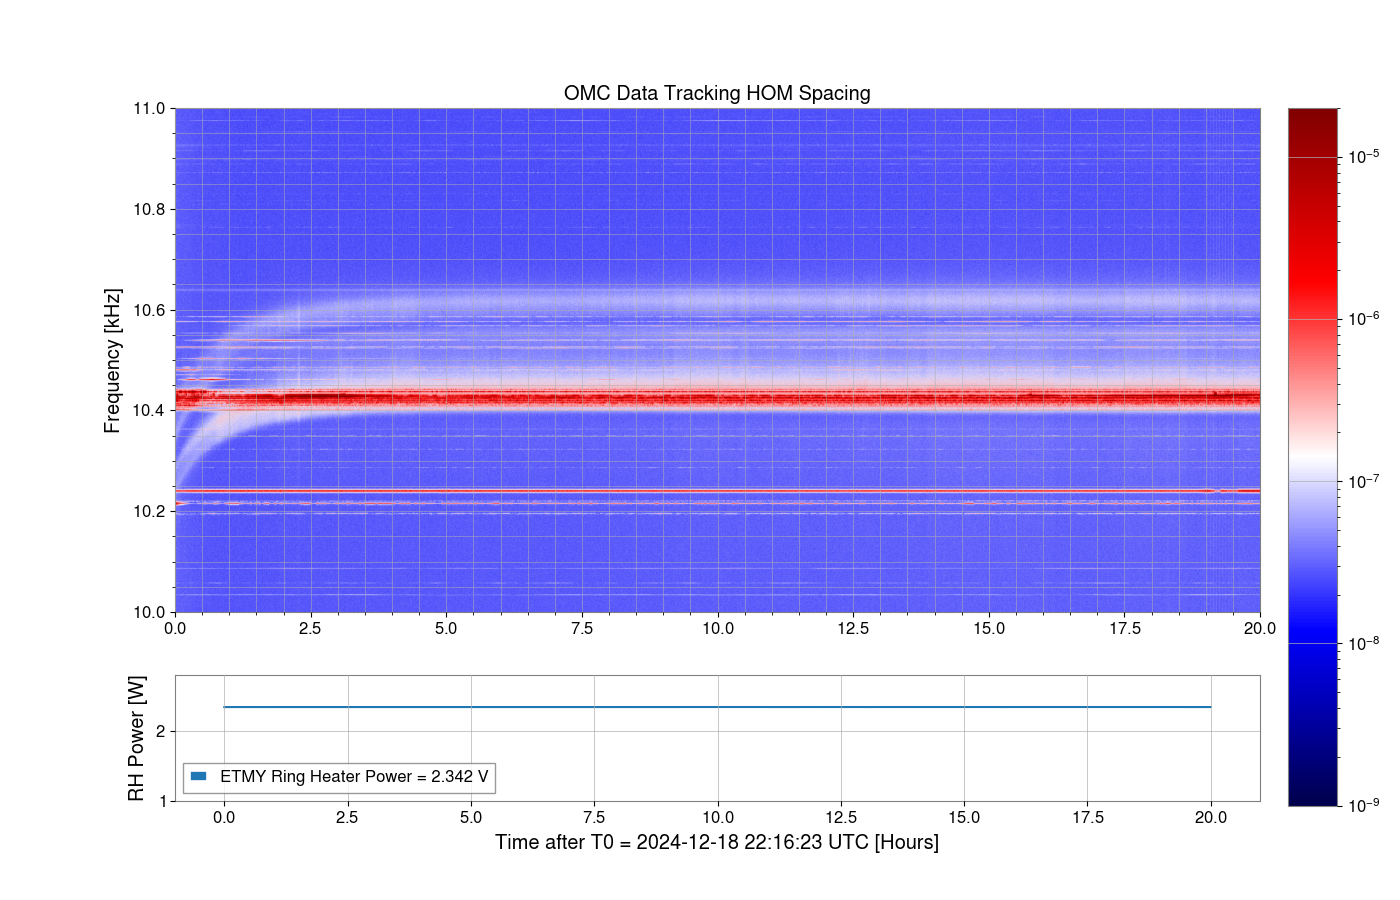
Each HOM spacing data-point is taken from a OMC spectrogram during a lock, and the errorbars associated with each are the spread of that HOM spacing peak.
The estimated ring-heater power to surface curvature gain is .7563 uD/W, which is very similar to the initial estimates done by Aiden; however, this is not the same value as the current one in TCS-SIM, indicating some adjustments may need to be made.
The blue dataset in the plot is data taken at the beginning of a ring-heater power setting period, while the yellow dataset is taken towards the end of the corresponding period. The estimated ring-heater power to surface curvature gain is the same for both datasets, however there is a relatively consistent downward drift over time by a few Hz in the HOM spacing. I'm not sure of the reason for this but it could be due difference in arm powers at each time.
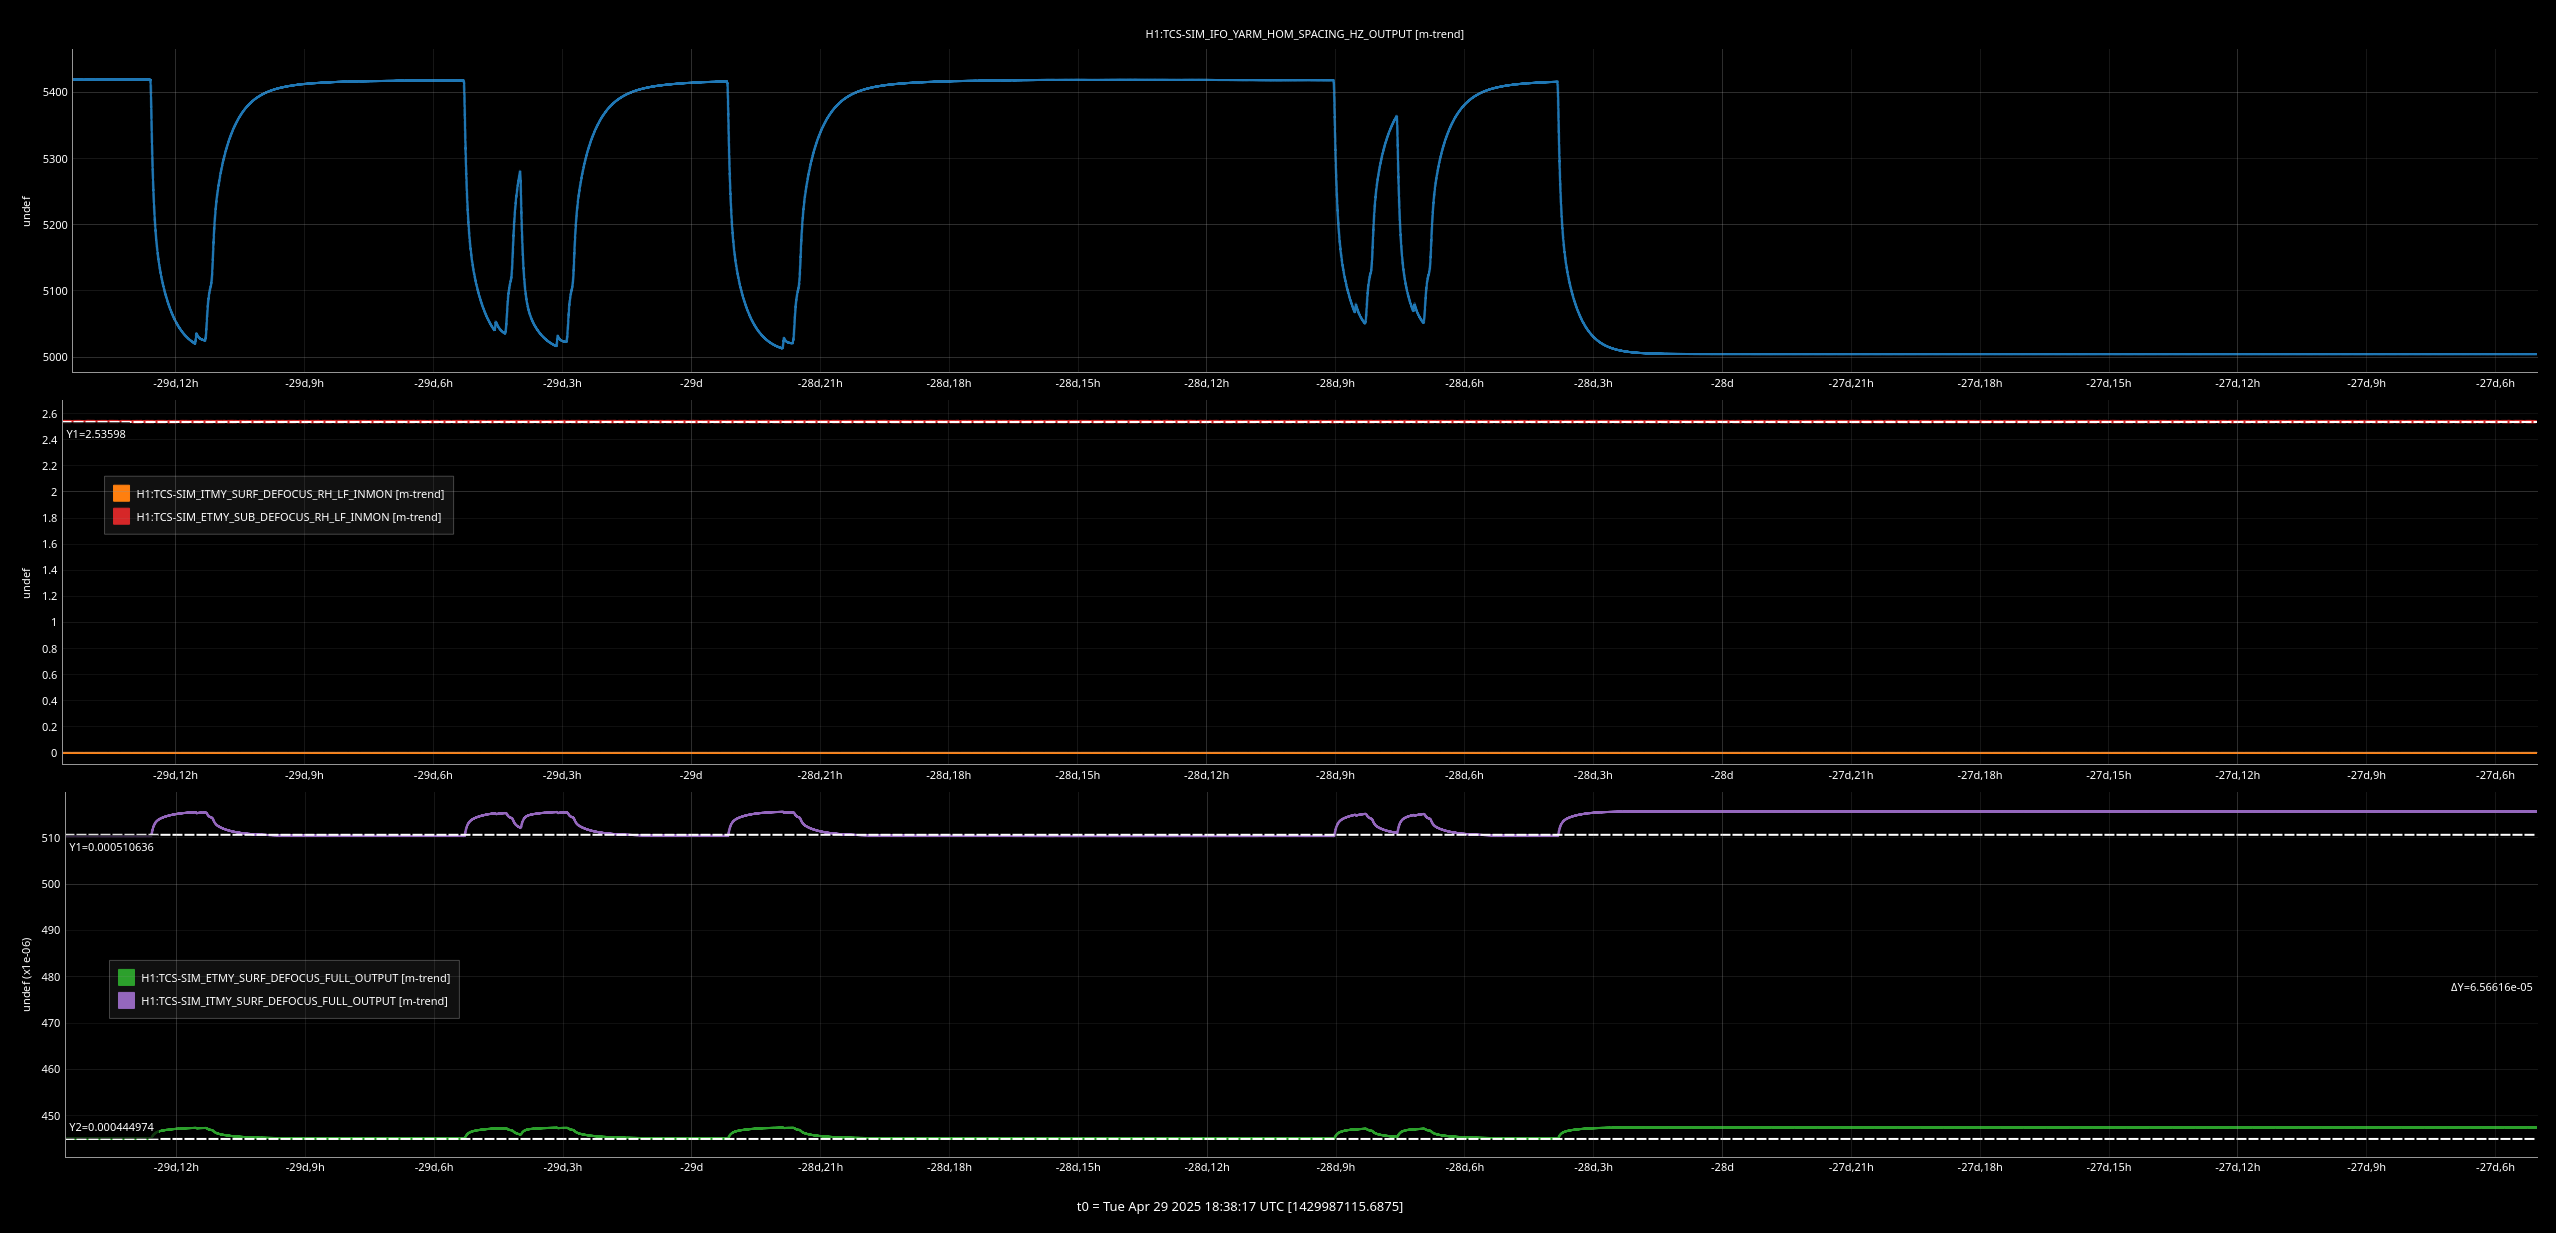
Additionally, we expect the HOM spacing due to self-heating on top of the cold state to be around 5340 Hz, however TCS-SIM projects it to be around 5620 Hz.
Thus we estimate the change in HOM spacing due to self-heating alone to be around 175 Hz, where TCS-SIM projects it to be around 450 Hz. This indicates the gain factor mapping absorbed power to surface curvature change may be to high, or our estimate of the absorbed power is too high. The latter can be estimated from the Hartmann wavefront sensors.