Following the work from yesterday post, 2 questions came up immediately. One, how much does the sensing function change with input power? We can plot it as a function of arms circulating power instead. Second, if the detuning is the same, but at different mode mismatches, do we get the same sensing function?
We can see the answer to the first question in this plot. These sensing functions are normalized to 100 Hz value. The ratio between the highest power and the lowest power sensing functions is plotted (dashed line) as well.
Before answering the second question, let’s look at the following scenario.
We lock the interferometer, get SRCL.DC to be -90.4643, then we change that detuning while locking. What happens to the PDH signal and the sensing function now?
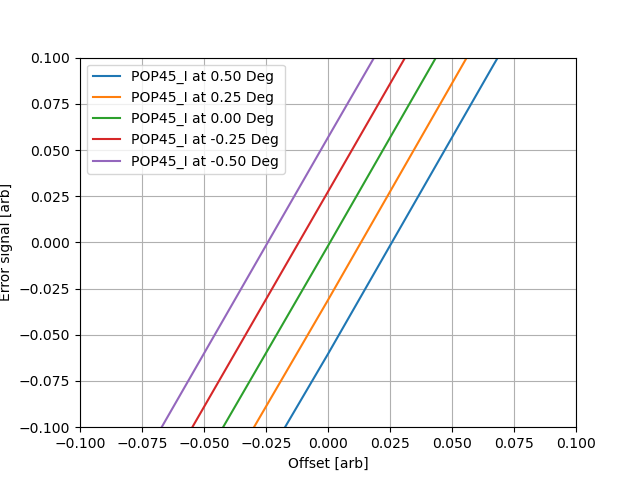
Here I plotted the error signals as I change SRCL.DC detuning by ± 0.5 deg
And the DARM sensing at different detuning looks like this
So, we see that the sensing function significantly changes with detuning at a constant mismatch.
So, from here, let’s answer the 2nd question. What we will do is to change the mismatch then manually offset the detuning to be the same in both cases.
For that I look at 2 cases. The first case is the default case where there is a mismatch between SRC and ARM cavities with SRCL.DC = -90.4643 and I plot the sensing function. Now, when I change the radii of curvature of ITMX and ITMY - I get almost a perfect mode matching - SRCL.DC becomes ~ -90.004. Again, the question is, if I add an offset to make SRCL.DC = -90.4643, would I get the same sensing function as the first case, where SRCL.DC is -90.4643 due to the mismatch.
The answer turns out to be not entirely, but also it depends on the power as well.
So, I looked at 2 cases, the first with input power of 1W, in which both sensing functions are very similar to each other in behaviour (not magnitude). The normalized plot shows that, in addition it shows the ratio between both of them. This is shown in here
The 2nd case is with an input power of 60W. In this case, they are not as similar to each other anymore, though not so different either.
This is shown in here
To conclude the 2nd question: the sensing function is almost the same (depending on the power) at the same detuning regardless of the mismatch (in the low mismatch limit < 2%)