caroline.capuano@LIGO.ORG - posted 10:06, Tuesday 03 June 2025 (84743)
Plotting Displacement of Quadruple Pendulum Stages with Anti-Whitening Filters
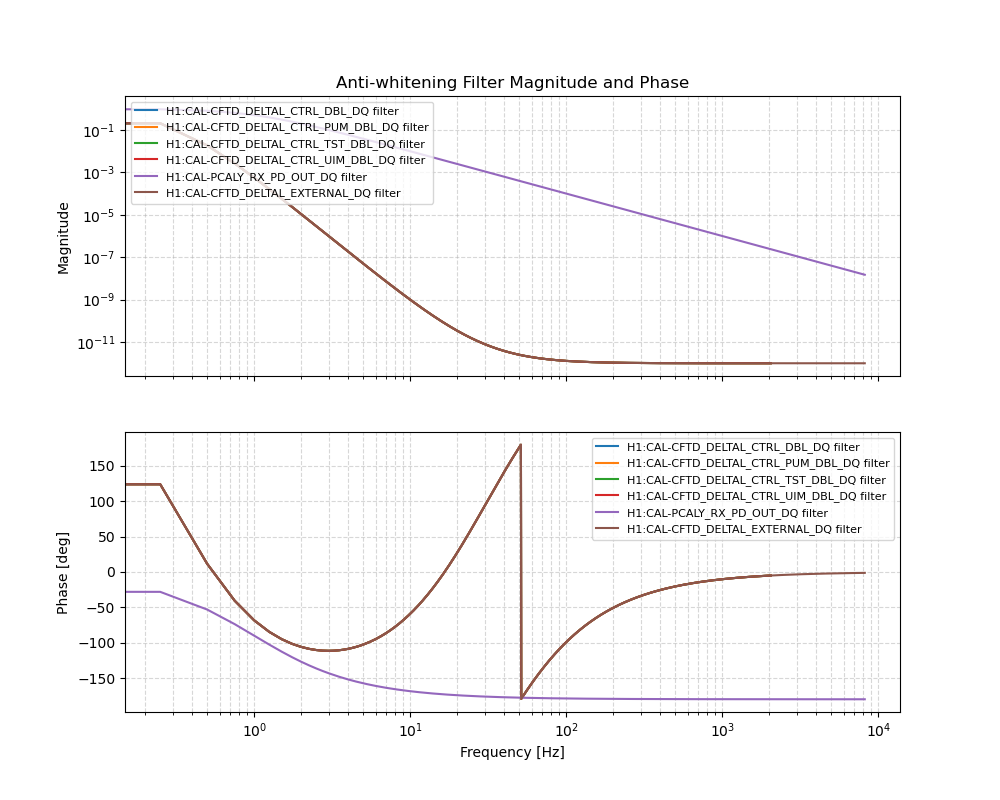
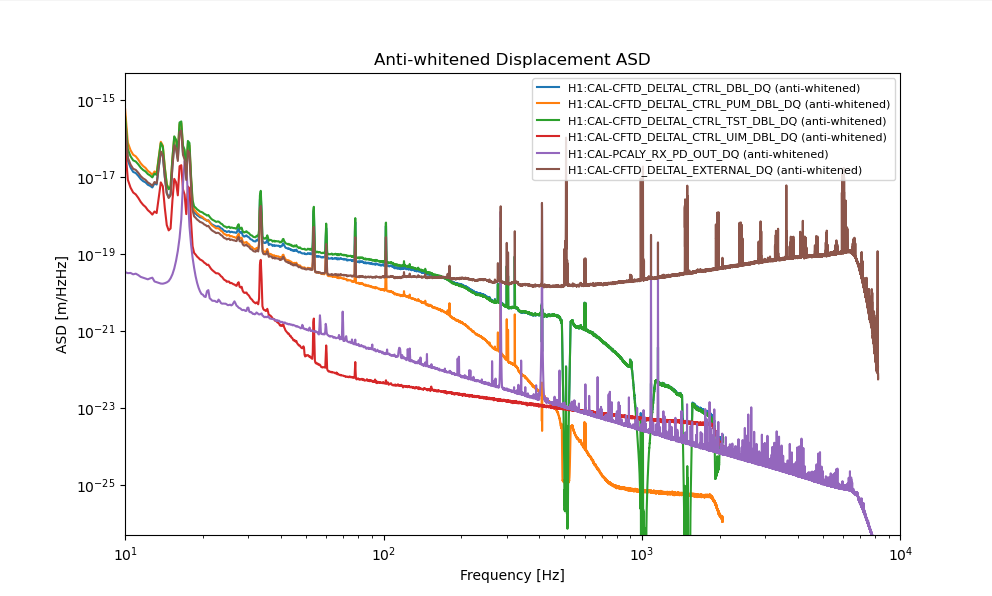
Hello!

I have been working on eventually calculating how much force is being applied to three stages of the quadruple pendulum. The channels I am currently plotting in the figures attached are the DARM control signal (H1:CAL-CFTD_DELTAL_CTRL_DBL_DQ), the penultimate mass control signal (H1:CAL-CFTD_DELTAL_CTRL_PUM_DBL_DQ), the upper intermediate mass control signal (H1:CAL-CFTD_DELTAL_CTRL_UIM_DBL_DQ), the top test mass control signal (H1:CAL-CFTD_DELTAL_CTRL_TST_DBL_DQ), the external excitation signal (H1:CAL-CFTD_DELTAL_EXTERNAL_DQ) and Pcal y (H1:CAL-PCALY_RX_PD_OUT_DQ) - I should include Pcal X next time. By plotting these channels I can map out how much each stage of the quadruple pendulum is moving (or being actuated upon), the Pcal injections, and eventually compare the force needed to control each stage to keep our interferometer locked.

Right now I am plotting the meters per root Hz for each channel. I am also applying an anti-whitening filter so that I can convert the signals from counts back into the physical displacements.

The path to the file to plot these figures is: /ligo/home/caroline.capuano/Force_on_ETMX_for_each_stage/phase_and_mag_of_h.py

All you need to do is run "python phase_and_mag_of_h.py" and it should produce both plots.

Currently I am taking data from LIGO Hanford at the GPS start time of 1425831025 for a duration of 1000 seconds.

There is a weird bump around 100 Hz for the external excitation signal, so Craig suggested I find another time of when we were locked and compare to see if the hump is still present.

To do next:
- figure out what filters to divide by so that I can calculate the force being applied to the three stages aka N/rtHz.
- maybe try quick_psd instead of welch's method and see if that makes a significant difference
Images attached to this report