hugo.paris@LIGO.ORG - posted 17:10, Tuesday 12 November 2013 (8488)
BSC-ISI - WD Plotting Software Updated
CharlesC, JimB, HugoP,
The SEI WD plotting software was updated to the latest version today - r6273.
JimB added the nds2.py library to the python path, and SEI did a little troubleshooting, for it to work. It was tested and it appears fully functional here.
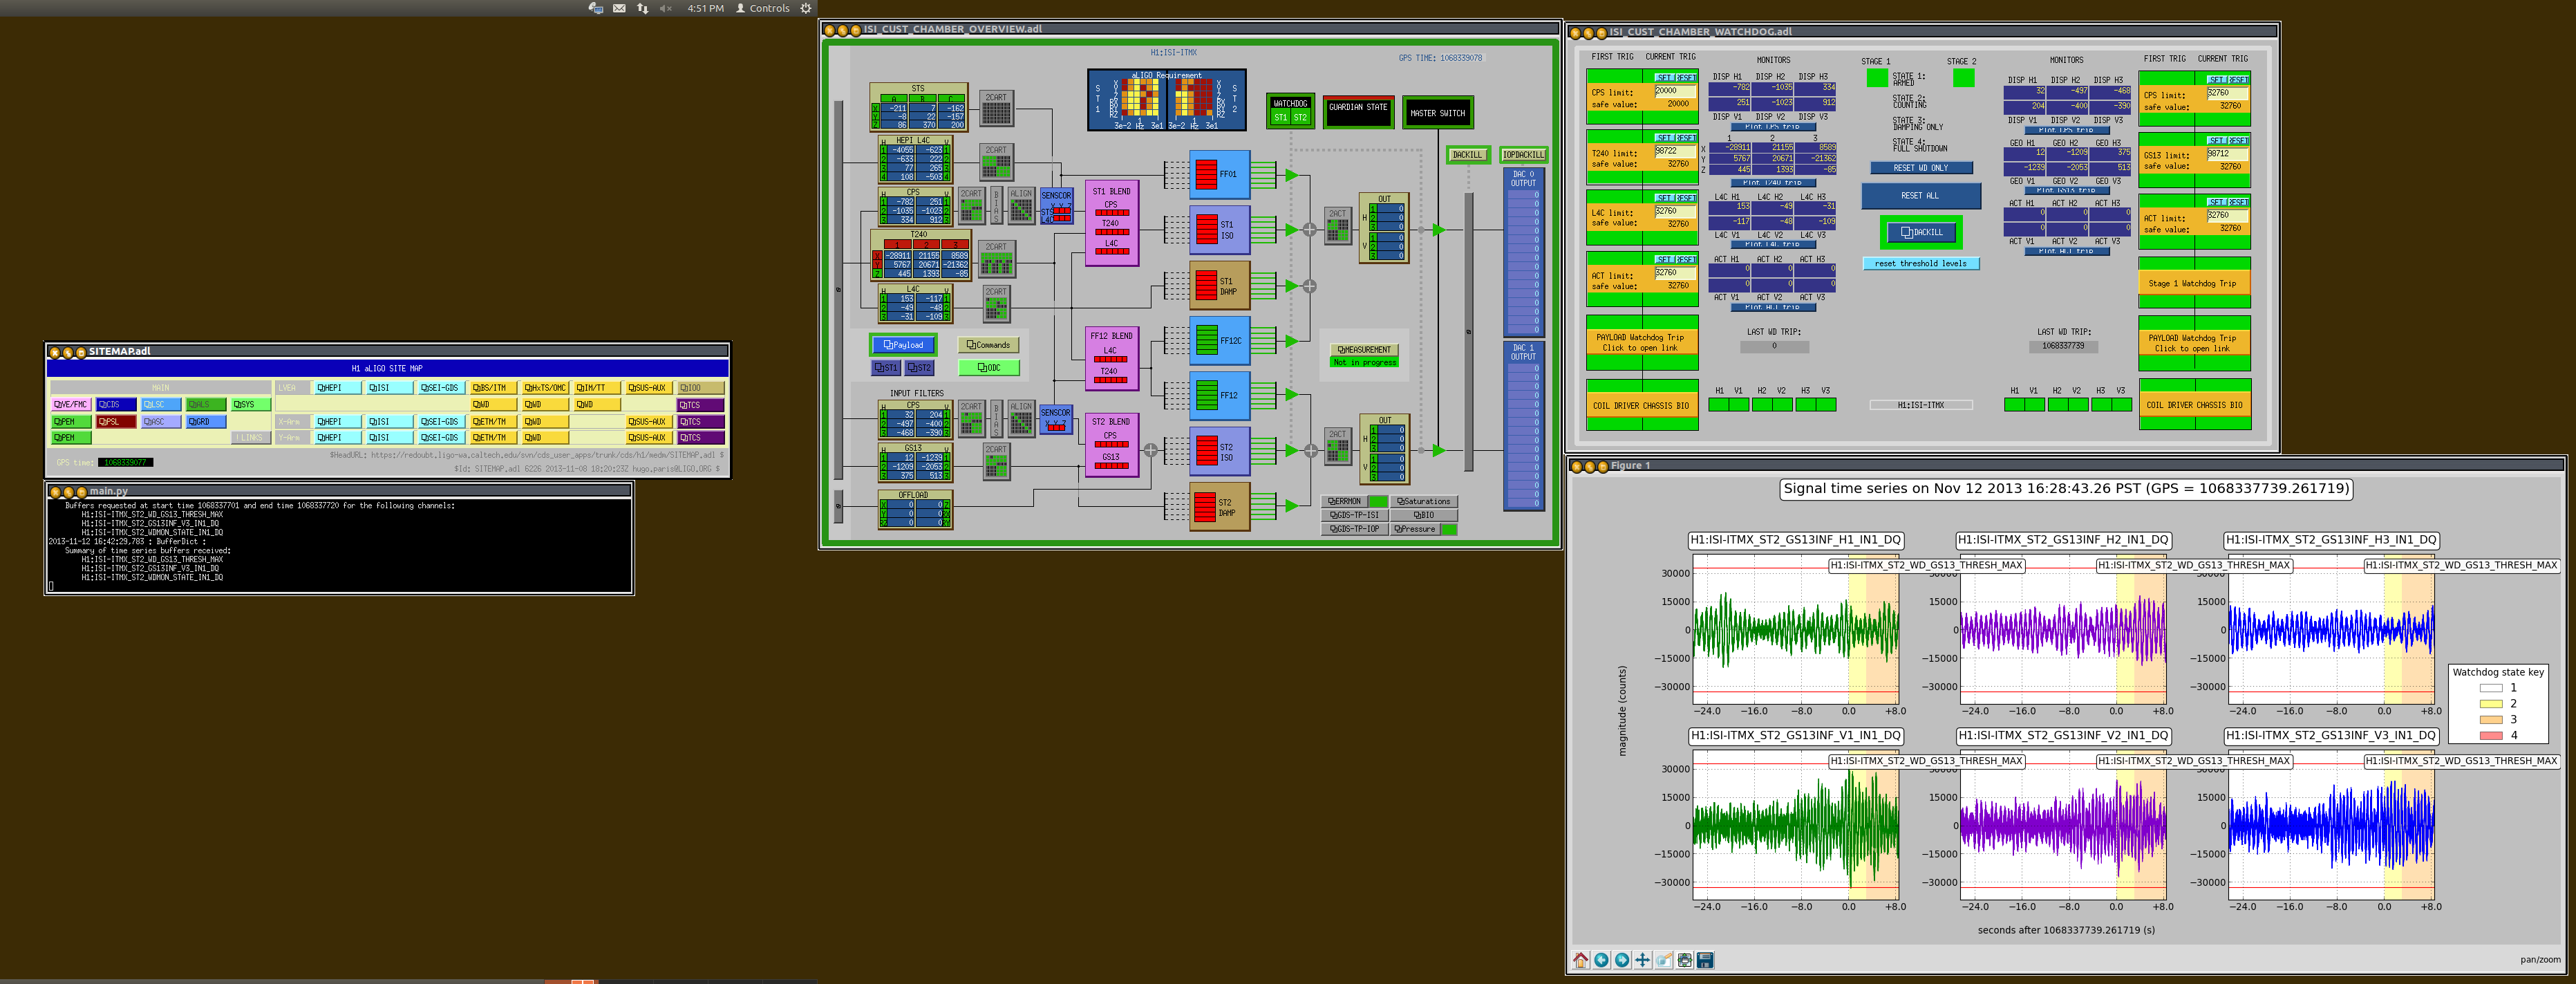
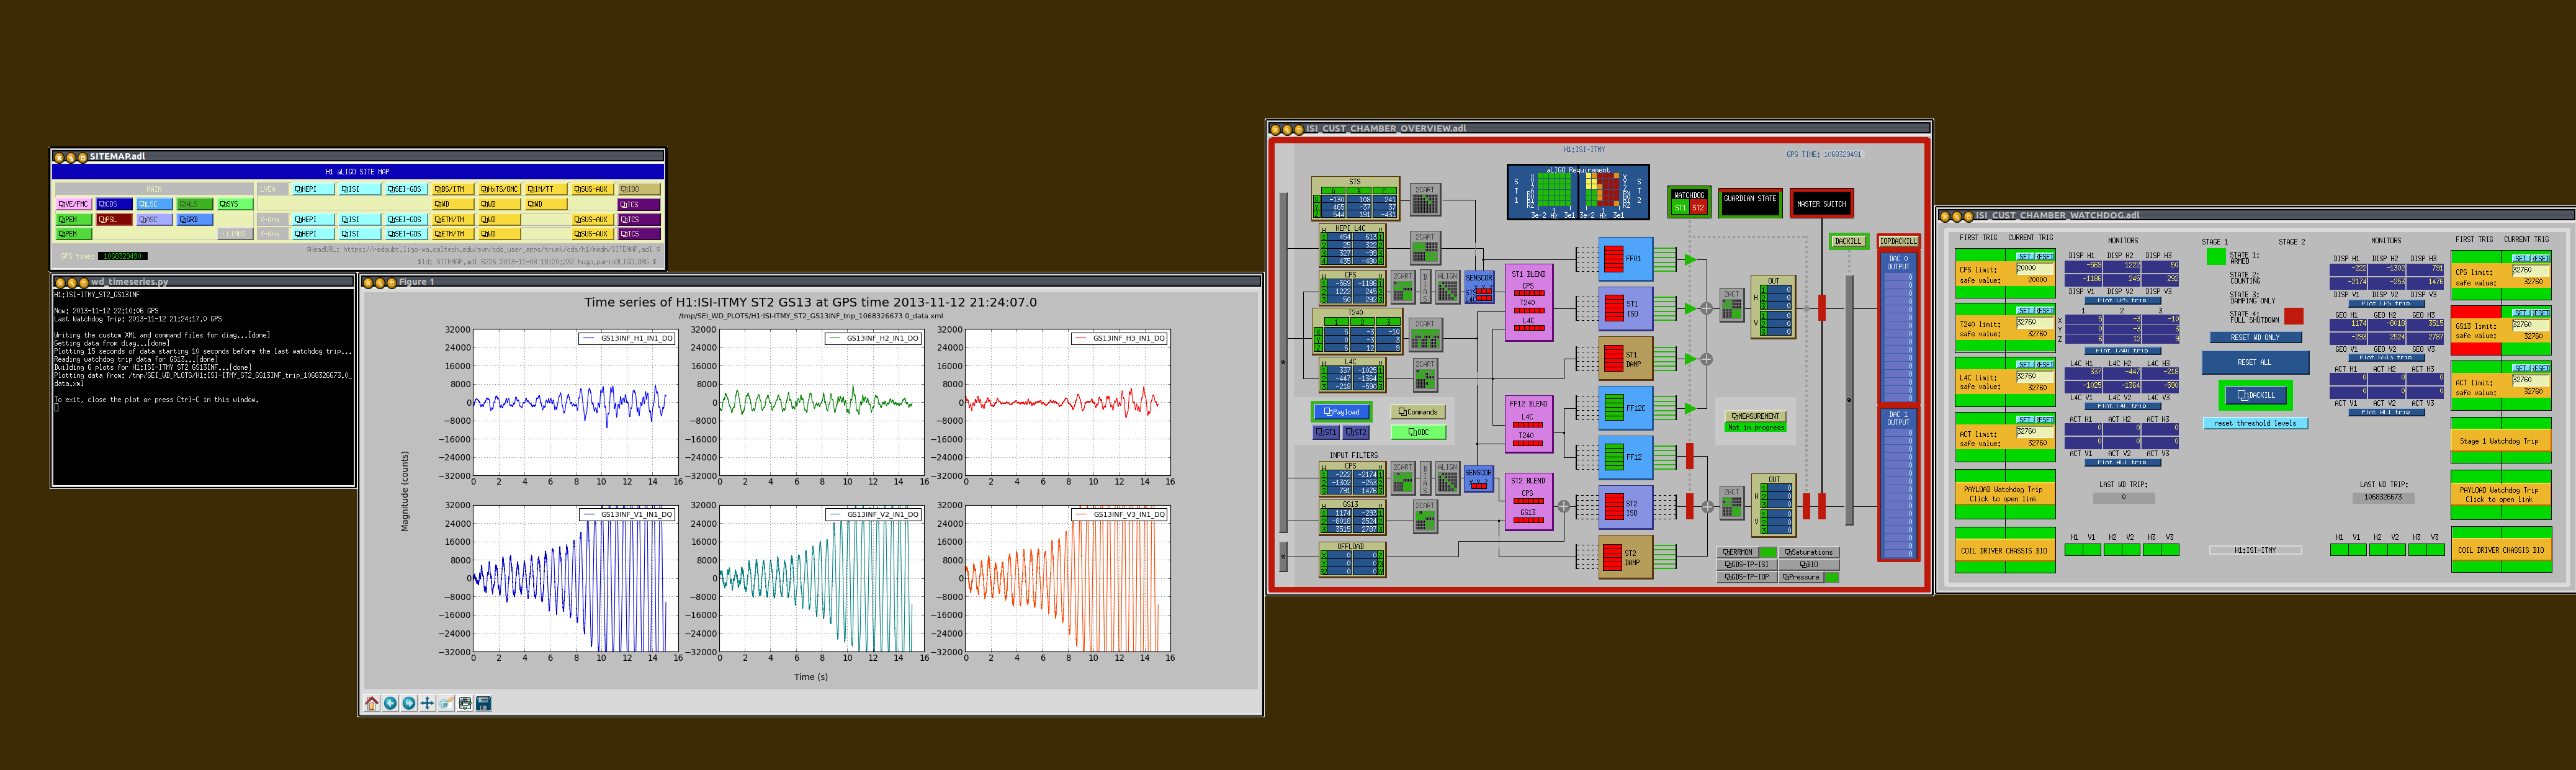
The plots produced by a click on "Plot
- Drag plots (time series) to scroll along time
- WD state shown as background color
- Channel name display when clicking on a curve
- Current WD threshold display (+ and - limits)
This tool is to be used by the operators, and the commissioners, to figure out rapidely why an ISI tripped.
This update was approved in ECR-E1300774.
Work was performed under WP#4262, which is now closed.
Images attached to this report