hugh.radkins@LIGO.ORG - posted 10:04, Thursday 14 November 2013 (8534)
WBSC3-ITMx HEPI Inductive Position Sensor Readings & IAS
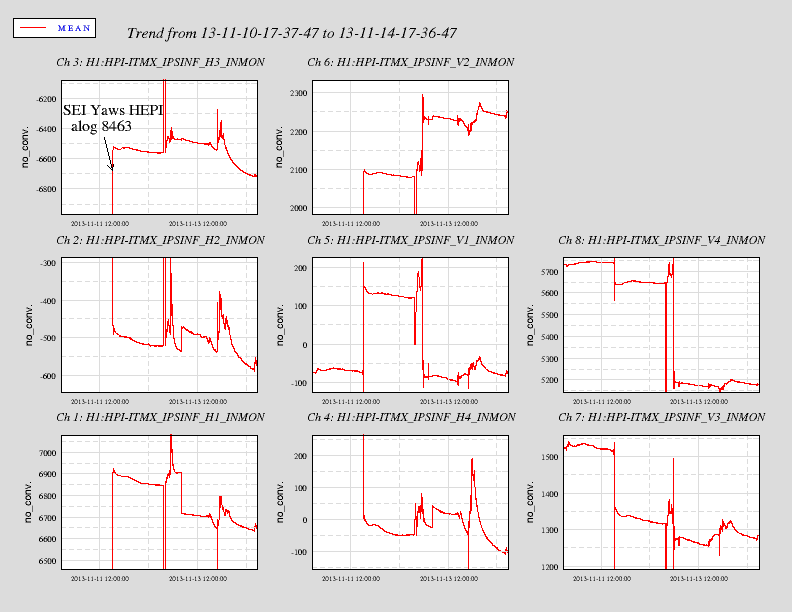
Attached is a 4 day trend plot with the IPS readings at BSC3 during the final alignment on Monday 11 November. Here are the numbers:
| Pier | 1-NW | 2-SW | 3-SE | 4-NE |
| Horz | 6900 | -500 | -6500 | 0 |
| Vert | 100 | 2100 | 1300 | 5600 |
If you look at the plot, you'll see that the readings have drifted since alignment from the table values but things just look to be settling and no shift is larger than 0.001" (655cts/mil). The apparantly large shift (it really isn' that large) on the verticals ~1/2+ way through the plot is maybe the corner cube removal.
Images attached to this report