Jennie W, Sheila, Elenna
In order to get data for mode-matching and for Elenna to get data to calibrate sideband heights we ran some mode scans after the SR3 heater was turned on last night.
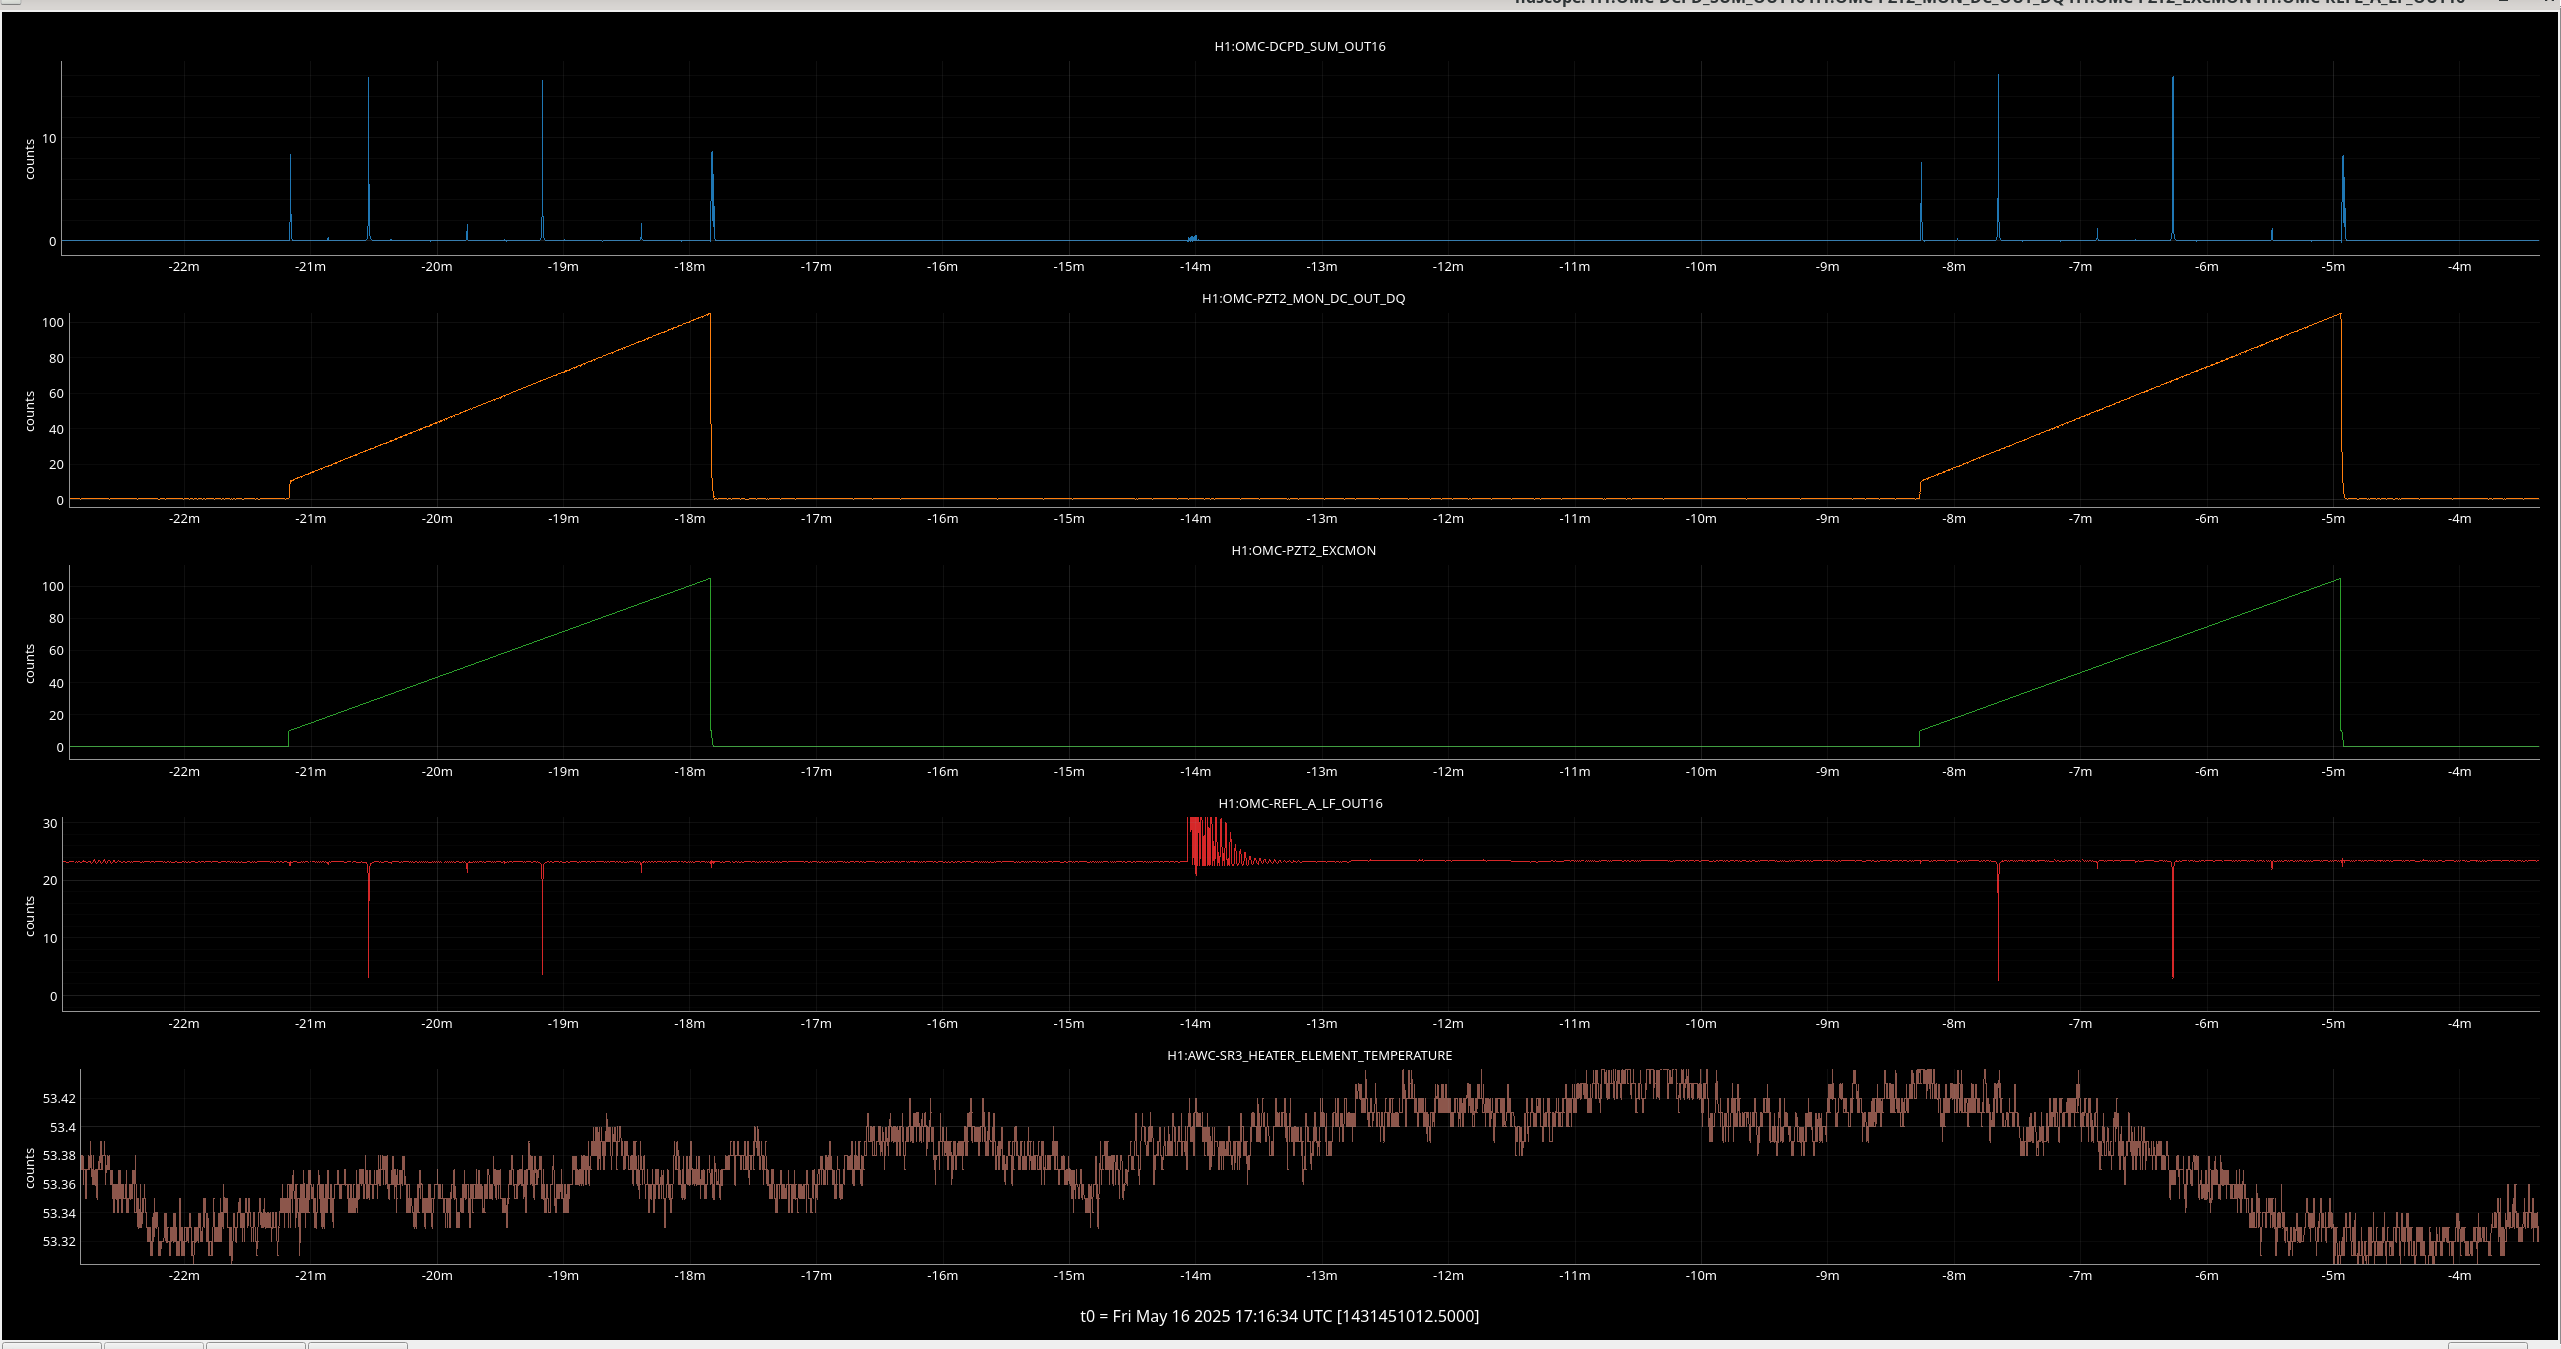
16:55:24 UTC Carried out single bounce OMC scan at 10W PSL input with sensor correction on HAM6 on, high voltage on for PZT driver in HAM6, sidebands off , SRM mis-aligned, ITMY mis-aligned, DC 3 and 4 on, OMC ASC on.
Excitation freq changed to 0.005 Hz as the top peak of the TM00 mode looked squint so could have been saturating. Lowering this frequency prevented this.
Ref 15-17 corresponds to dcpd data, pzt exc signal, pzt2 dc monitor.
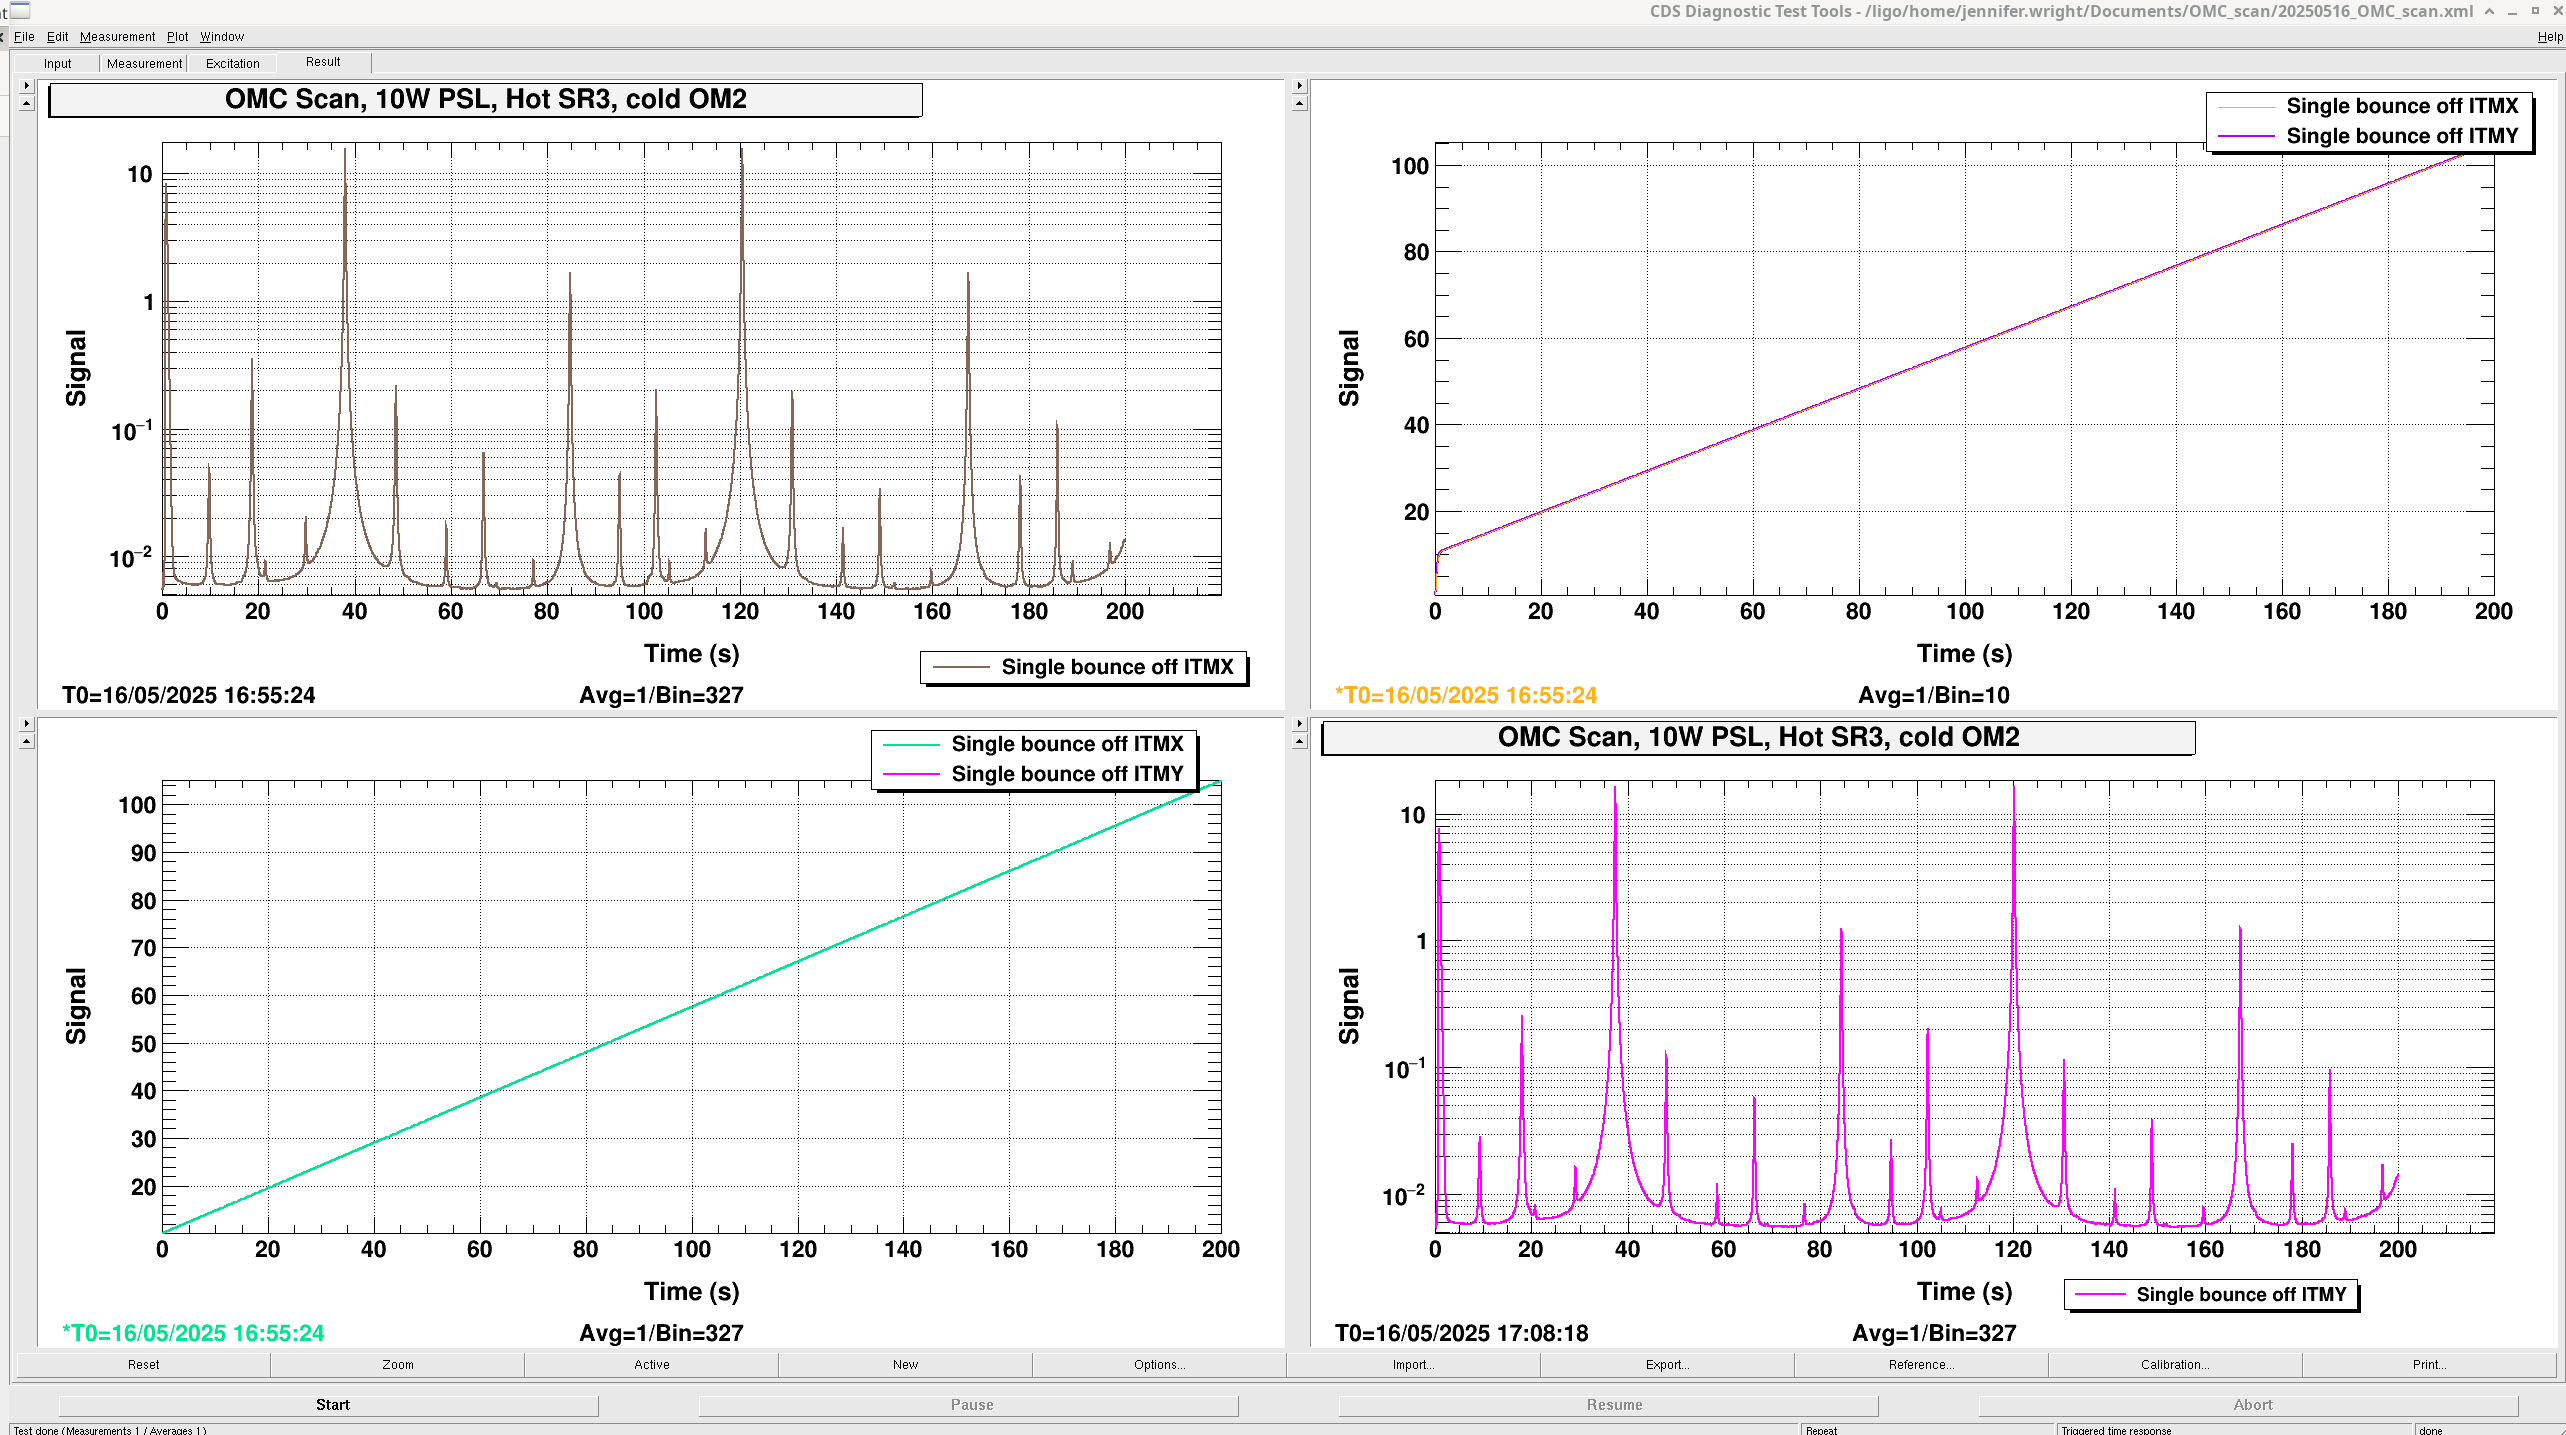
Then mis-aligned ITMX and aligned ITMY (Sheila had to re-align SR2 to centre on ASC-AS_C).
Measurement starts at 17:08:18 UTC.
Ref 18-20 corresponds to dcpd data, pzt exc signal, pzt2 dc monitor.
Traces saved in 20250516_OMC_scan.xml. The top left plot is the first scan bouncing beam off ITMX, the second scan is the bottom right bouncing off ITMY.
The top right is the two plots of the PZT2 DC voltage monitor. That is, the current voltage applied to the PZT. The bottom left is the plot of the voltage ramp applied to the PZT2 on the OMC for this measurement.
The ndscope attached shows the power in mA transmitted through the OMC on the top, then the PZT used for the scan DC voltage underneath, then the input PZT voltage underneath that, then the reflected power from the OMC in mW, then at the bottom the SR3 heater element temperature in degrees.
Elenna did two more scans in single bounce with sidebands back on and different modulations depths in each.
See Elenna's comment on her previous measurement where this saturation happened.
Turn off the sidebands - instructions in this alog.
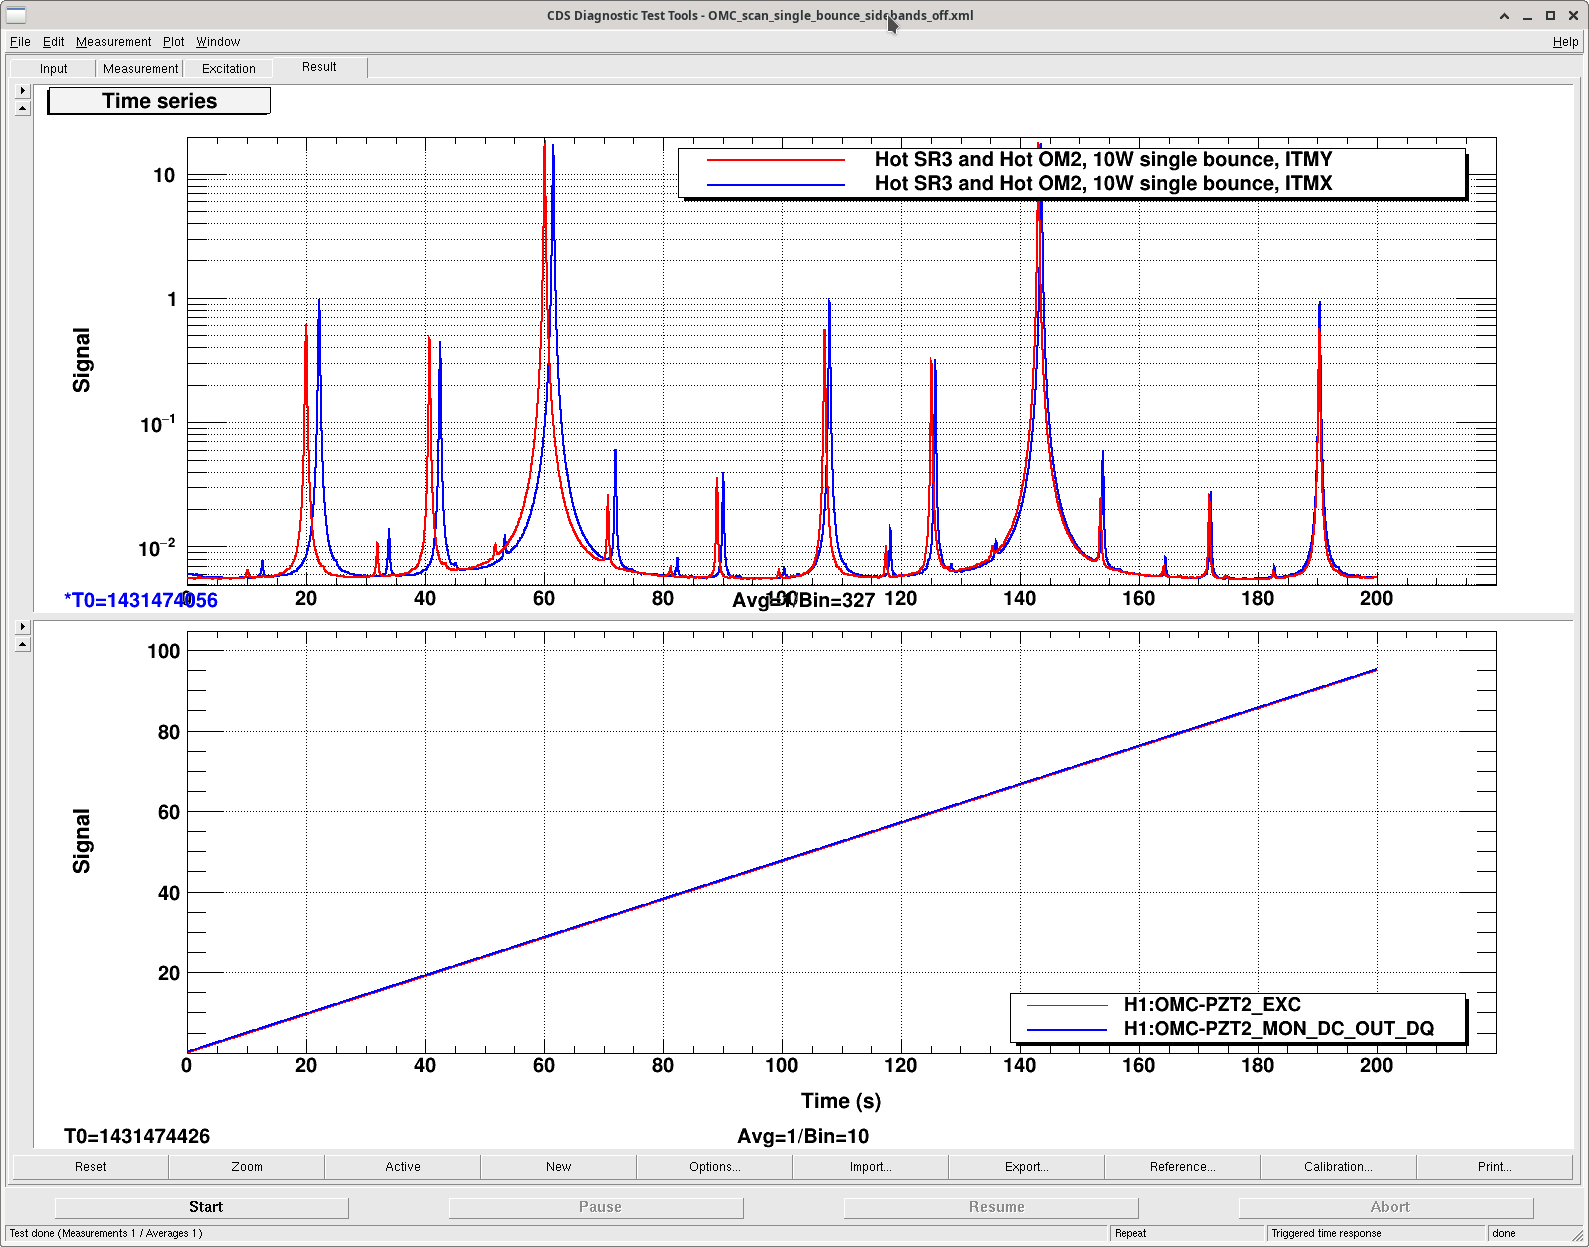
Sheila and I ran one more OMC scan with sidebands off after OM2 heated up. Attached is the screenshot with scans off both ITMX and ITMY, data is saved in [userapp]/omc/h1/templates/OMC_scan_single_bounce_sidebands_off.xml
I also ran two OMC scans, single bounce off ITMY, 10 W input, with the sidebands ON. One measurement I ran with the sidebands set to 23 dBm and 27 dBm (9 and 45 MHz) and another set to 20 dBm and 21 dBm (9 and 45 MHz). I will use these measurements to calibrate the modulation depth. Data saved in /opt/rtcds/userapps/release/omc/h1/templates/OMC_scan_single_bounce_RF_cal.xml
SR3 heater was on for this measurement but it should have little effect on my results.
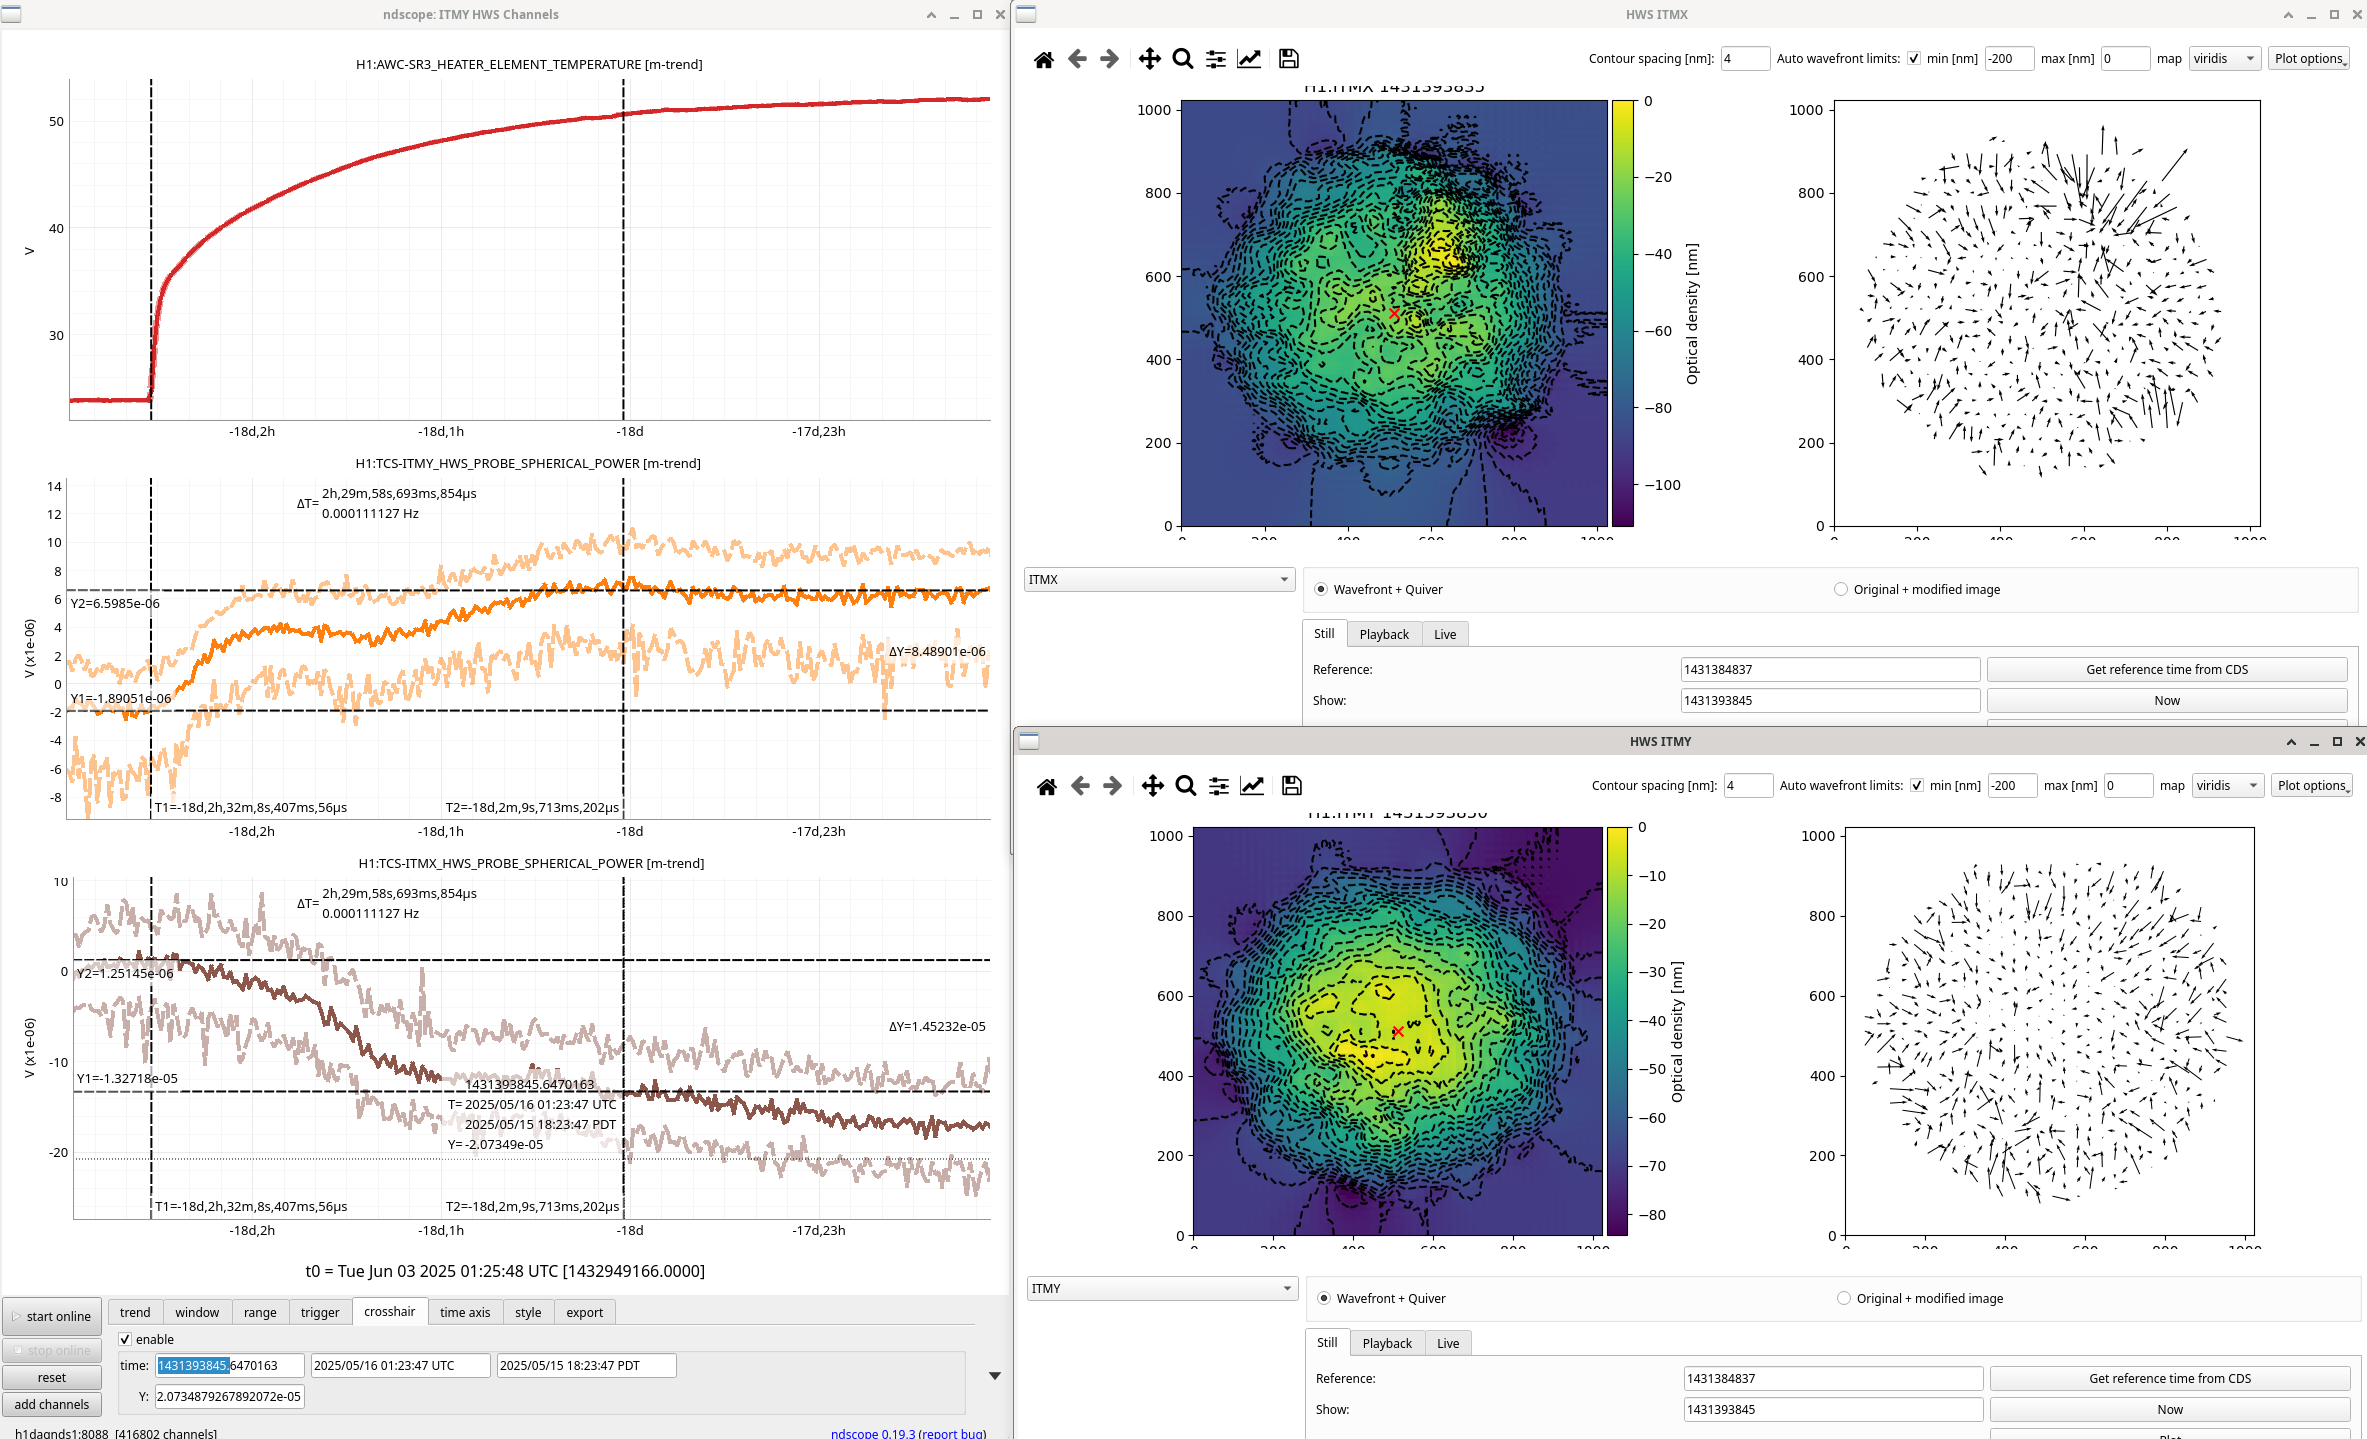
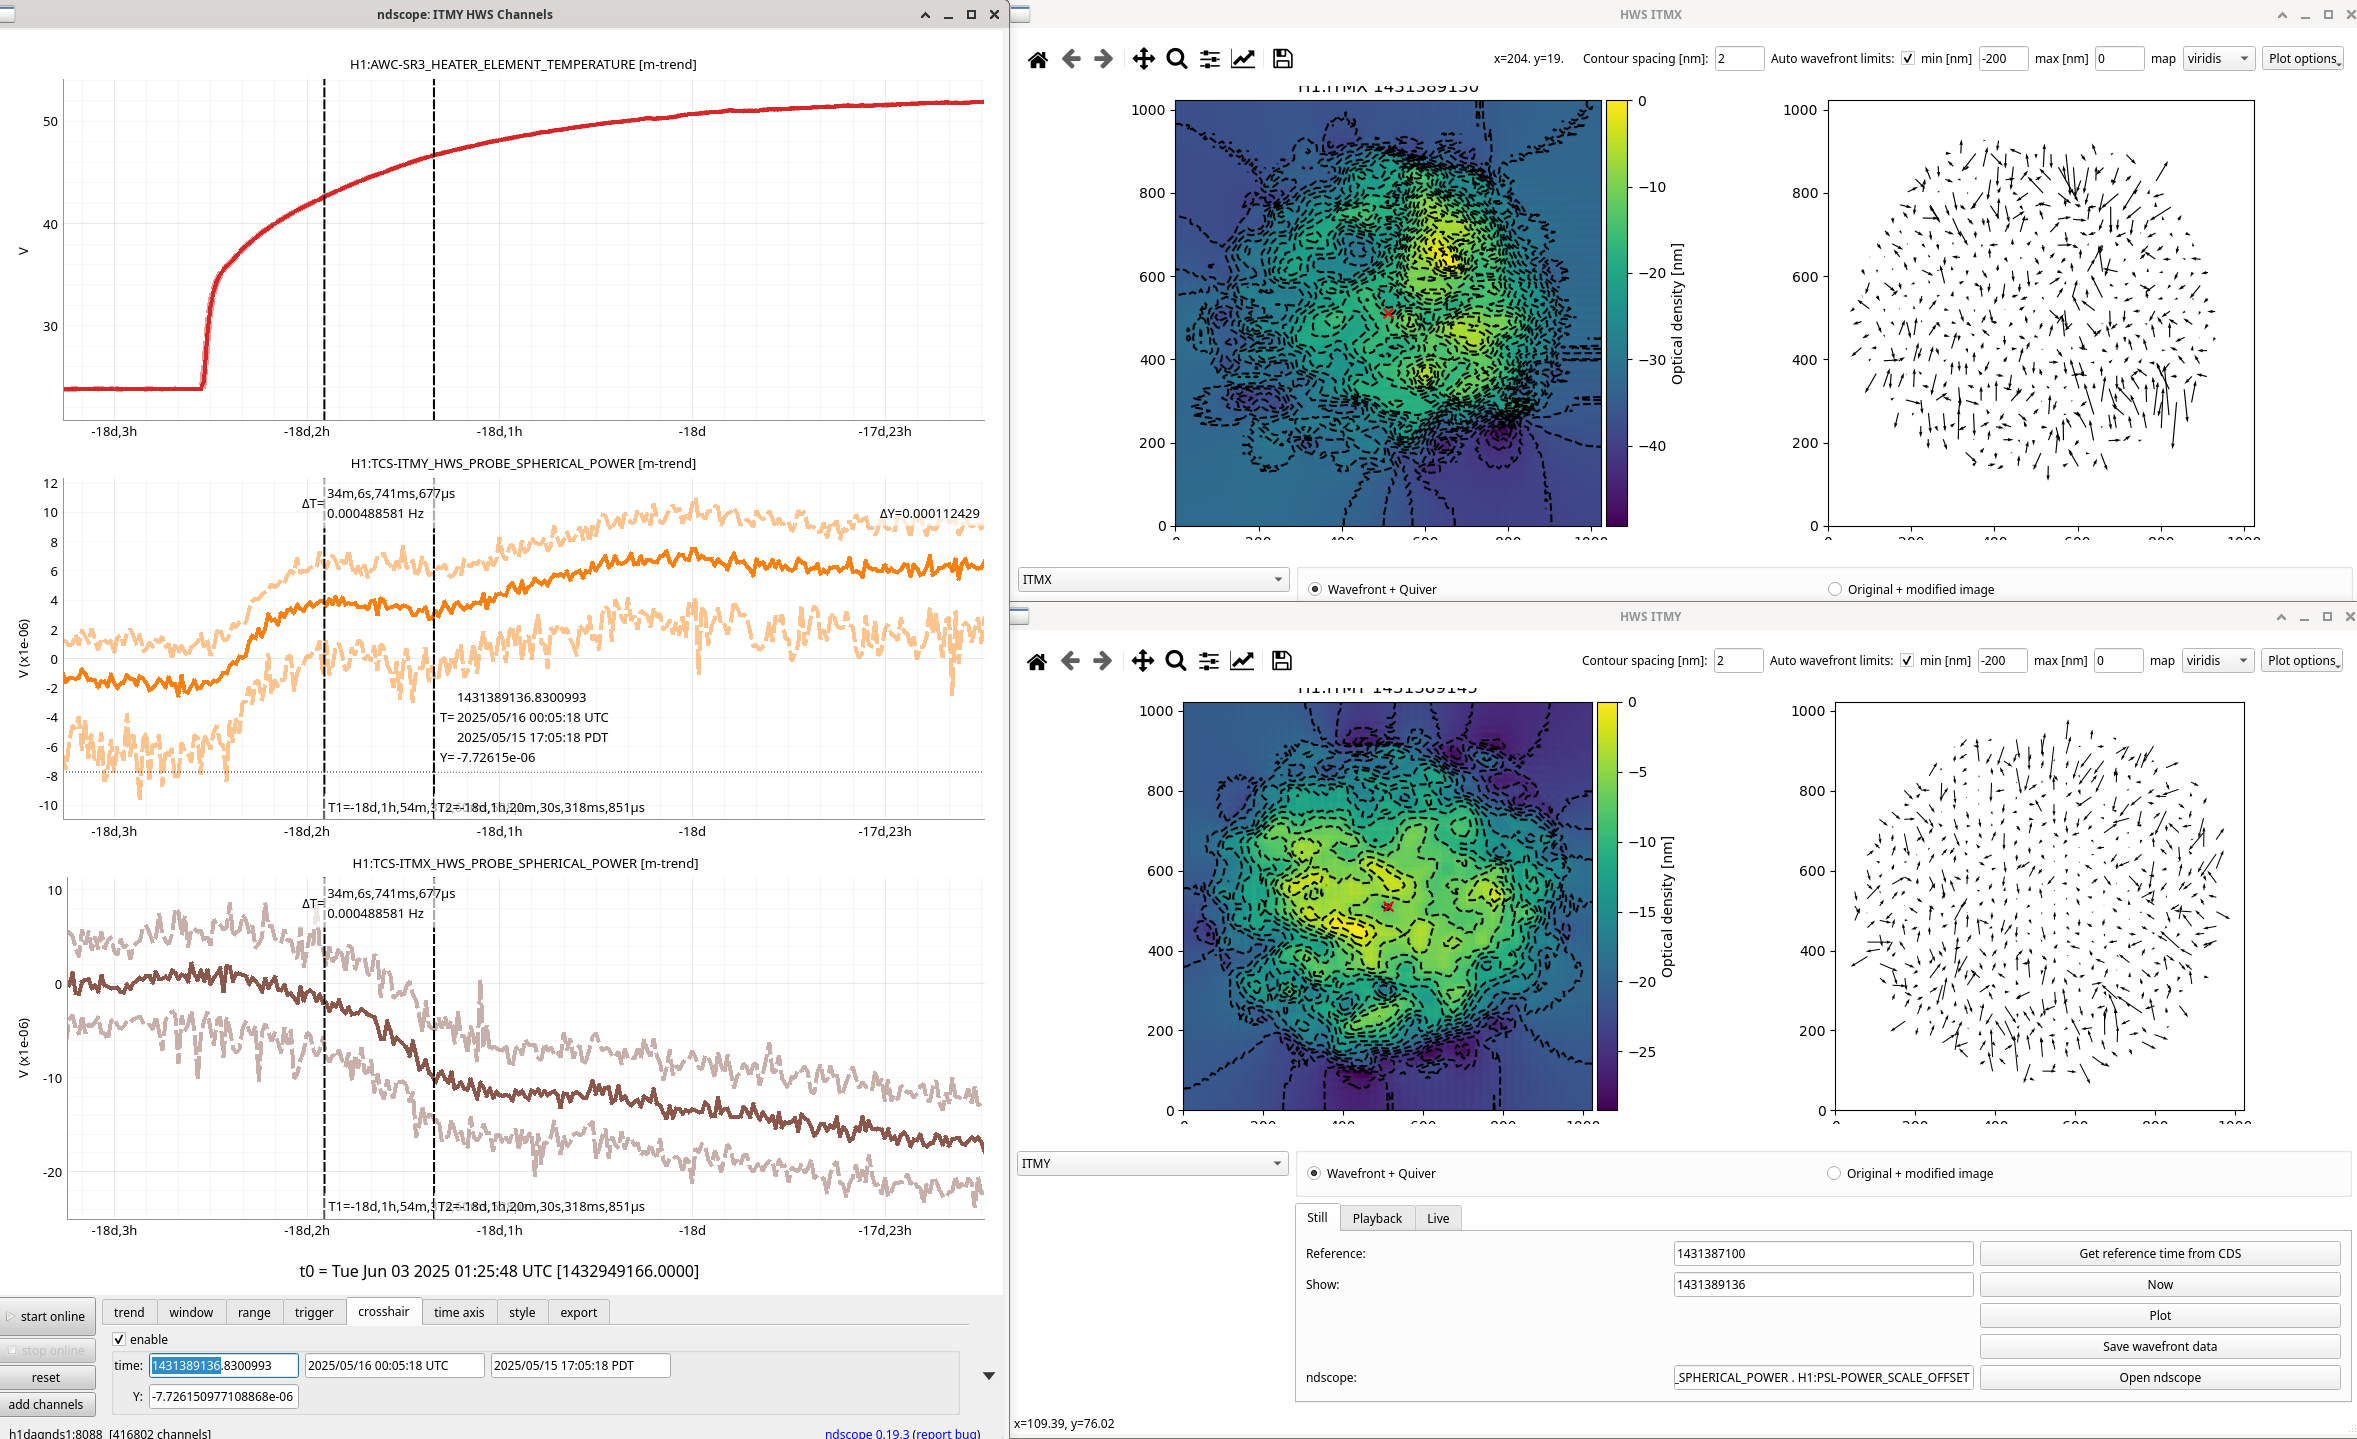
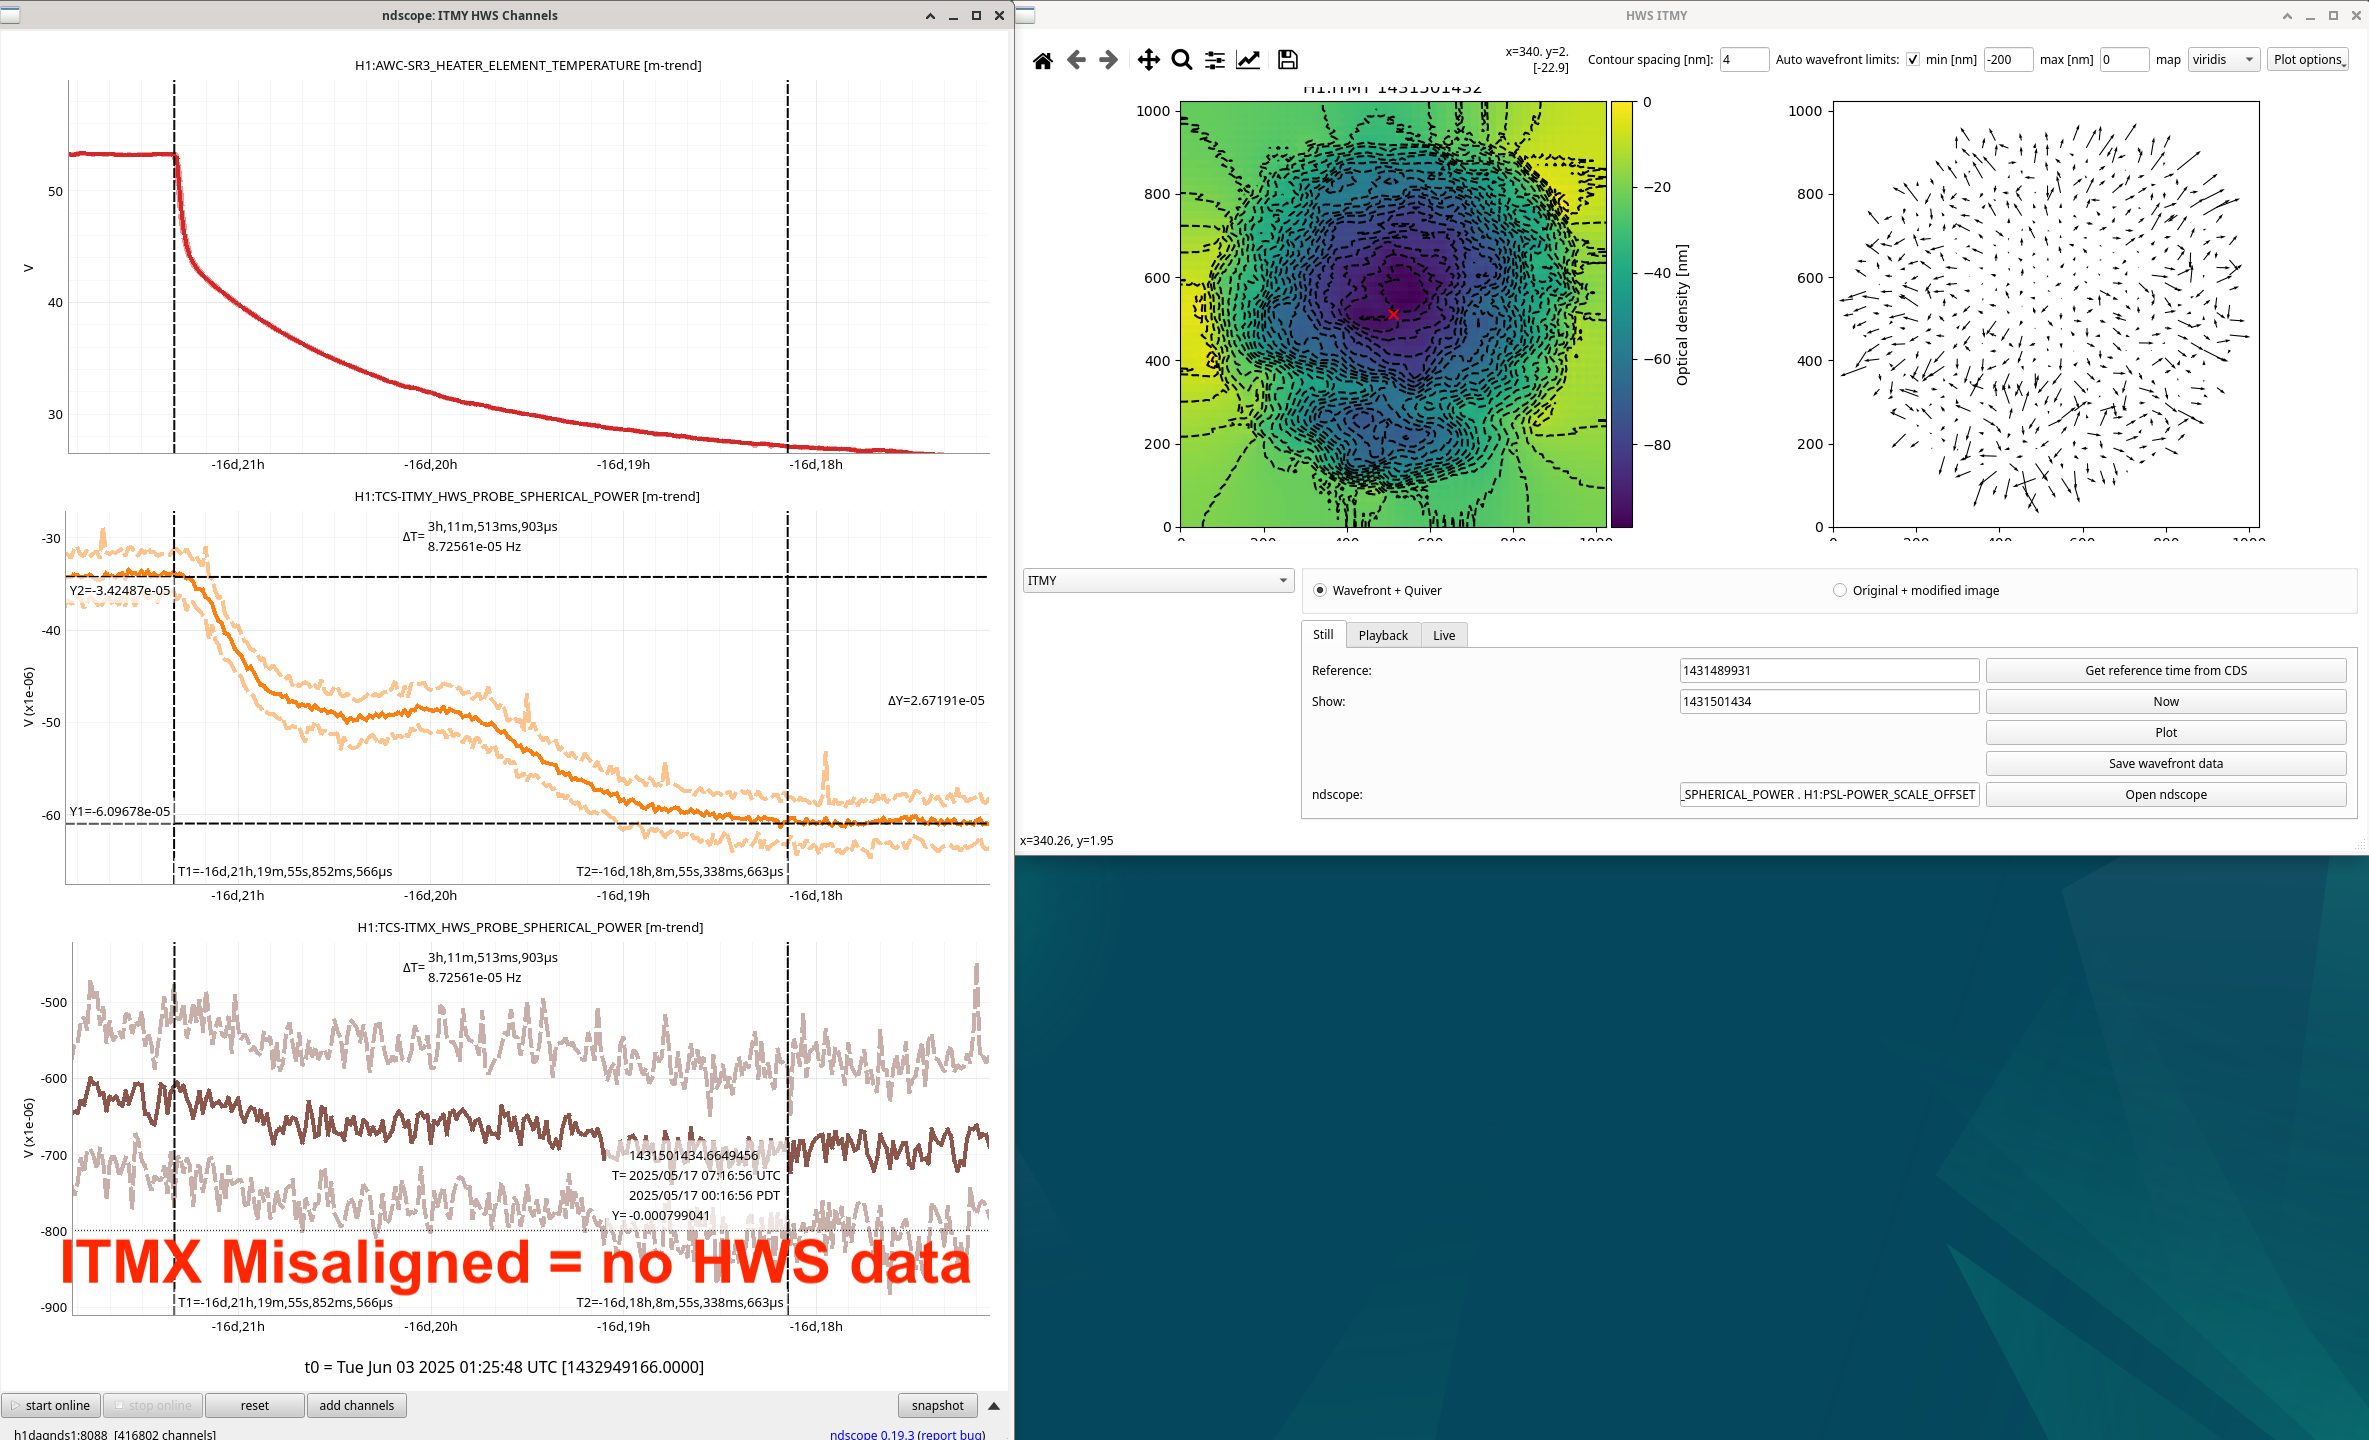
Looked closer at these HWS signals during SR3 heater heat up and cool down. In all these plots, the two t-cursors are used as the reference and shown HWS live image.
Some strange things:
- ITMX heat up ndscope spherical power looks the opposite direction of ITMY, this isn't physical. Looking at the HWS Live plot, this isn't really want's happening, it appears that the SR3 signal just appears if the edge of ITMX is heating up so the center that the calculations are made from isn't correct, making the calculated spherical power wrong.
- In both the heat up and cool down of the ITMY signal, there appears to be two steps with a flat region in the middle. Looking at the the flat region only, attached, it appears that the spherical power is continuing to change in the expected direction, unsure why this change isn't shown in the calculated spherical power.
Finally got round to fitting the two single bounce mode scans done with SR3 hot and OM2 cold. The first we had ITMX aligned, the second we switched to ITMY aligned.
These can currently be processed using OMCscan.py in the /dev branch for the labutils/omcscan repository at /ligo/gitcommon/labutils/omc_scan, you need to have activated the labutils conda environment to do so.
The call statements for the data processing are:
python OMCscan.py 1431449762 130 "1st 1431449762 - SR3 hot, 10W PSL, ITMY mis-aligned" "single bounce" -s -v -o 2 -m
python OMCscan.py 1431450536 140 "2nd 1431450536 - SR3 hot, 10W PSL, ITMX mis-aligned" "single bounce" -s --verbose -m -o 2
For each measurement the tag -s specifices that the sidebands were not on and so in order to calibrate the PZT the code uses the two TM00 modes and then you have to tell it in what height order the 10 and 20 modes appear relative to the highest peak which will be one of the 00 modes.
def identify_C02(self):
"""If in single bounce configuration, and with sidebands off,
identify 10 and 20 modes in order to improve fit.
Assumes that
OMCscan.identify_peaks()
and
OMCscan.identify_carrier_00_peaks()
have already been run.
Output:
-------
self.peak_dict: dictionary
first set of keys are carrier, 45 upper, 45 lower
second set of keys are TEM mode, e.g. "00", "01", "20", etc.
third set of keys is the fsr number
"""
# Create temporary dictionary to combine into self.peak_dict
peak_dict = {}
peak_dict["carrier"] = {"10": {}, "20": {}}
#print(peak_dict)
nn = [2, 1]
mm = 0
#freq_diff = np.empty(np.size(self.peak_frequencies)) not sure why this line here.
#set frequency to be that of third largest peak.
first_order = np.argsort(self.peak_heights)[-4]#-4 for second meas.
second_order = np.argsort(self.peak_heights)[-3]#change index to match where 20 is in terfirst meas if measuring from start of scan.ms of peak height.
#print(third_larg)
for ii, peak_freq in enumerate(self.peak_frequencies):
if peak_freq == self.peak_frequencies[second_order]:
#print("found C02")
#print(f"List fields in IFO {self.fields_MHz}")
#print(type(self.fields_MHz))
#print(f"OMC HOM spacing {self.omc_hom} MHz")
#print(type(self.omc_hom))
field = f"carrier"
#print(f"mode {field}{nn[0]}{mm}")
peak_dict[field]["20"][-1] = {
"height": self.peak_heights[ii],
"voltage": self.peak_pzt_voltages[ii],
"frequency": self.peak_frequencies[ii],
"true_frequency": np.mod((self.fields_MHz - (nn[0] + mm) * self.omc_hom), self.omc_fsr),
"label": r"$c_{20}$",
}
self.peak_ided[ii] = 1
elif peak_freq == self.peak_frequencies[first_order]:
field = f"carrier"
peak_dict[field]["10"][-1] = {
"height": self.peak_heights[ii],
"voltage": self.peak_pzt_voltages[ii],
"frequency": self.peak_frequencies[ii],
"true_frequency": np.mod((self.fields_MHz - (nn[1] + mm) * self.omc_hom), self.omc_fsr),
"label": r"$c_{10}$",
}
self.peak_ided[ii] = 1
else:
continue
# Merge dictionaries
#if not "20" in peak_dict["carrier"].keys():
self.peak_dict["carrier"] = {**self.peak_dict["carrier"], **peak_dict["carrier"]}
#print(self.peak_dict)
#print(self.peak_ided)
return
For both measurements I only took slightly over 1 FSR of the data, this is because in order to fit a polynomial to the known peaks (allowing us to calculate the PZT non-linearity), the code assumes the 1st order is the 3rd highest and 2nd order is the 4th highest. In the code above you need to change the indexes in the below lines to match the height order of the peaks (ie. and index of -4 is fourth highest peak).
first_order = np.argsort(self.peak_heights)[-4]
second_order = np.argsort(self.peak_heights)[-3]
When the mode-matching is bad this may not be true, also if there are multiple FSRs in the scan this also may not be true.
First measurement 1st order mode is fifth highest, 2nd order mode is third highest. The scan is here. I took 130 s of data. The PZT fit is here.
Second measurement the 1st order mode was the 4th highest, 2nd order mode was the third highest. The scan is here. I took 140s of the scan data. The PZT fit is here.

First measurement has
1.69/(1.69+15.86) = 9.63 % mode mis-match.
Second measurement has
1.25*100/(1.25 + 16.46) = 7.06 % mode mis-match
I also analysed the single bounce measurements Elenna and Sheila made after OM2 was heated up. So these have both SR3 and OM2 hot.
For both these measurements C02 was the third highest mode and C01 was the fourth highest. I took 120s starting 45s into the scan.
Measurement 1: 23:40:38 UTC on 2025/05/16 with ITMX aligned and ITMY mis-aligned.
See the spectrum with labelled peaks here.
And the PZT calibration here.
Mode mis-match is:
0.93/( 0.93 + 17.29 ) = 5.10 %
Measurement 2: 23:46:48 UTC on 2025/05/16 with ITMY aligned and ITMX mis-aligned.
See the spectrum with labelled peaks here.
And the PZT calibration here.
100 * 0.56/( 0.56 + 17.62 ) = 3.08 %
Bear in mind that this is assuming that there is no astigmatism in the OMC (since there is but we cannot resolve 02 vs 20 modes). This requires some careful analysis of uncertainties to get useful info about how we should tune for better mode-matching. Watch this space.
In these scans the SR3 heater request (POWER_SET) was 2W, the readback power monitor reports 1.9W.
Using the data from Elenna's scans with the sidebands on, I added a functioncalculate_modulation_depths()to the OMCscan.py code. I then used it to find the modulation depths for the 9 and 45 MHz from those scans:PDH measurement data for two GPS timestamps
Parameter GPS 1431450833 GPS 1431451160 Slider 9 MHz 23.4 dBm 20.4 dBm Slider 45 MHz 27.0 dBm 21.0 dBm Modulation depth 9 MHz 0.215 rad 0.165 rad Modulation depth 45 MHz 0.277 rad 0.145 rad