Summary: We can use single bounce scans in the OMC to constrain how the signal recycling cavity mode-matching affects mode-matching to the OMC - still a work in progress.
This is a collection of the single bounce scans we have done with the OMC in O4b and O4c (excluding some we did between April and July after the first OFI damage which might have made this meaasurement give some weird results) :
| SR3 | OM2 | ITMX | ITMY | Alog | Mode-mis-match [%] |
|---|---|---|---|---|---|
| Cold | Cold | Mis-aligned | Aligned | 79229 | 9.83 |
| Cold | Hot | Mis-aligned | Aligned | 78727 | 6.62 |
| Hot | Cold | Aligned | Mis-aligned | 85693 | 9.63 |
| Hot | Cold | Mis-aligned | Aligned | 85693 | 7.06 |
| Hot | Hot | Aligned | Mis-aligned | 85698 | 5.1 |
| Hot | Hot | Mis-aligned | Aligned | 85698 | 3.08 |
For the single bounce measurements we orginally thought that which ITM the beam bounced off did not affect the mode-matching, but this looks not to be the case so in the following analysis I will only compare measurements where we had ITMX mis-aligned and the beam bouncing off ITMY.
I already used the measurements from the first two rows to estimate the beam parameter just before OM2 in the single bounce configuration in alog #84255.
Since we had the SR3 heater on in the bottom four measurements mentioned above this gives us some points to constrain the mode-matching of the input beam to the signal recycling cavity as well as to the OMC.
The q parameter can be used to define the electric field amplitude transverse to the beam propagation direction z:
U = 1/q ( exp( -jk ( x2 + y2 ) / 2q ))
where k is the wavenumber of the light and x and y are the transverse distances from the center of the beam in the horizontal and vertical directions.
Using the overlap integral:
O(q1,q2) = | U2 U1* |2 / ( |U1|2 |U1|2 )
where U1 is the field amplitude for TM 00 mode of the OMC and U2 is the field amplitude of the mode you are trying to work out the mode-matching to.
One can then define a mode mis-match between the modes U1 U2 :
MM % = (1 - O(q1,q2)) * 100,
In the previous alog I took a grid of possible q-parameters just before OM2 and plotted a contour on this grid showing which of the q values are compatible with the mode-matching I measured for hot OM2 and cold OM2.
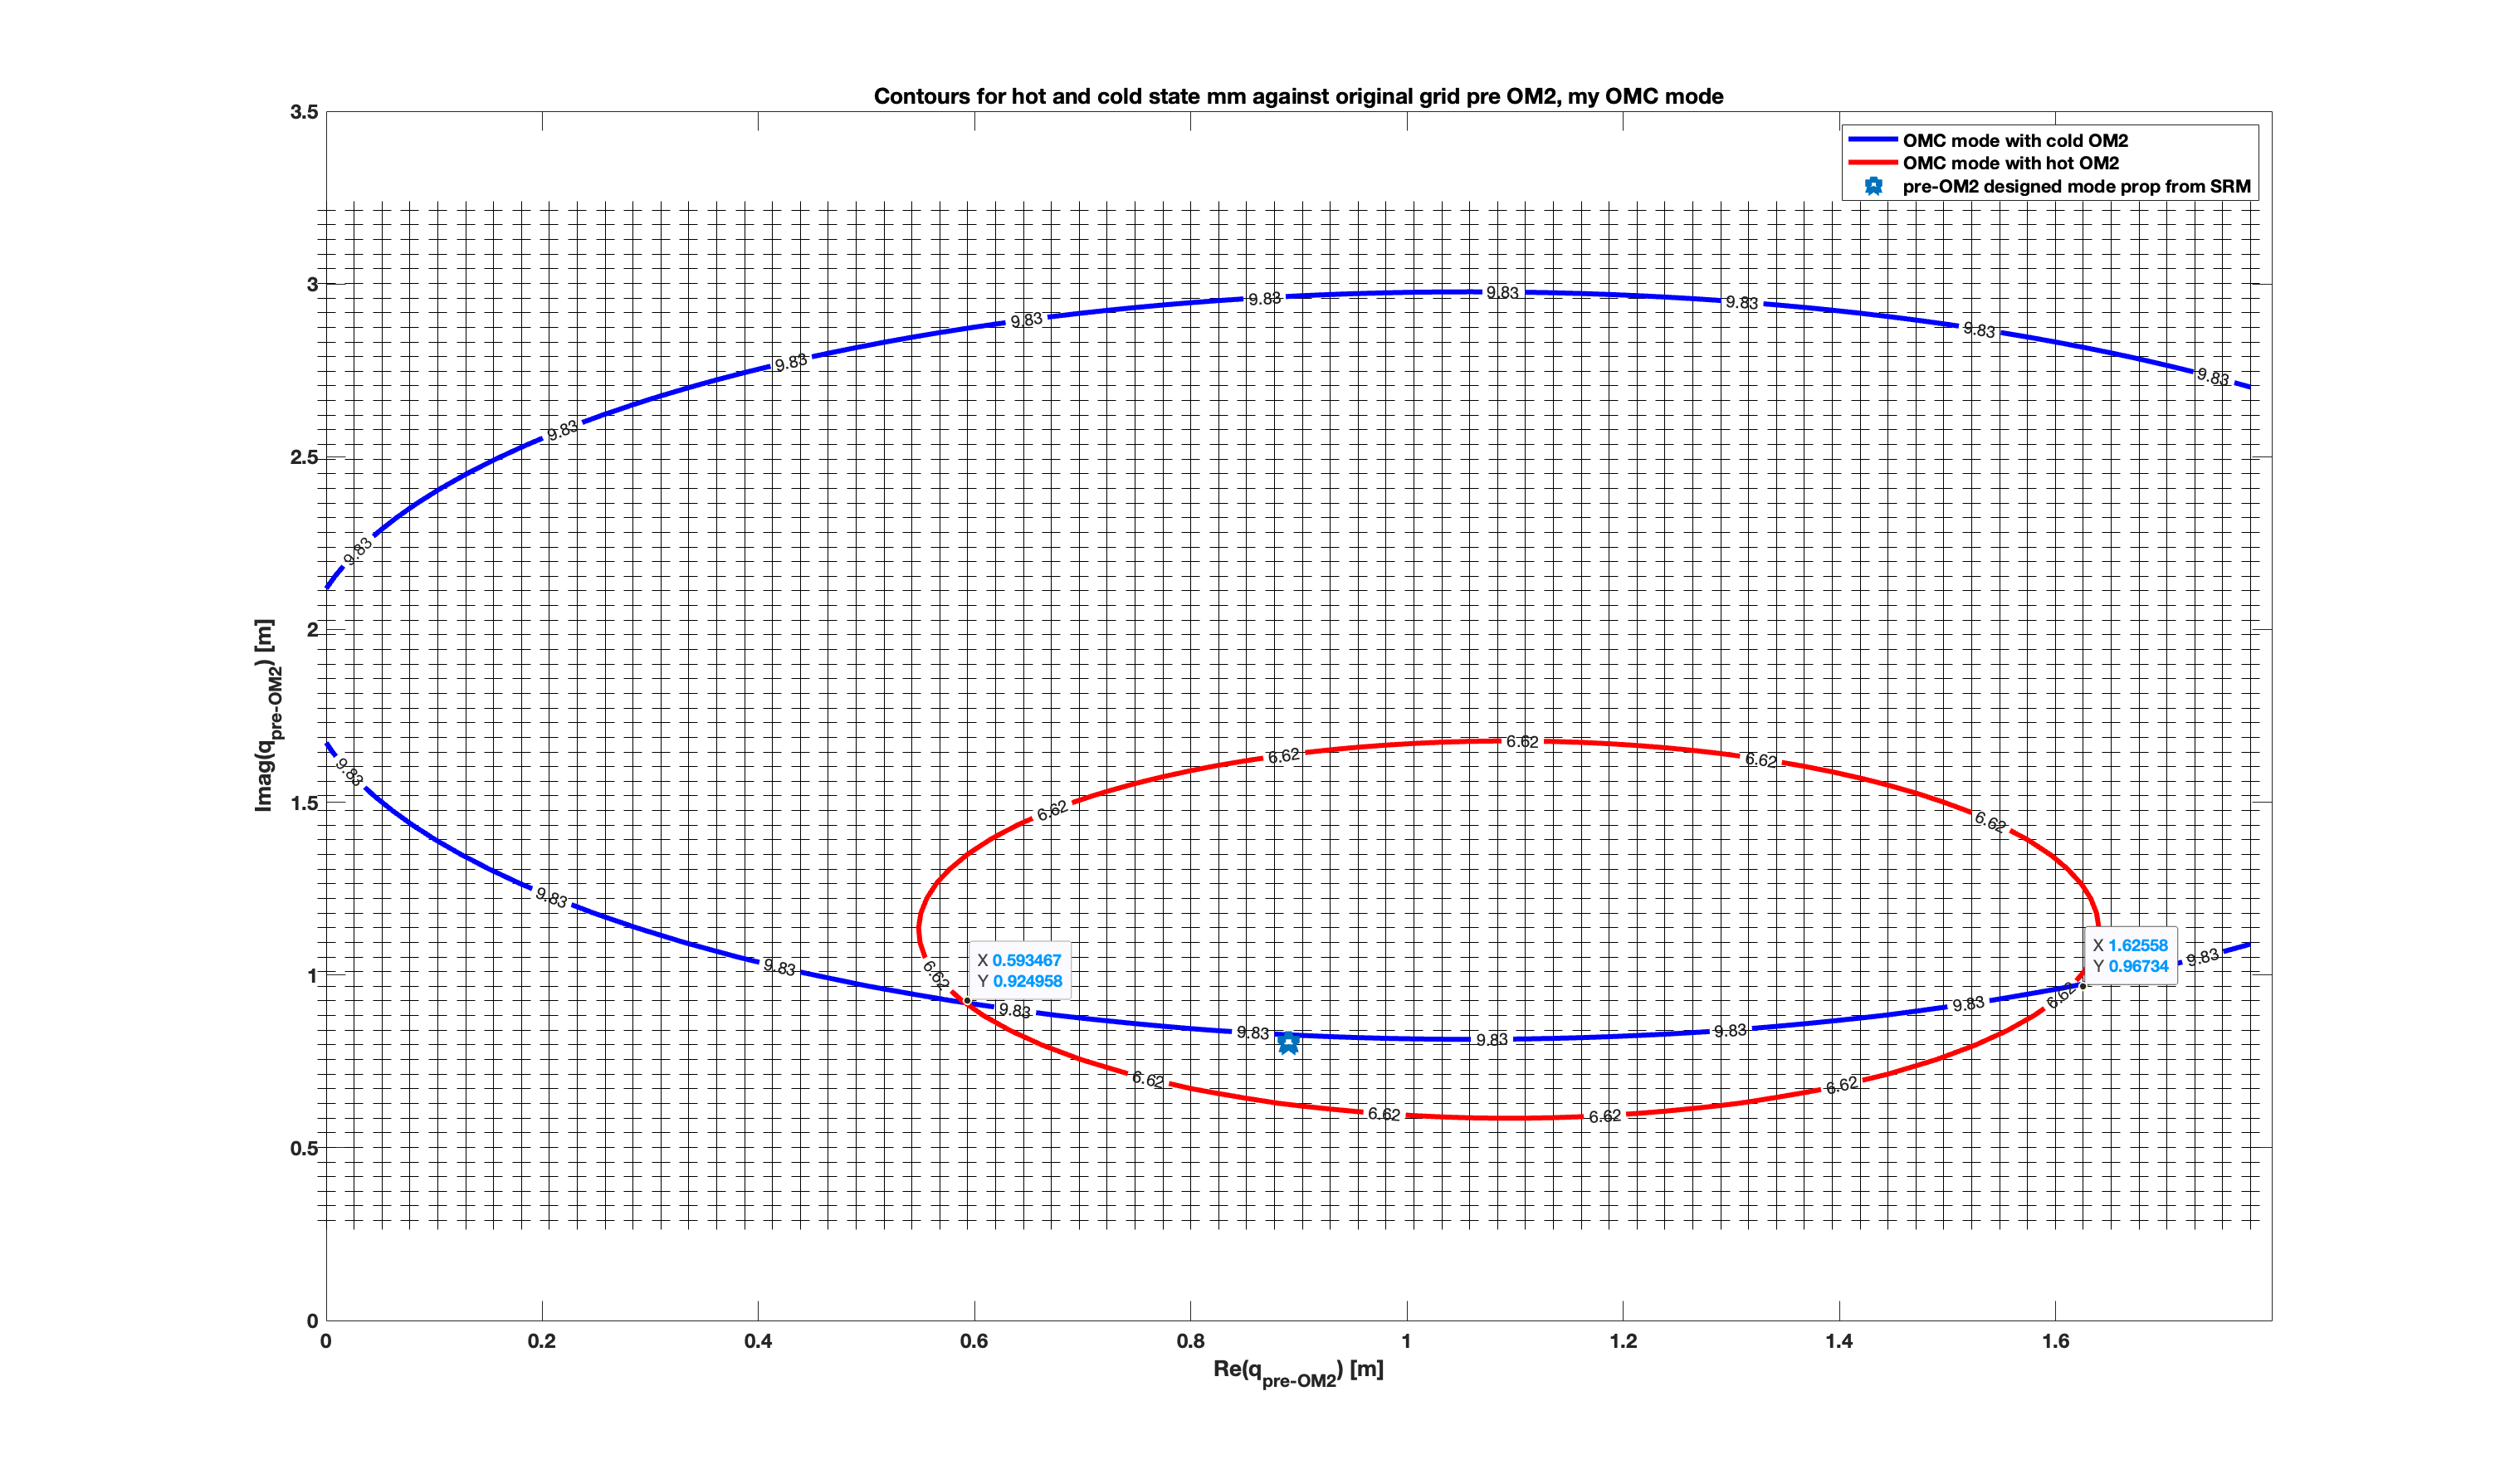
Since I have two measurement showing SR3 hot with OM2 both cold and hot I will plot these two countours on the same plot.
The two possible qs this gives us are the overlap of the green and magenta lines - ie. the q parameter could be either of these values when SR3 is hot.
q1 = 0.748 + 0.967i
q2 = 1.44 + 1.01i
