This is a look at the data that Camilla and TJ took in 85957, motivated by some modeling work that Kevin and Dan have been doing. We took data to look at the squeezing rotation around the arm higher order modes, to compare to measurements that Kevin took using the ADF. We borrowed Jeff's DCPD test matrix to create a DCPD sum channel at 524kHz, and used a modified version of Elenna's script to save 5 minutes of no squeezing data from the individual DCPDs. 85937
Process details:
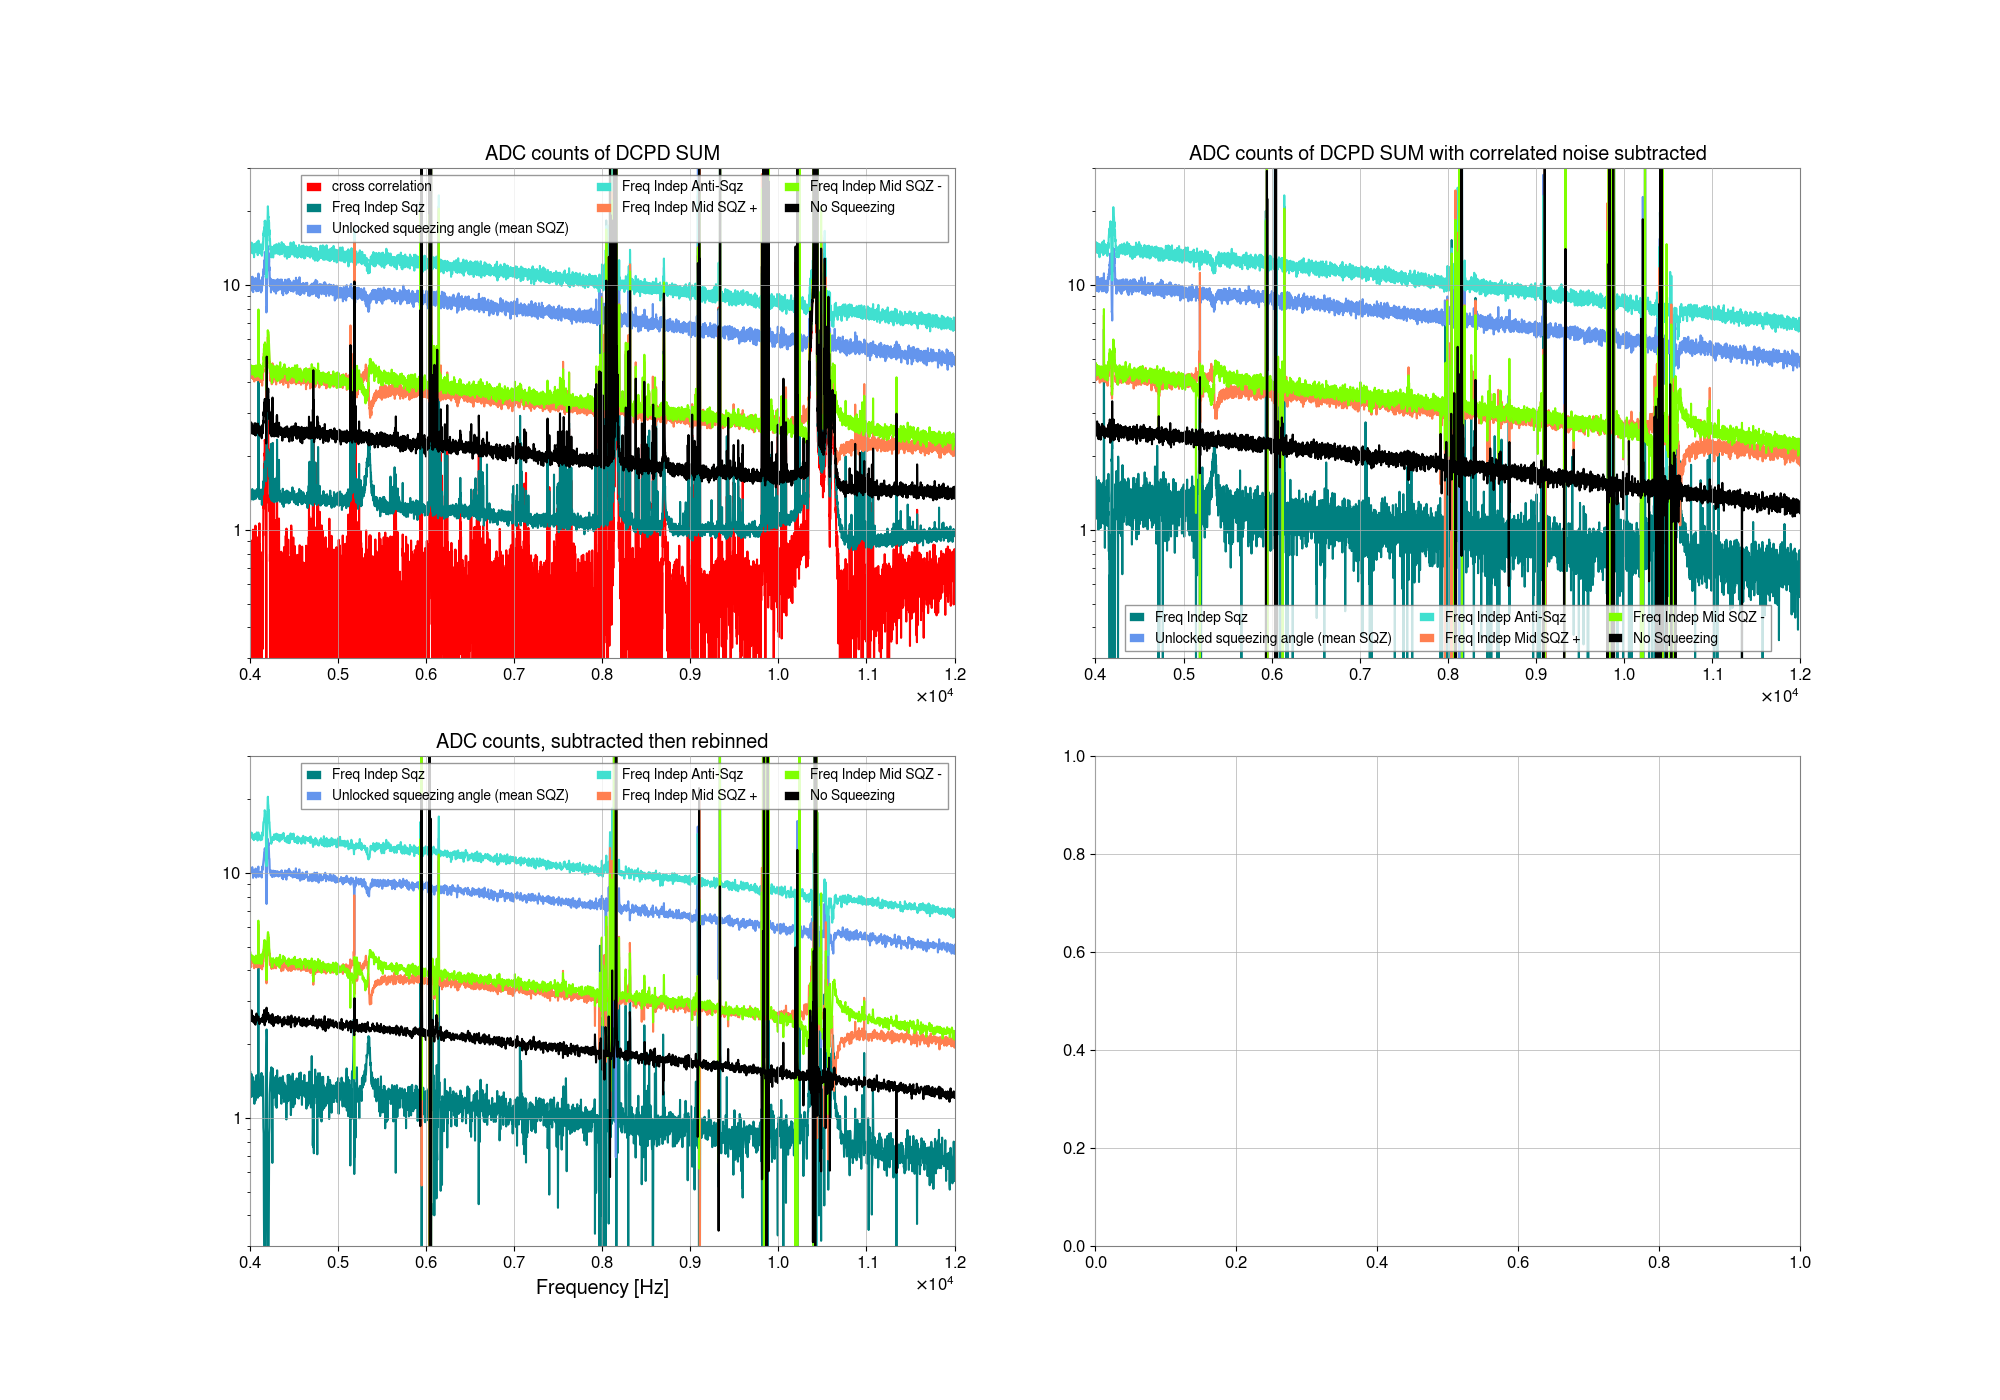
The first plot here shows the spectra and cross correlation, subtraction and rebinning that I did. We took 5 minutes of data for each of these traces, and 1 second FFTs, so we have 300 averages and the cross correlation asd should be a factor of 300^1/4 = 4 below the no squeezing asd. (Thanks to Elenna for pointing out that I was doing this ratio for the PSD). This is not far below the squeezing level, so when we do the subtraction of the cross correlation the squeezing data becomes noisy. We could do this with shorter FFTs to get the cross correlation lower where the noise is uncorrelated between the two DCPDs, but we want to subtract some fairly narrow features from the spectra, so our best option if we are bothered by this noisy subtracted squeezing data would be to take a longer no squeezing time. After doing the subtraction I rebinned the data to 3 Hz bins.
Looking at higher order mode frequencies:
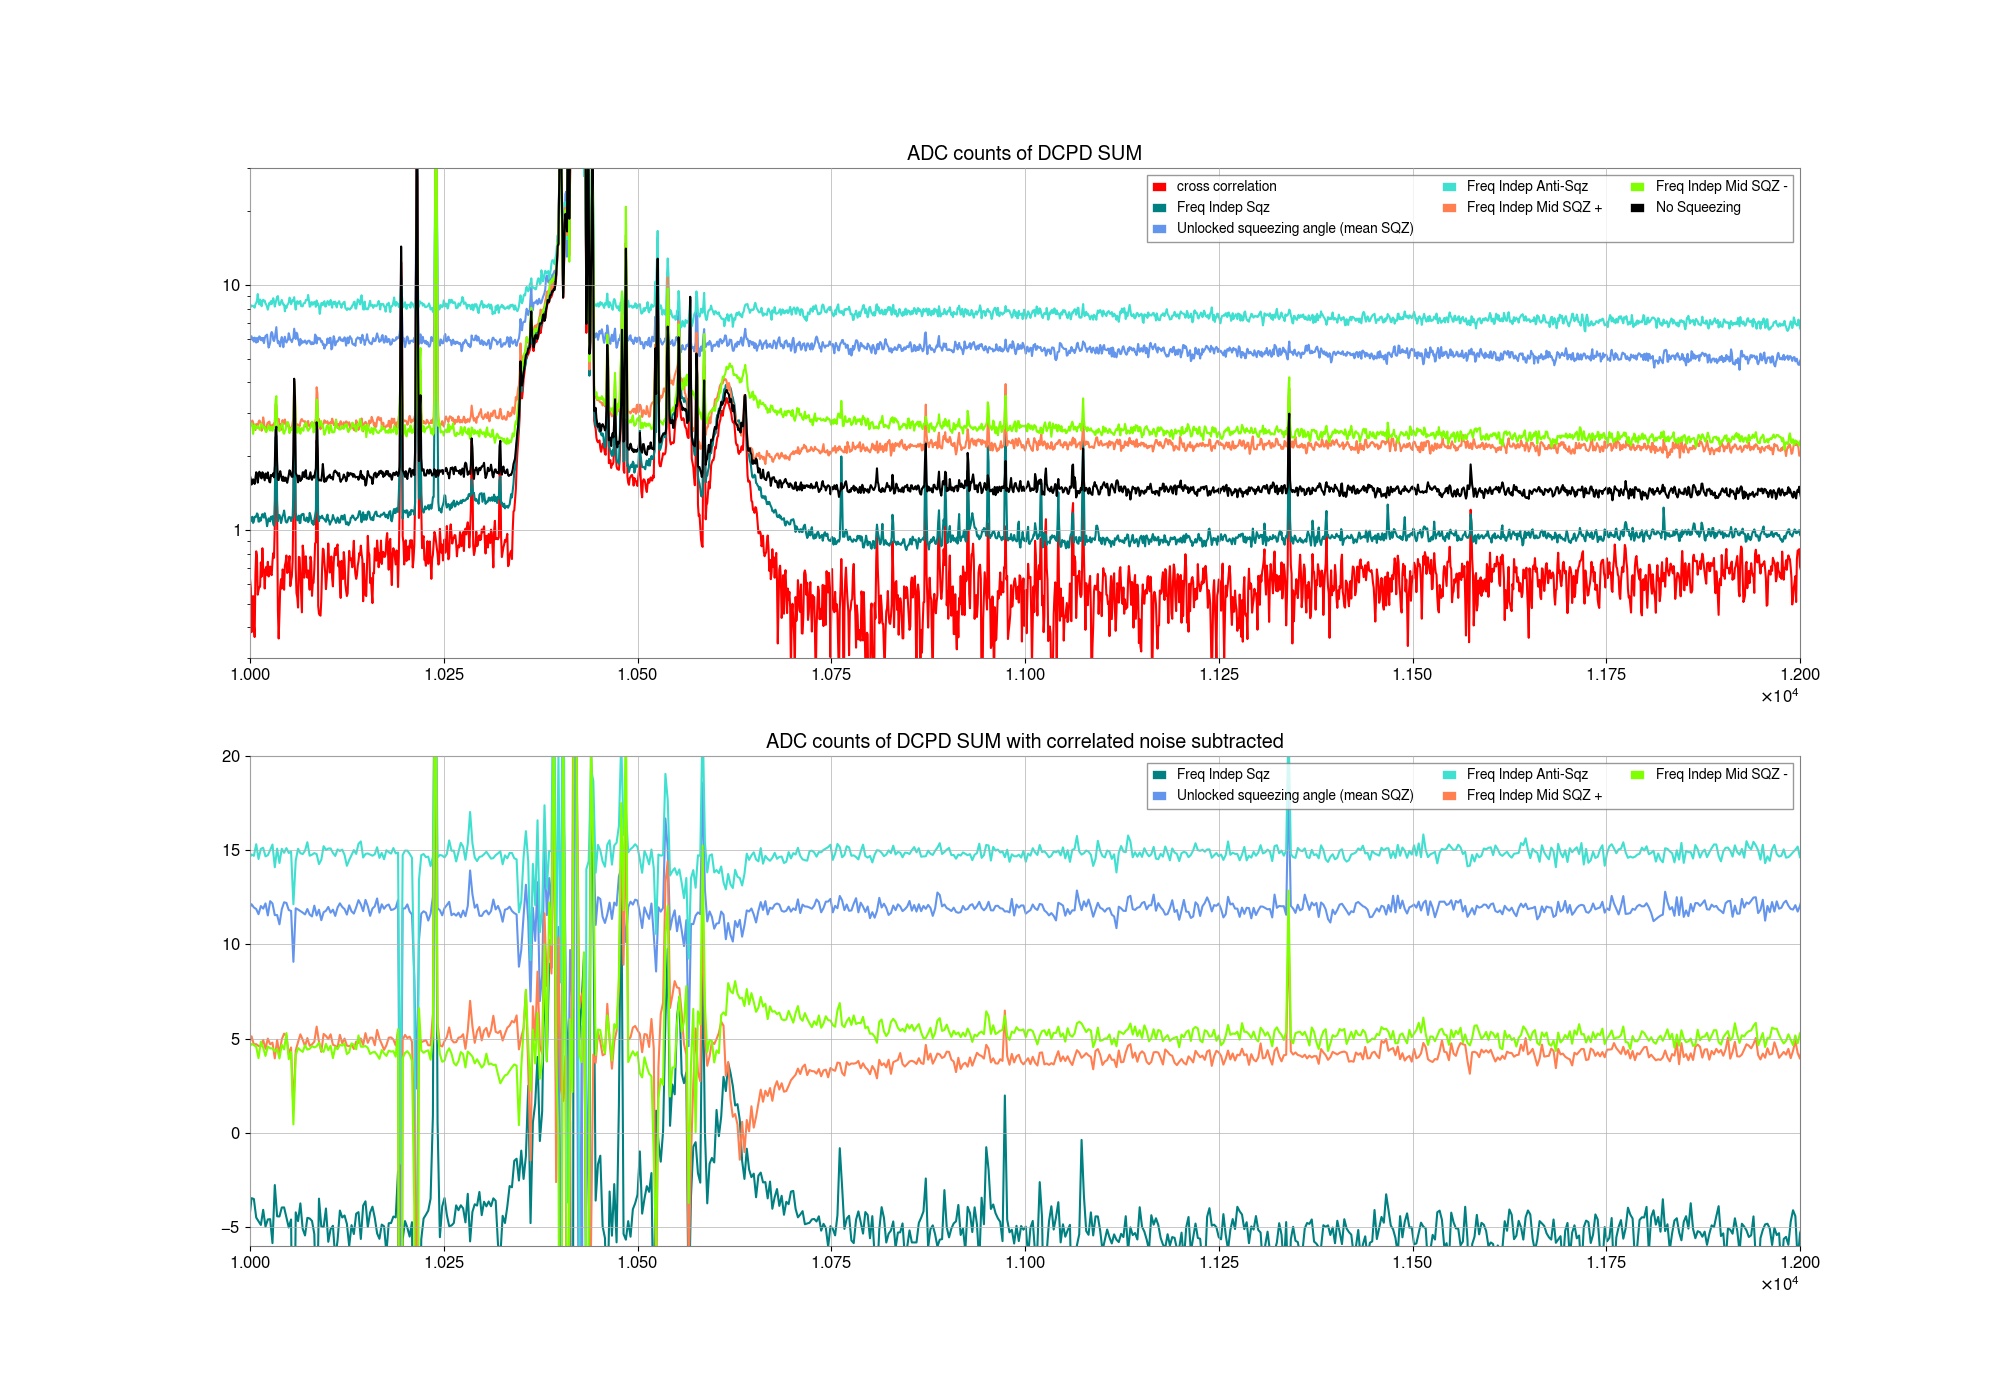
The next plot shows this data plotted in dB of squeezing, you can identify the higher order modes most clearly from looking at the mid squeezing data where the higher order modes cause a rotation of the squeezing angle. Zooming in on 10 kHz you can identify the higher order mode frequencies as roughly 10615+/5 Hz and 10565+/- 10Hz from the X arm modes (see 84172 for ID with X arm), with the uncertainty based on what I can place as limits by eye, which is worse for the lower mode. The separation of these into different peaks means that there is some astigmatism in the X arm. The y arm mode has much more correlated noise to subtract, and is sitting right under the forest of accoustic modes, but you can still see evidence of a rotation starting around 10.25kHz. This data isn't clear enough to estimate if there is similar evidence of astigmatism in the y arm.
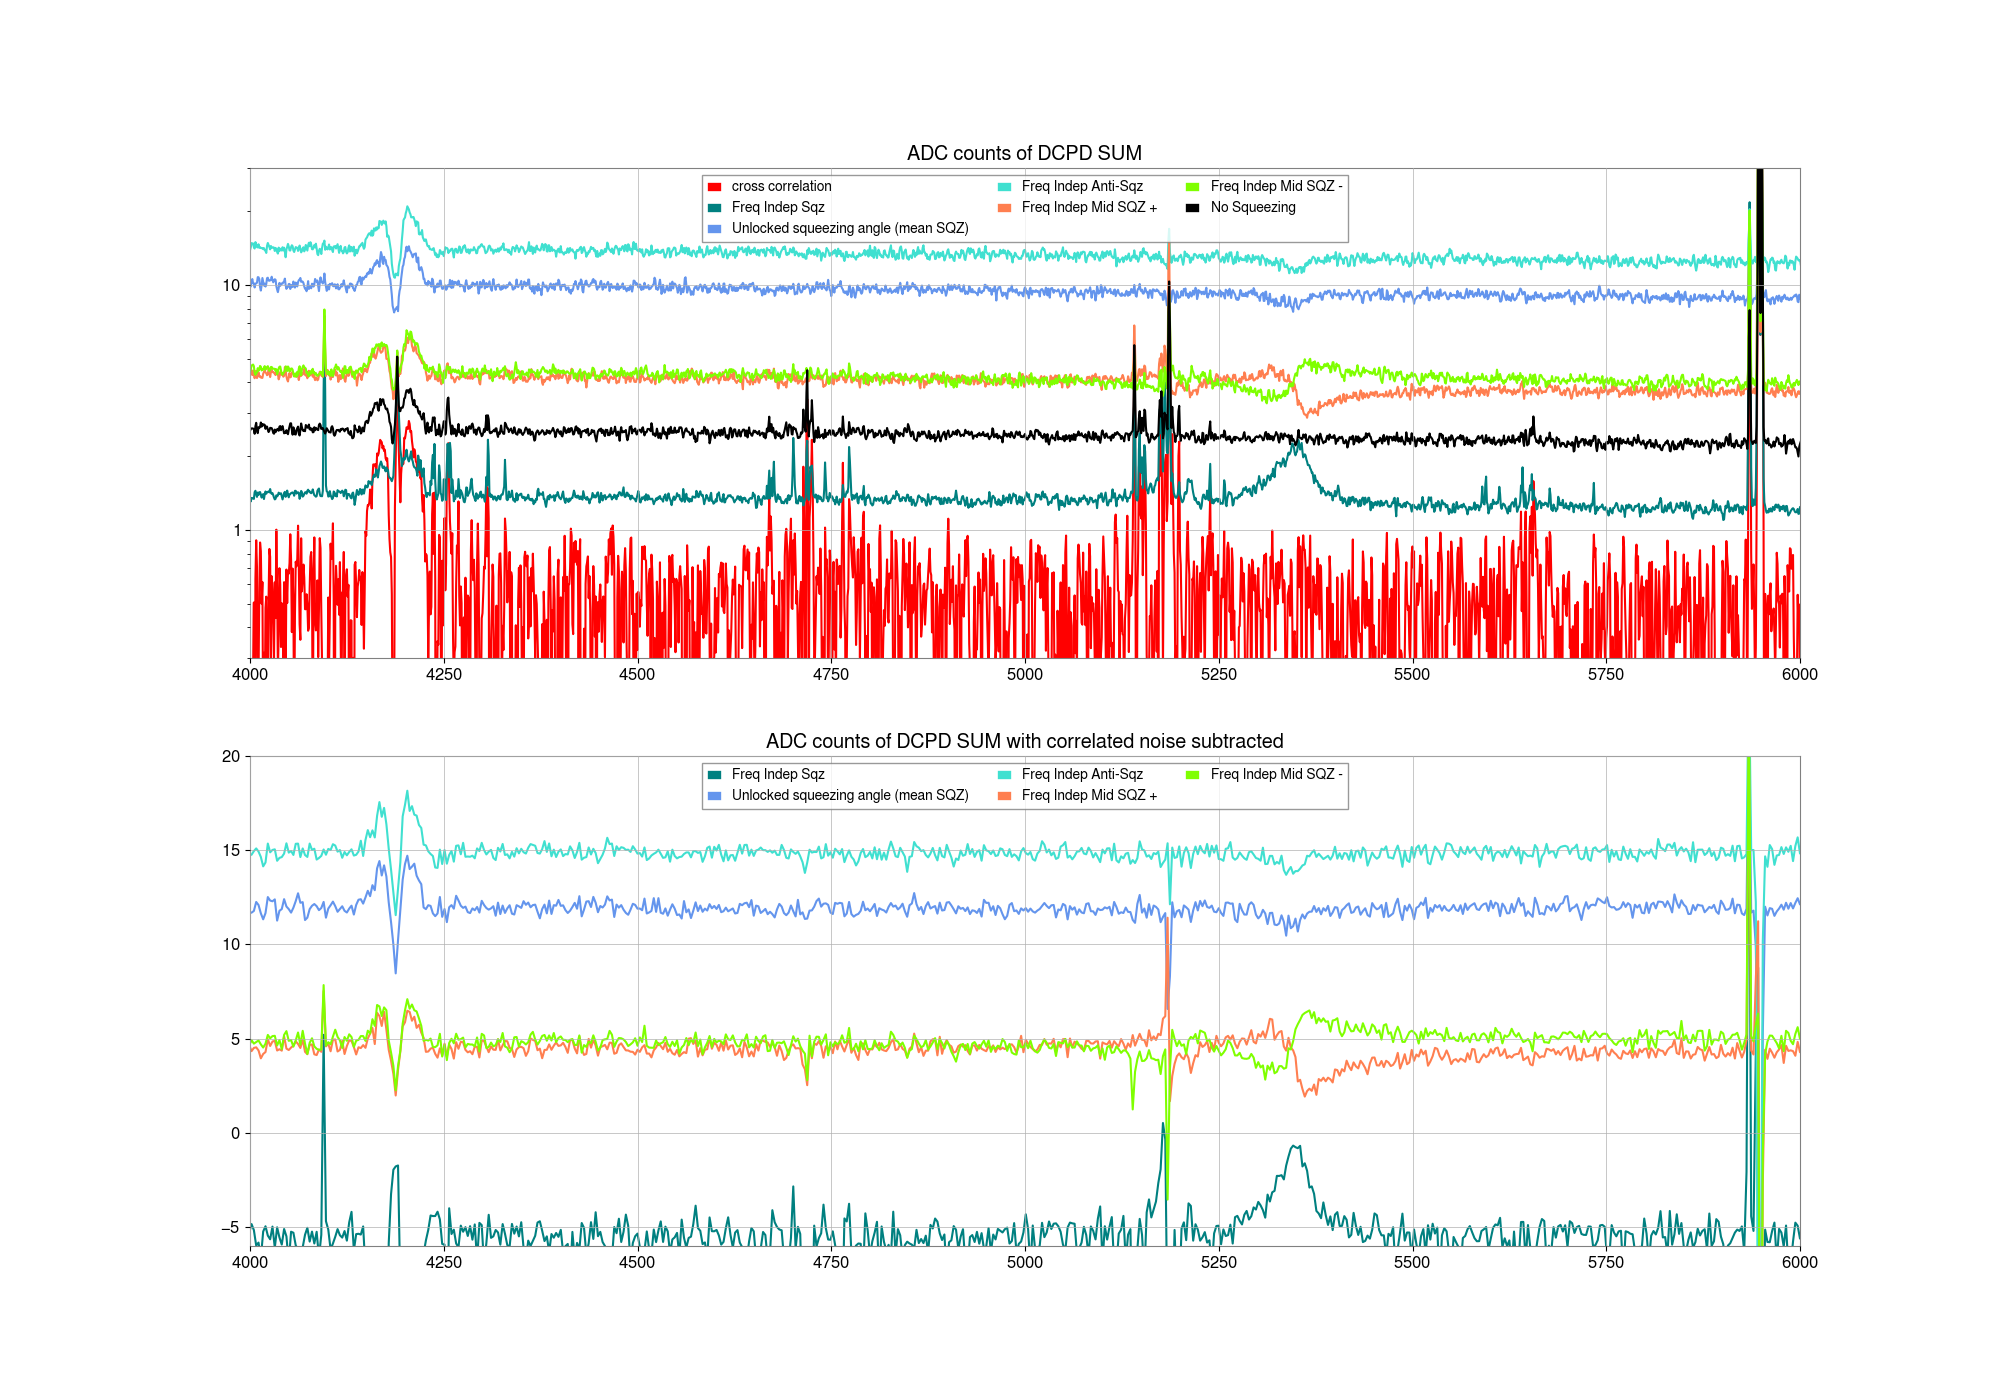
Zooming in around 5kHz, we can see that there do seem to be two modes with rotations, one of them is sitting on top of a set of lines, but seems to be narrower than the other. The broad mode is at 5345+/- 15 Hz Hz and the narrower one is at 5184+/- 4Hz . Assuming that the second one is from the X arm based on the identification of the 2nd order modes, the second order mode frequency is 98.8+/- 0.3% of twice the first order mode frequency for the lower mode, and 99.3% +/-0.3% for the upper mode. This ratio is not 1 because the beam size of the 2nd order modes is slightly bigger than for the 1st order mode, since the mirror is non spherical its curvature is sightly different for the larger sized beam, so these ratios contain some information about how non spherical the mirrors are.
Squeezing loss and rotation estimates:
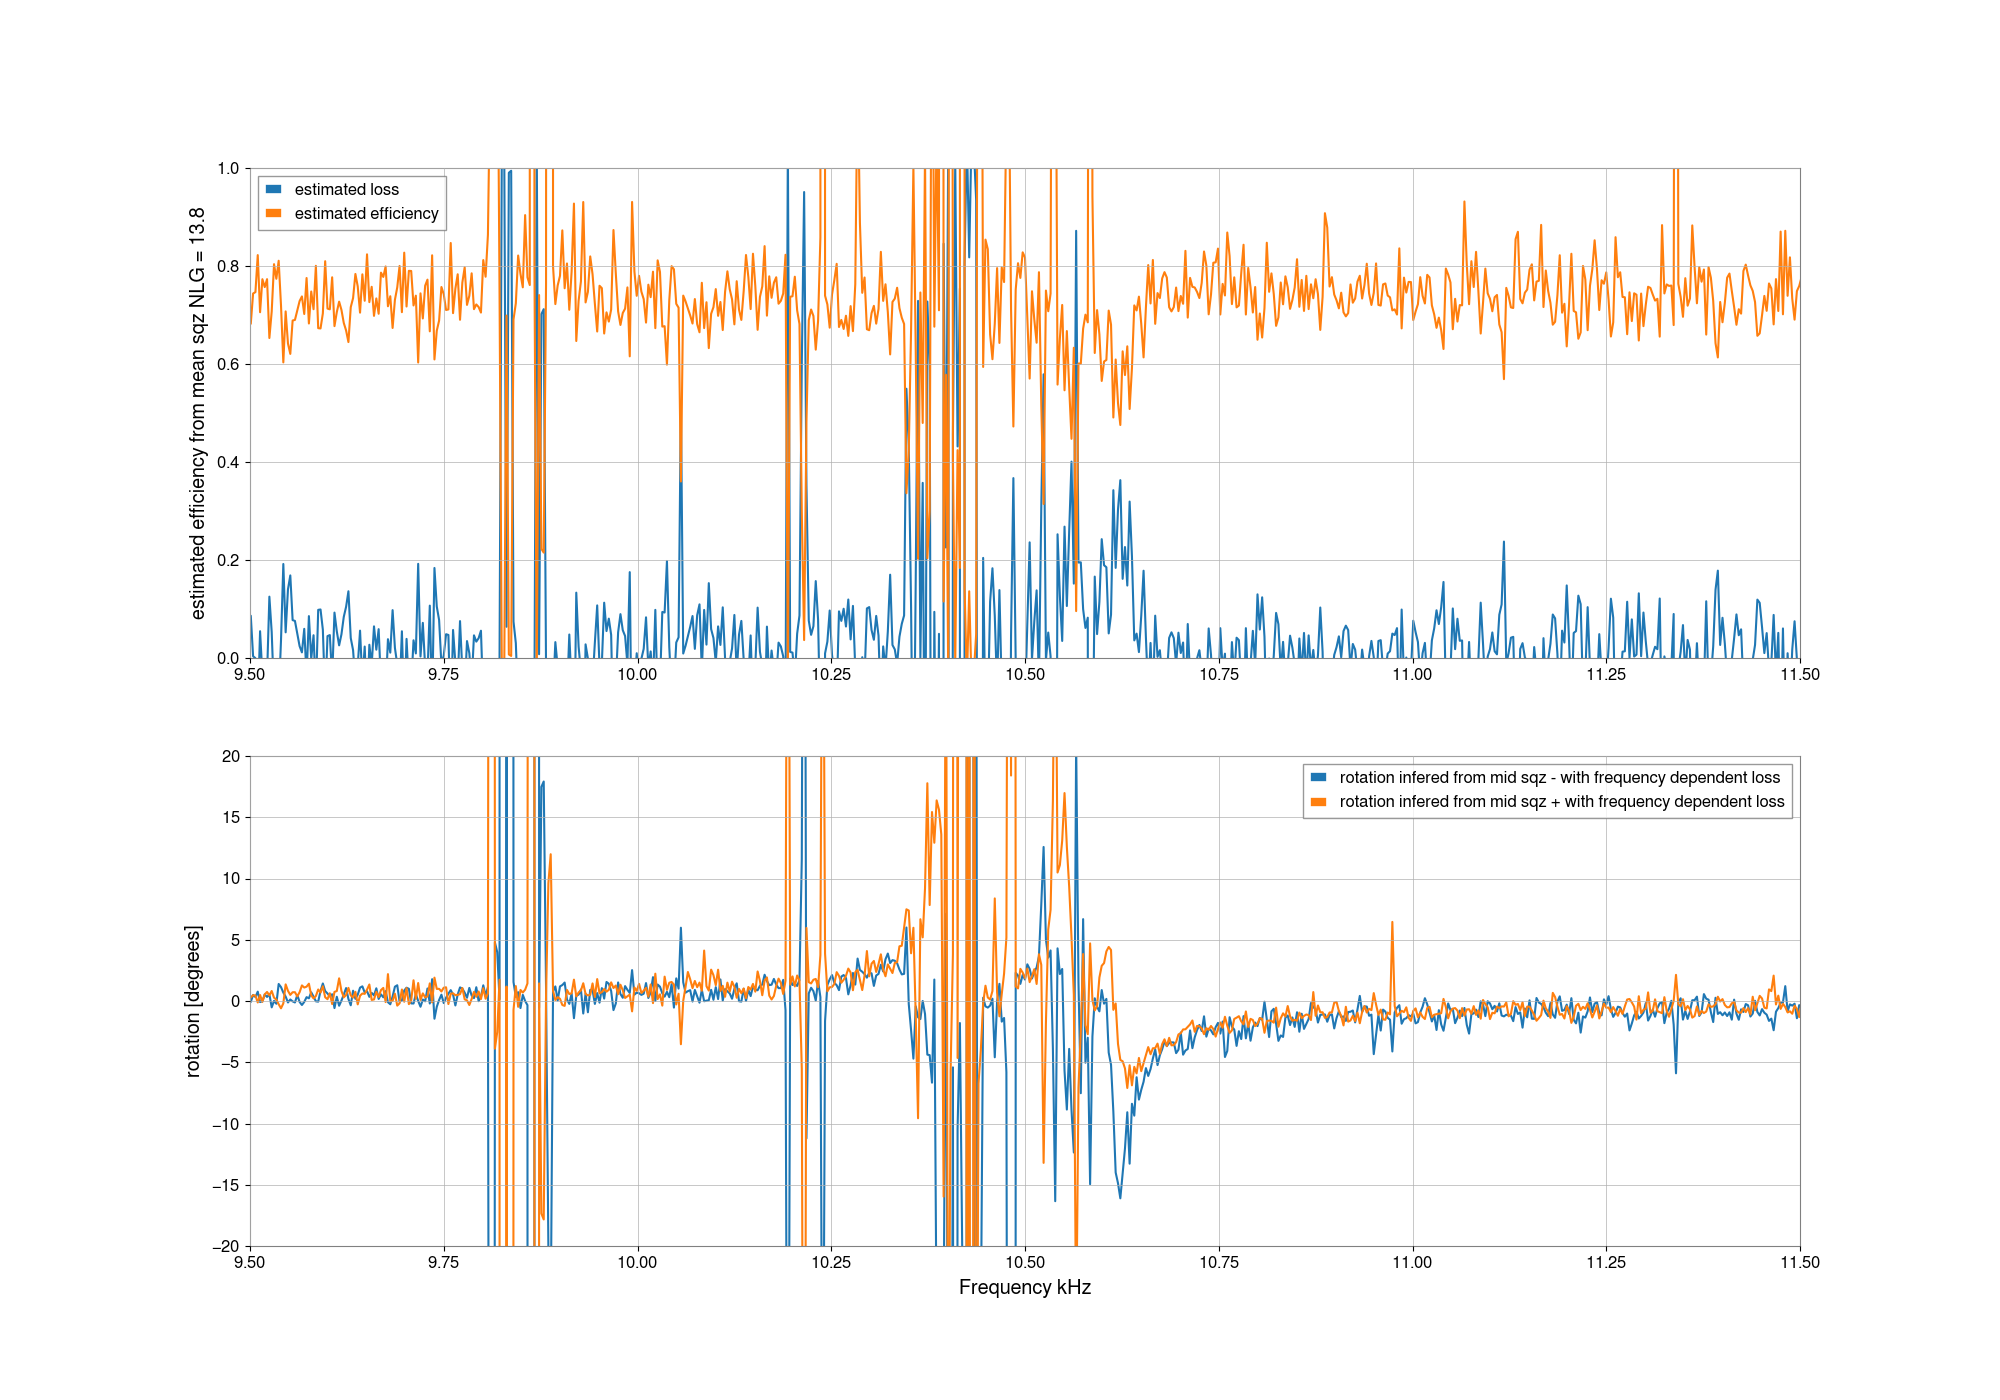
We can use this data to estimate a loss an rotation expirienced by the squeezing at these higher order modes. Using the mean squeezing data, where the squeezing angle is completely uncontrolled, and Camilla's measurement of the nonlinear gain of 13.8 we can estimtae the total squeezing efficiency (using the notation from Aoki):
- eta = (R_mean-1)/[2*x*(1/(1-x)**2-1/(1+x)**2)]
- x = 1 - 1/np.sqrt(NLG)
- R_mean = ratio of PSD with mean sqz over no sqz (varience)
Using this estimate we can predict the anti-squeezing level, which is mostly insensitive to squeezing angle, this prediction is plotted in the dark blue on the dB plot, where it agrees nicely with the measured anti-squeezing.
We can also make an estimate of the rotation using the mid squeezing data where we have about 5dB of anti-squeezing. To do this, I first fit the average squeezing angle for these measurements using data from 6.3kHz to 7.8kHz, using the Aoki equation:
- R = R_p sin^2(theta) + R_m cos^2 theta
- Rp = 1+4*x*eta/(1-x)**2 ;
- Rm = 1-4*x*eta/(1+x)**2


We got three good sets of ADF measurements targeting the two X arm modes. One was taken before the ETMY ring heater was changed (85514) and two were taken after. The gps start times of the upper sideband sweeps for each of these measurements are
pre-RH change 1433785394
post-RH change 1 1436198864
post-RH change 2 1436809945
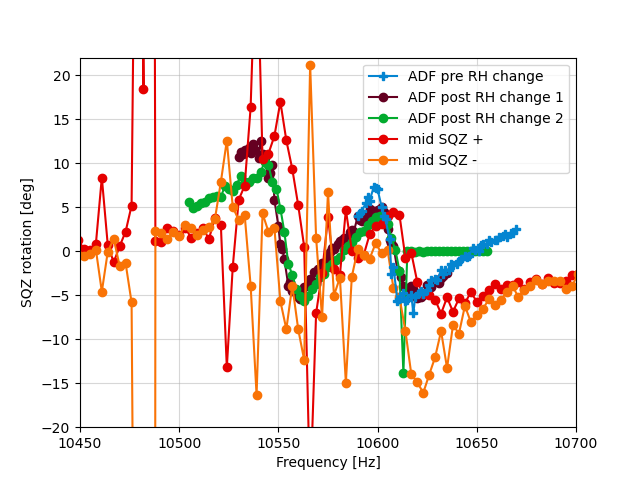
There are difficulties in calculating all of the squeezing metrics described in the ADF paper (PhysRevD.105.122005), but the squeeze angle is relatively straightforward to calculate using equations (26), (33), and (34) of that paper. (All of the lower sidebands in those equations should be the conjugates of the lower sidebands.) The first plot shows the inferred squeeze angle for these three measurements along with the DCPD spectra for those times. These are consistent with what you would expect for the rotation generated from an astigmatic arm cavity and can probably be fit with a bit more work. The flat line above 10.6 kHz in the post-RH change 2 rotation is because we lost lock at the end of that measurement. The rotation is fairly constant which isn't surprising since the Y arm modes were mainly changed by the ETMY RH change. The change in the DCPD is likely due to a change in the laser noise coupling independent of any squeezing effects.
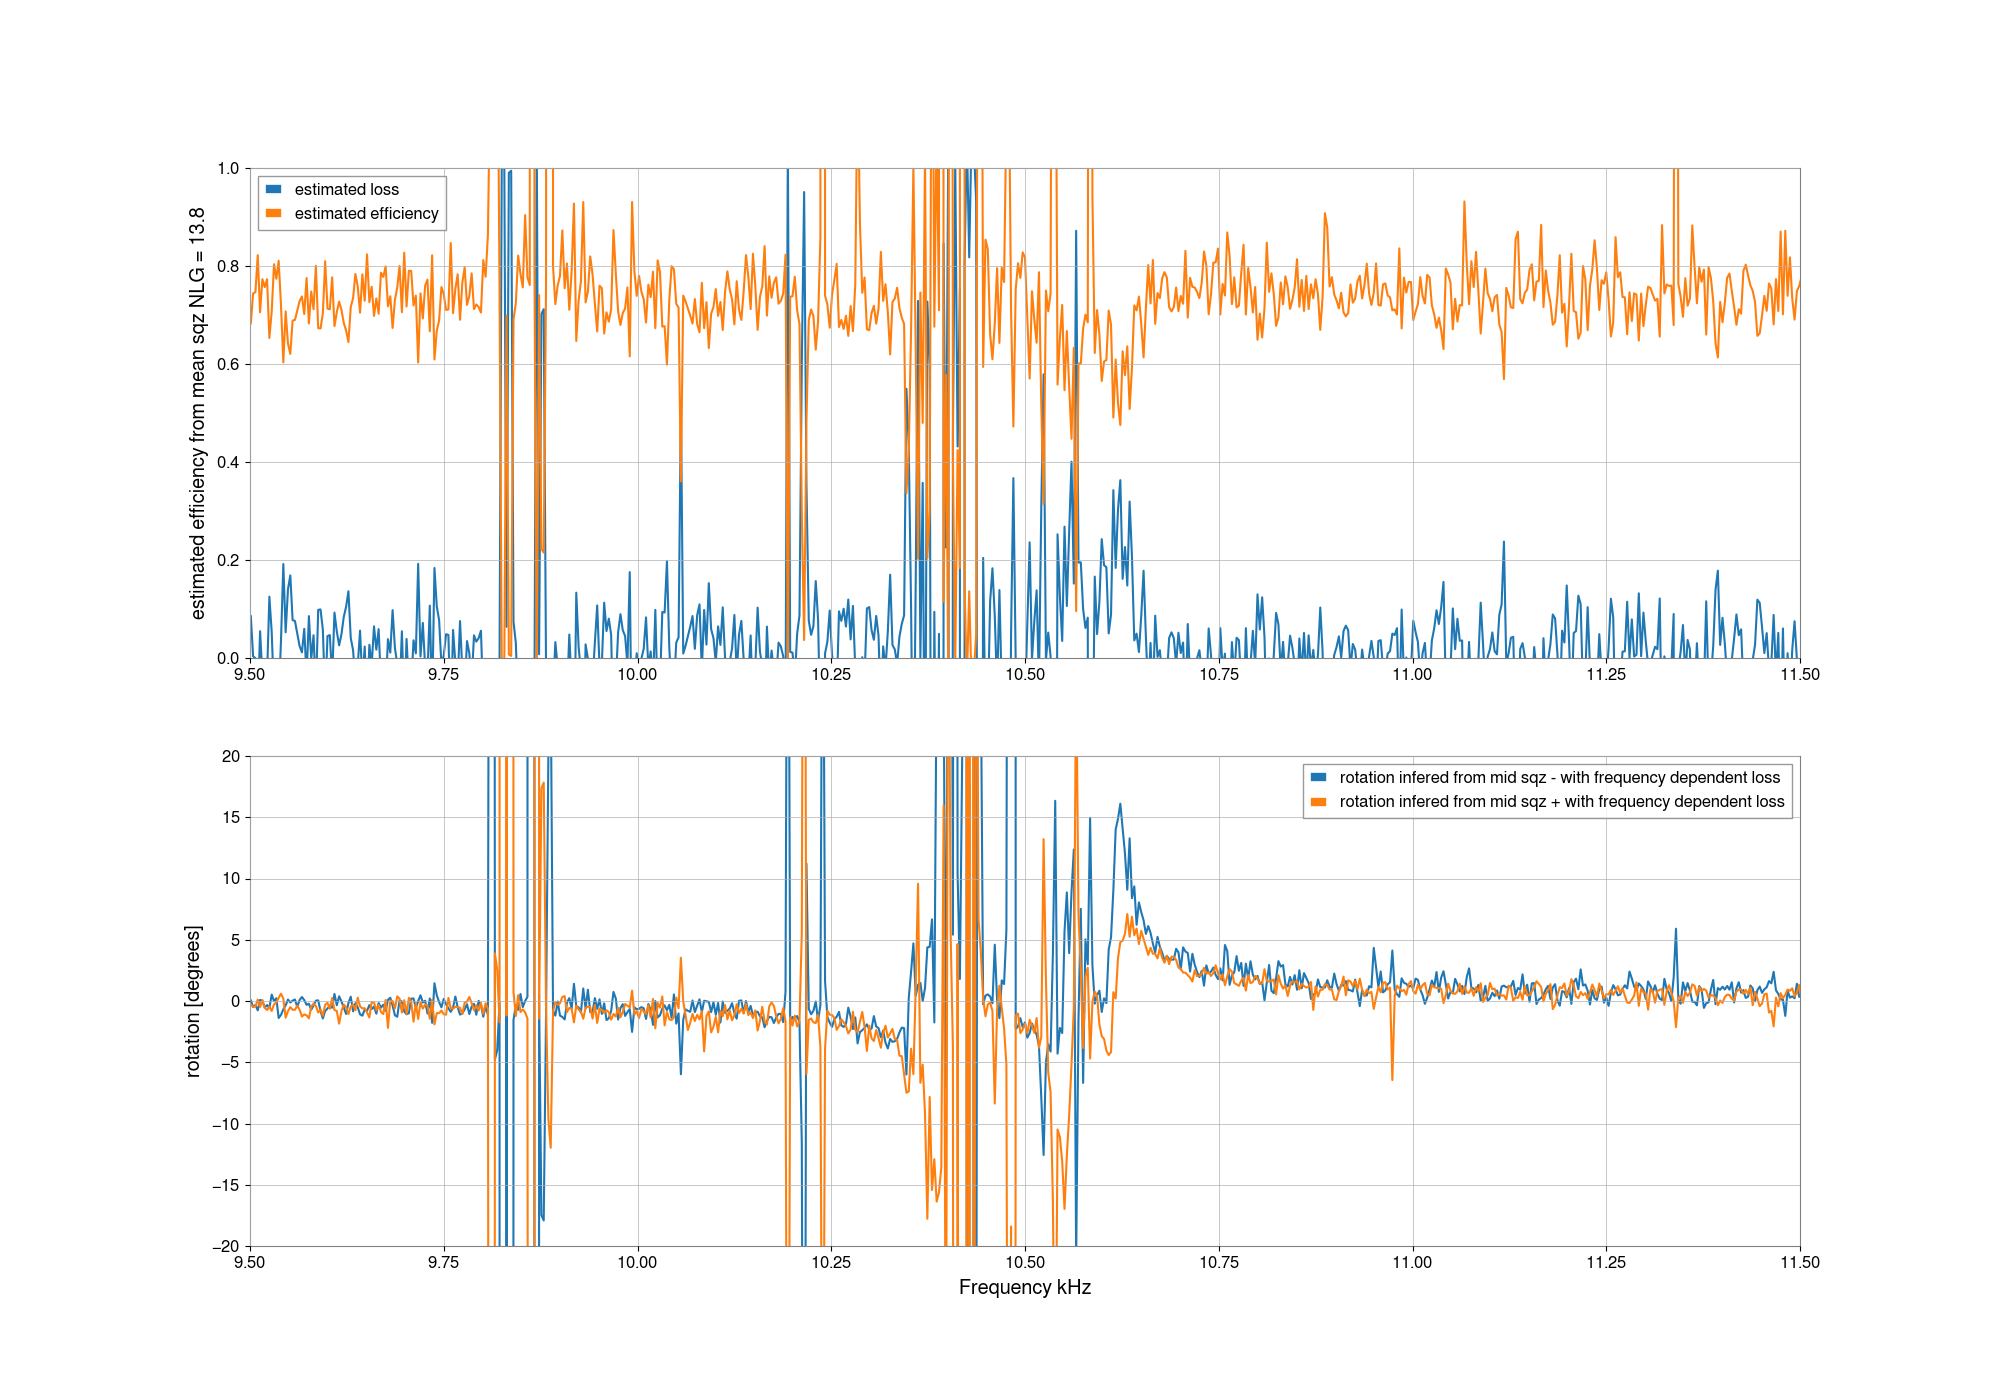
The second plot compares these measurements with the ones that Sheila measured above. The data is noisy and there's about a 10 deg variation between the rotation inferred from mid SQZ + and mid SQZ - around the second peak but the mid-SQZ + magnitude and the mid-SQZ- frequency dependence are fairly consistent with the ADF measurements. Uncertainty in the NLG will propagate to uncertainty in the magnitude of the rotation in both cases.
These plots can be made by running the following in the aligoNB environment
pytest /ligo/gitcommon/squeezing/sqzutils/analysis/T_10kHz_ADF.py -s -k T_compare_10kHz