Edgard, Ivey
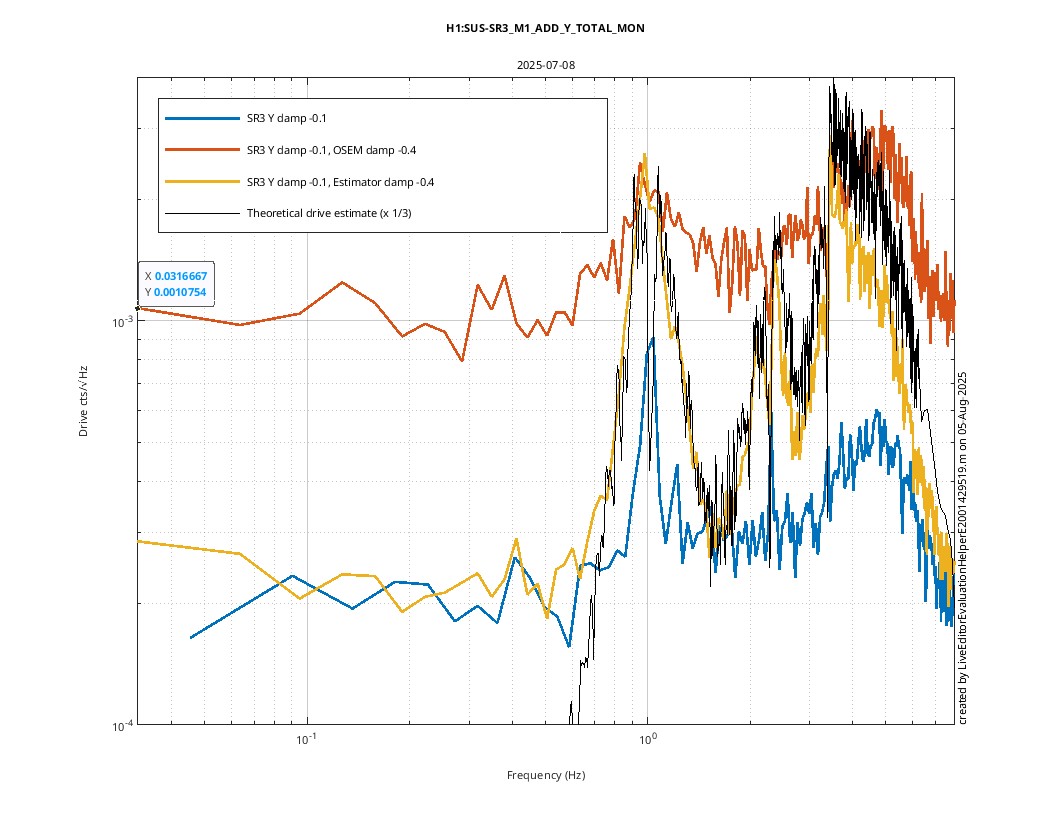
A few weeks ago, Oli ran some tests on the SR3 Yaw estimator (see LHO: 85745 for results). Edgard and I did some math to see if the OSEM estimator is requesting drive as expected by theory (we want our theoretical plot to align with the yellow trace in the third plot in the pdf below).
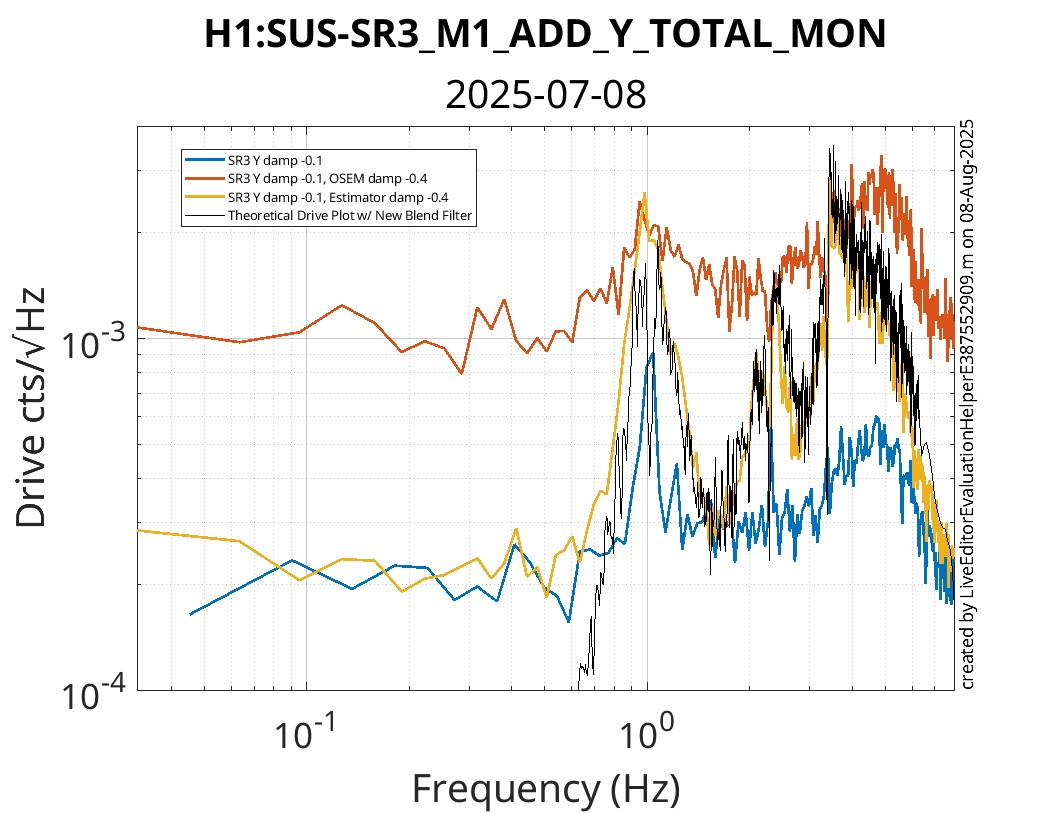
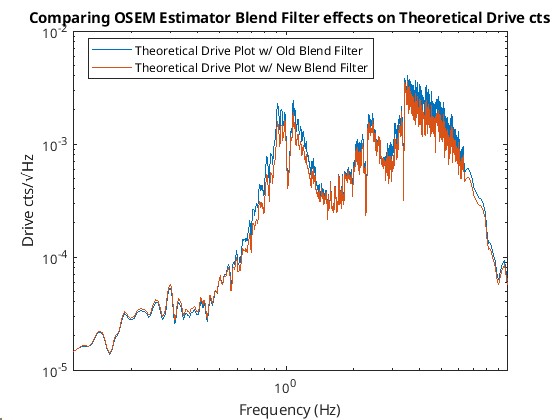
Attached below are images of the theoretical drive estimates compared against the empirical drive requests (yellow trace). The "old" theoretical drive estimate is made with the old blend filters (see LHO: 84004), and the "new" theoretical drive estimate is made with the new blend filters (see LHO: 86265).
A few notes on how we calculated the theoretical drive estimate: Because OSEM noise dominates, except at the resonances where suspoint motion dominates, we only considered OSEM noise when generating our theoretical drive estimate. We multiplied the theoretical plot by 1/3, which we eyeballed. The difference of a factor of 3 is likely an error in our math, which we can easily check. The theoretical plot deviates significantly from the empirical results below 0.6 Hz because the OSEM noise data we are using is not ideal (see the first plot in the pdf for a more accurate depiction of OSEM noise). However, the main concern is to show that the general shape is accounted for.
What the theoretical drive estimate plots show:
The "old" plot shows that the peak at 2 Hz is expected. This peak is likely not noise as we had originally believed, but a part of a larger peak that consists of the peak at 2 Hz and its adjacent peak. For the yellow trace, the dip between the two peaks is a result of the suspoint motion dipping below OSEM noise. For the black trace, the dip between the two peaks is a result of not including suspoint motion in our math. The same can be said about the peak at around 3 Hz.
An objective of the new blend filters was to damp the 2nd and 3rd peaks, as well as make the peaks more symmetrical. The "new" plot shows the peaks are successful at request less drive, but the symmetry of the peaks has not changed significantly.
Overall, the theoretical drive plot shows that the major characteristics from Oli's test are accounted for by the theory, and the estimator is working as expected!