elenna.capote@LIGO.ORG - posted 11:18, Tuesday 16 September 2025 (86964)
Comparing all powers before and after power outage
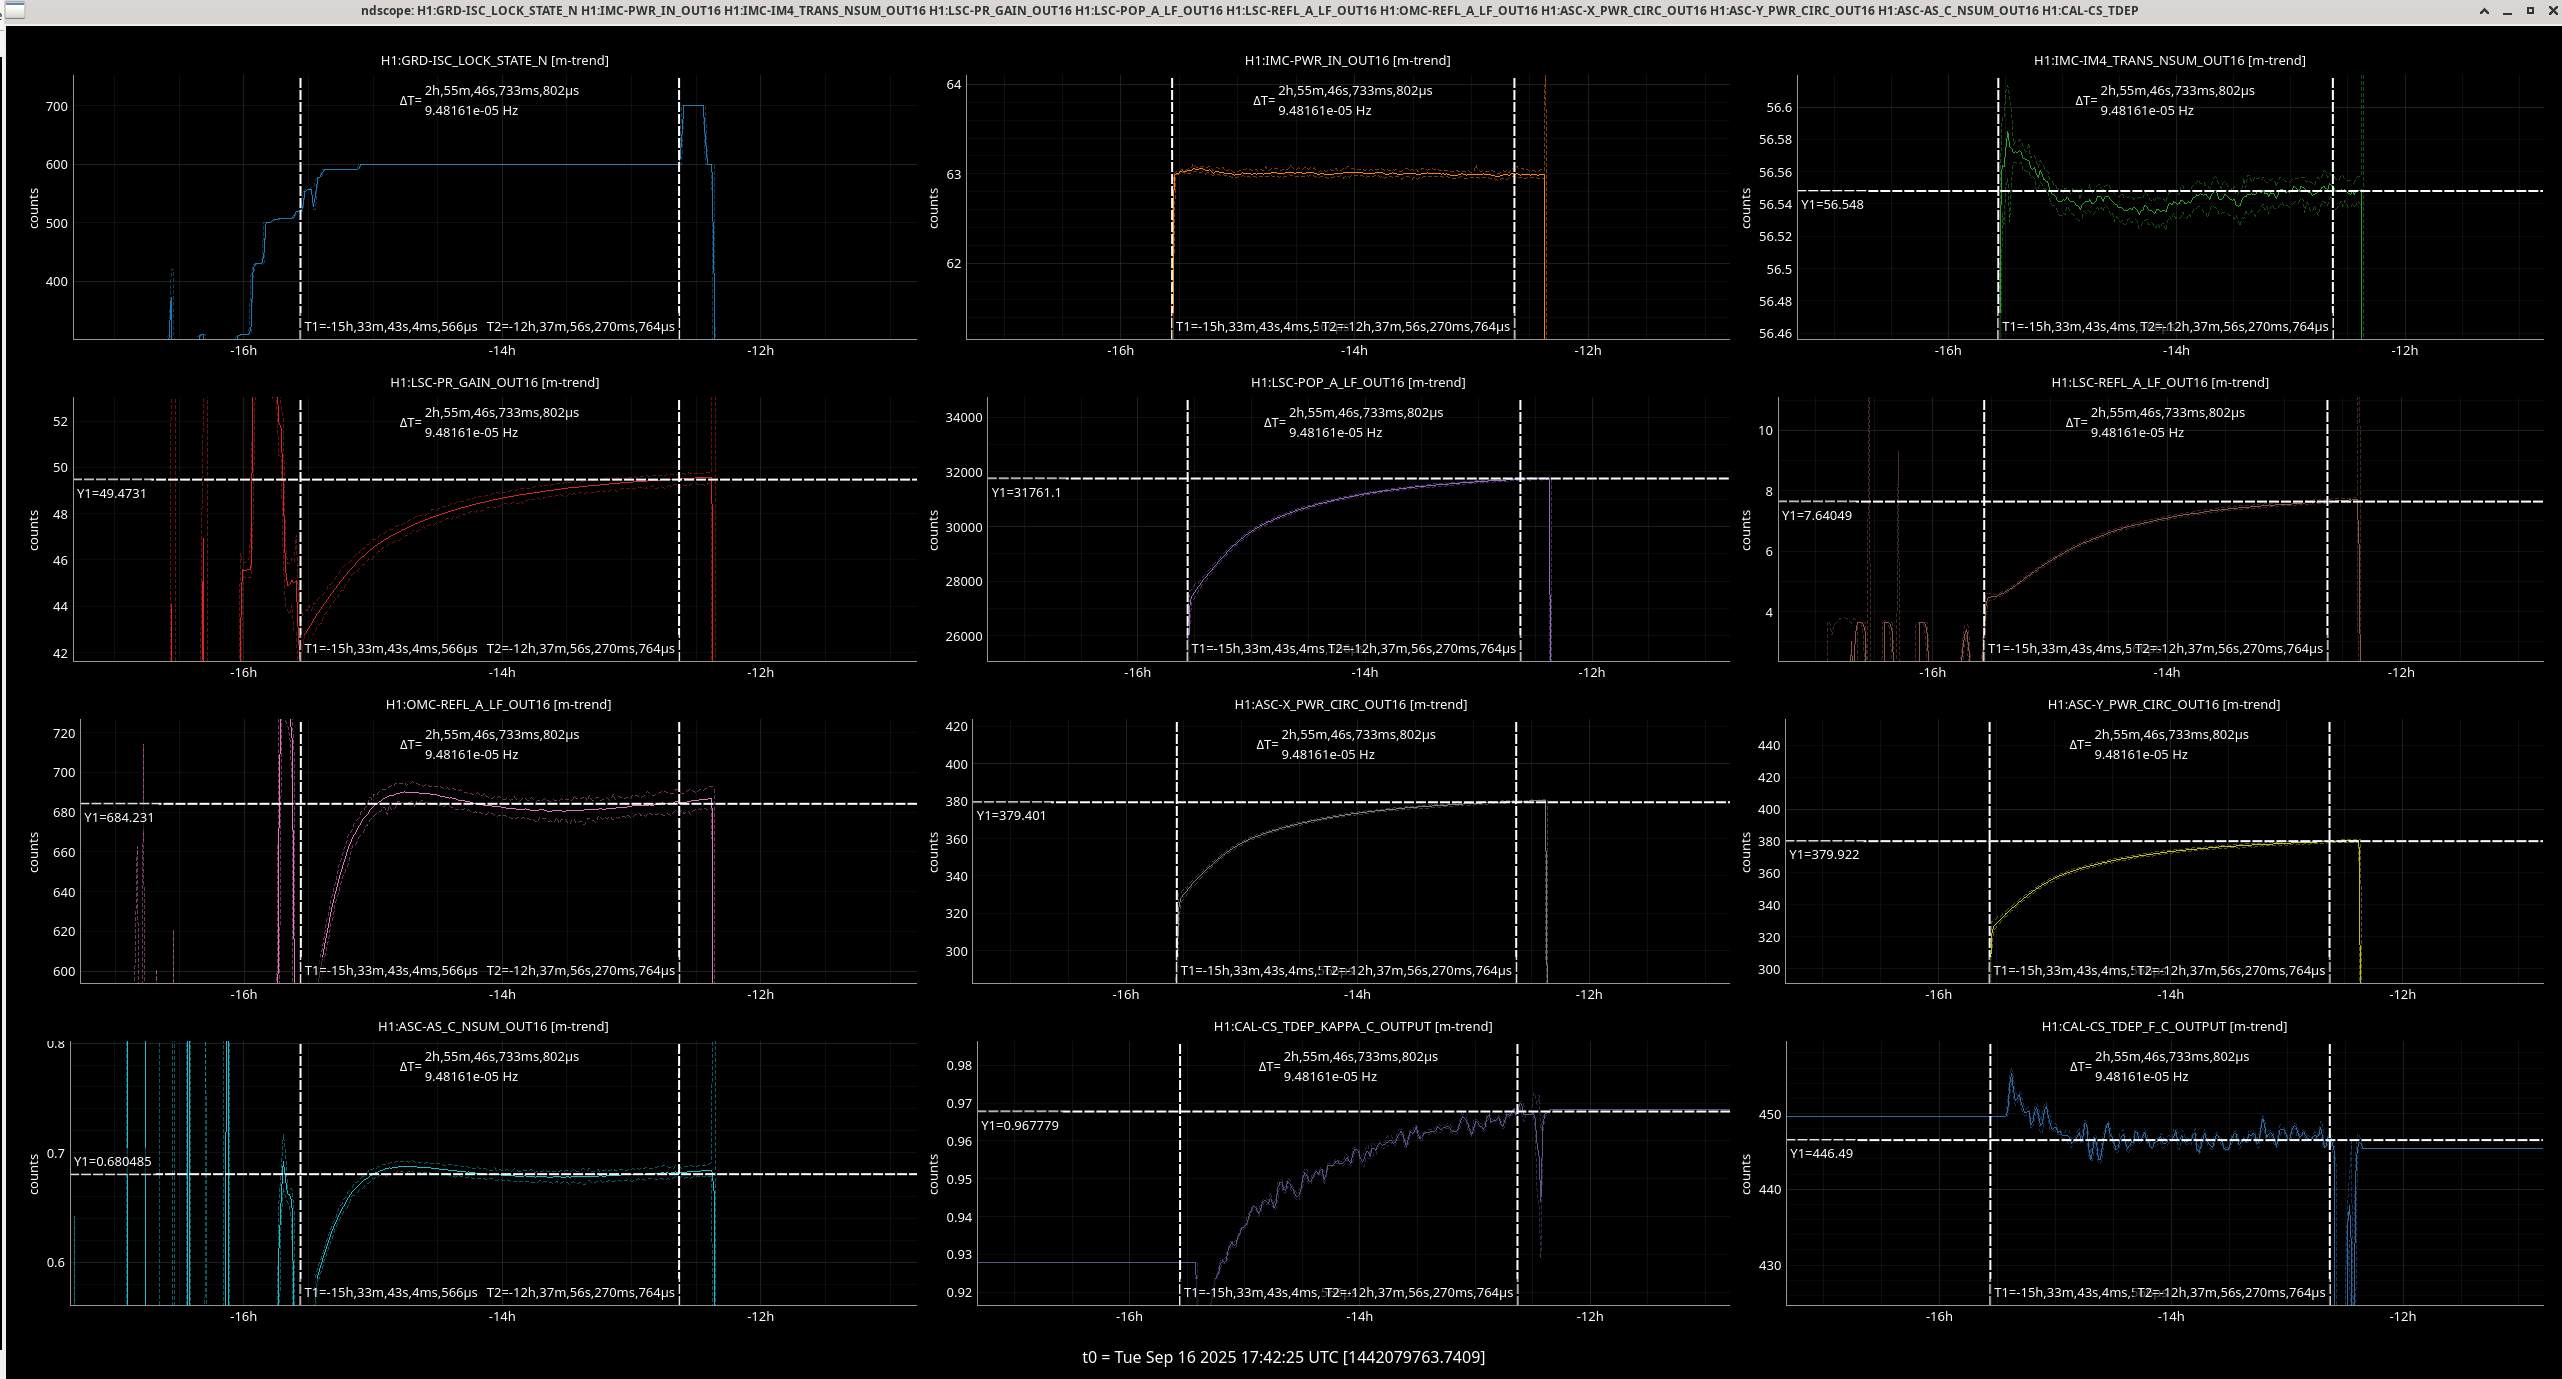
Here is a side by side of powers at the ports before and after the power outage. This is using last night's lock at 2 hours 55 minutes after the end of the max power, versus a lock before the power outage at 2 hours 55 minutes from max power.
| Quantity | Now | Then | Ratio (now/then) |
| IM4 trans (W on PRM) | 56.5 | 56.0 | 1.008 |
| PRG (W/W) | 49.5 | 49.6 | 0.997 |
| LSC POP A (mW on diode) | 31.76 | 31.58 | 1.006 |
| LSC REFL A (mW on diode) | 7.64 | 7.59 | 1.006 |
| OMC REFL (mW?) | 684.2 | 698.0 | 0.980 |
| X arm circ (kW) | 379.4 | 376.2 | 1.008 |
| Y arm circ (kW) | 379.9 | 375.8 | 1.01 |
| AS_C (W into HAM6) | 0.680 | 0.695 | 0.978 |
| kappa_c | 0.967 | 0.988 | 0.979 |
| f_c (Hz) | 446.5 | 445.5 |
It seems like the input power, POP, LSC REFL and circulating power numbers hang together. The OMC refl, as AS_C numbers also hang together. Sheila and I discussed that we would expect if the arm power increased the kappa c would increase, but it appears that arm power increased but kappa c decreased following the OMC refl and AS_C values.
Images attached to this report