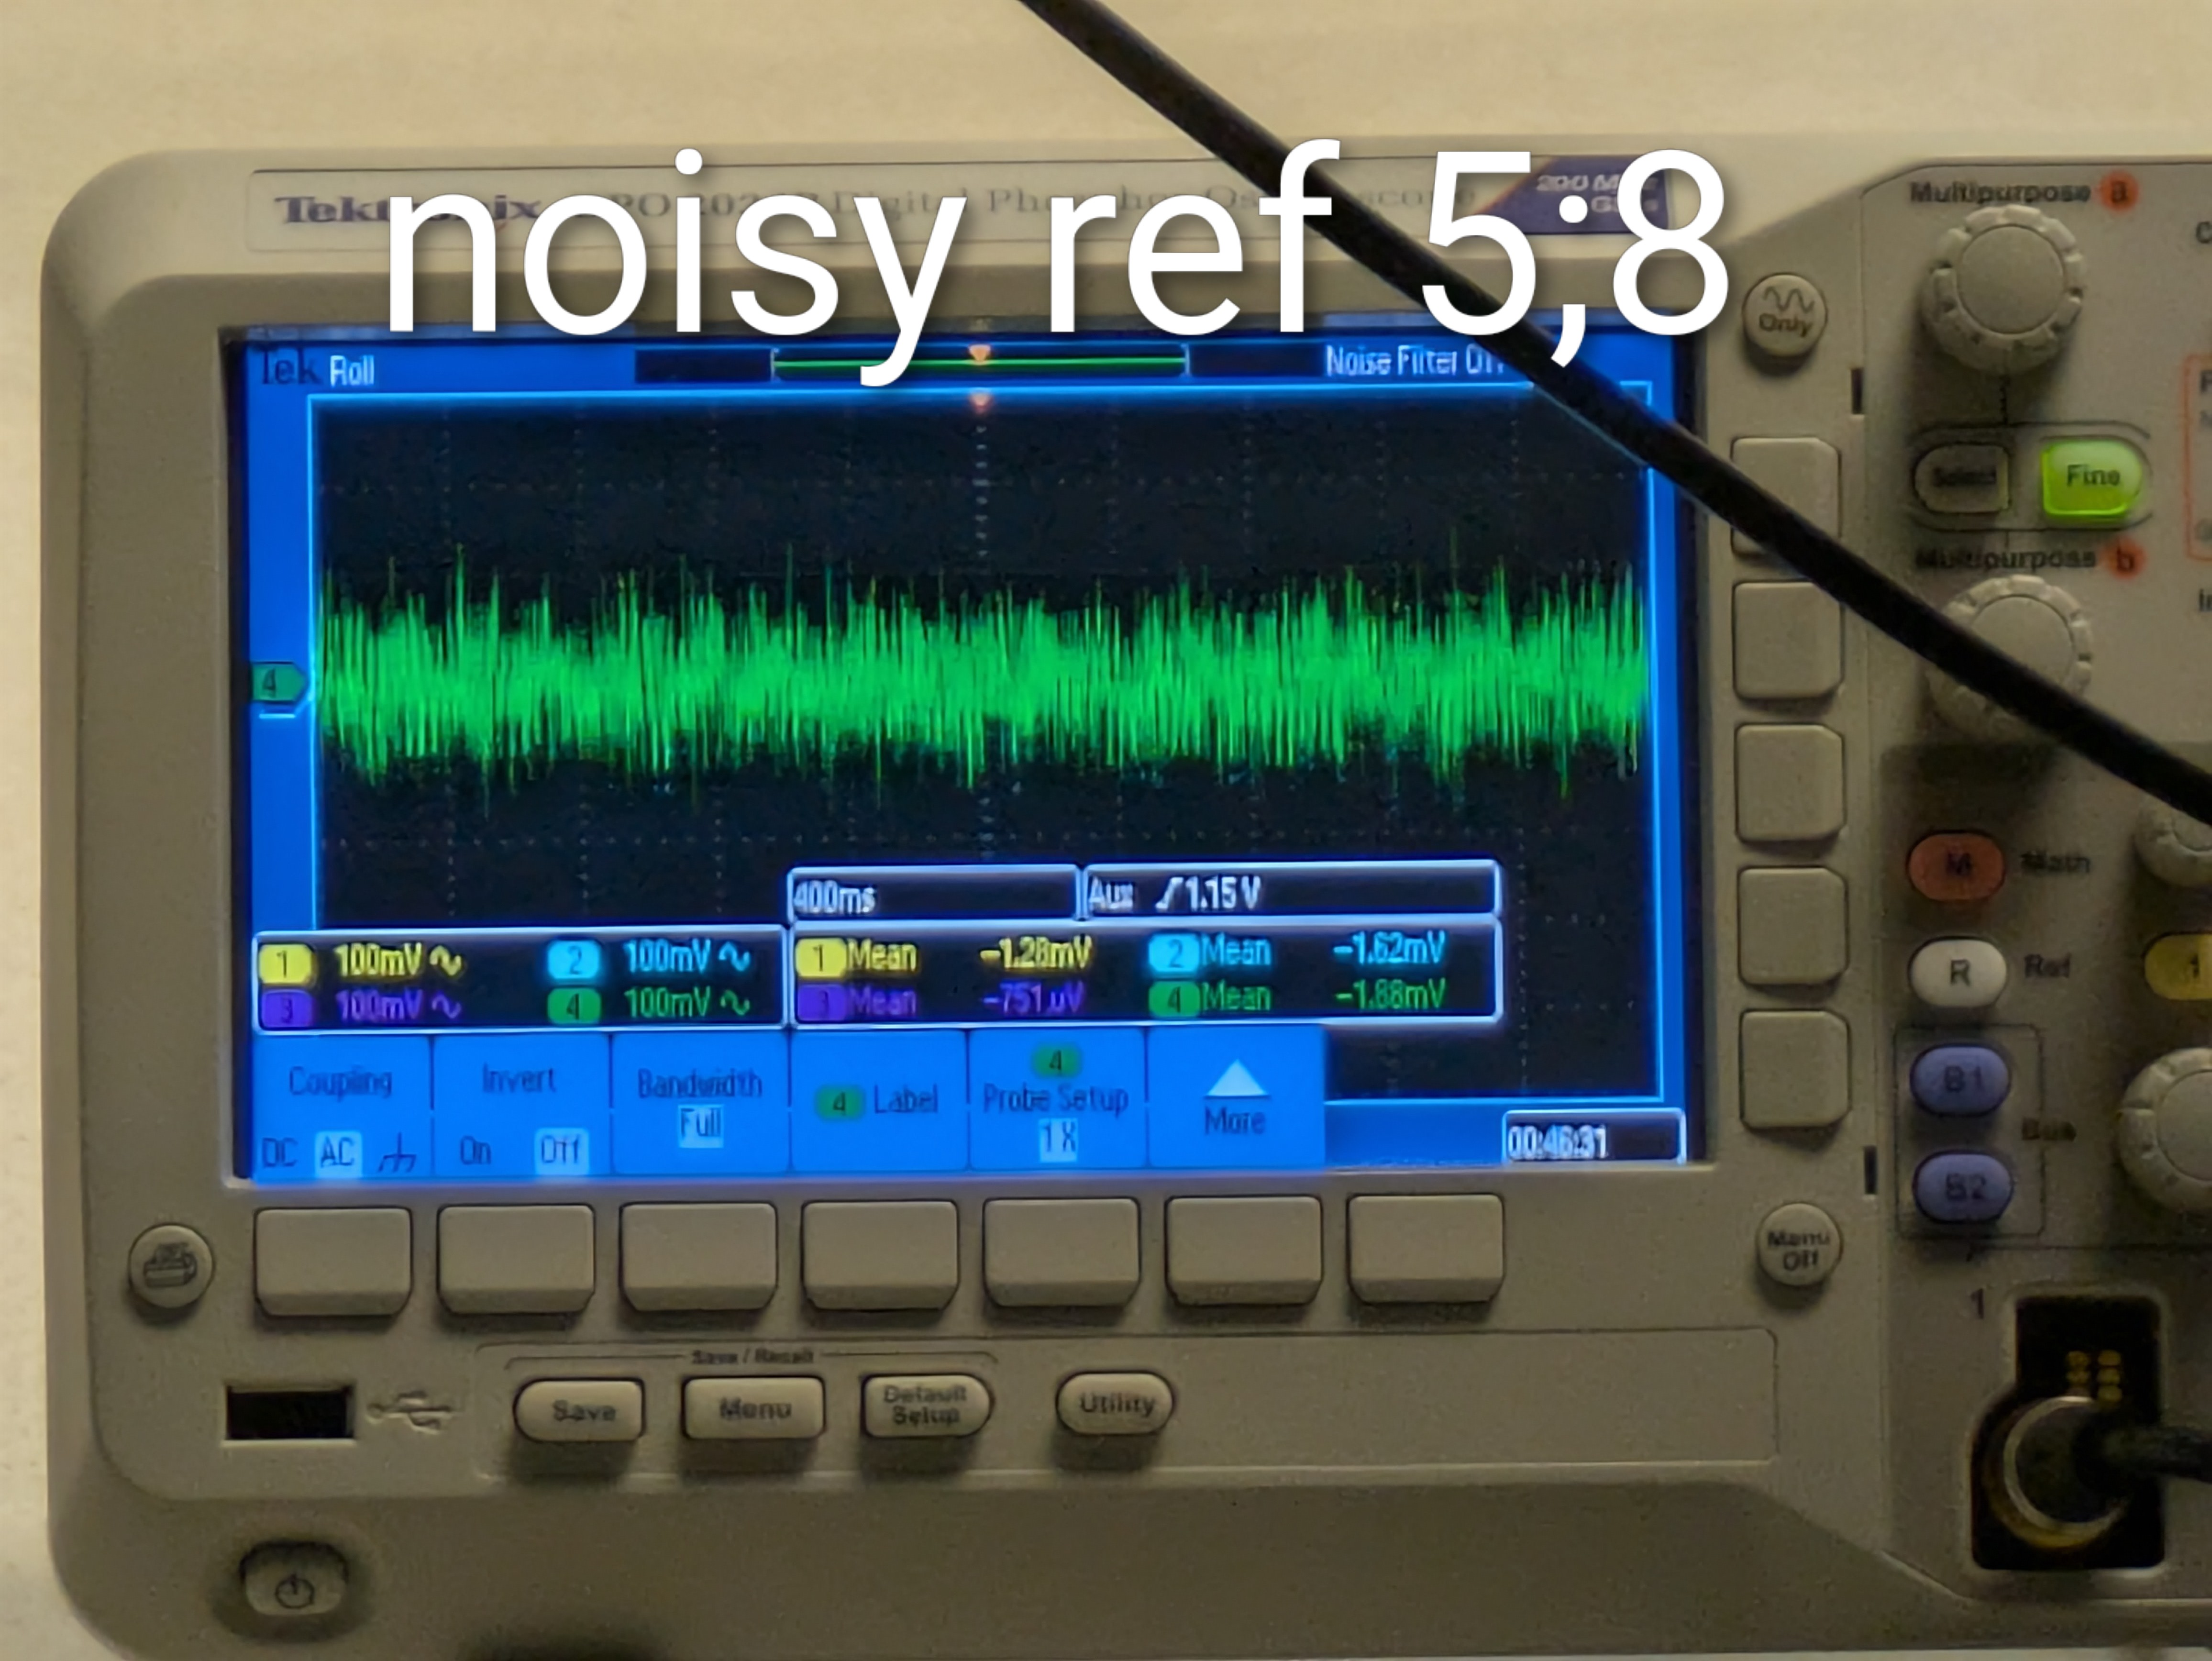
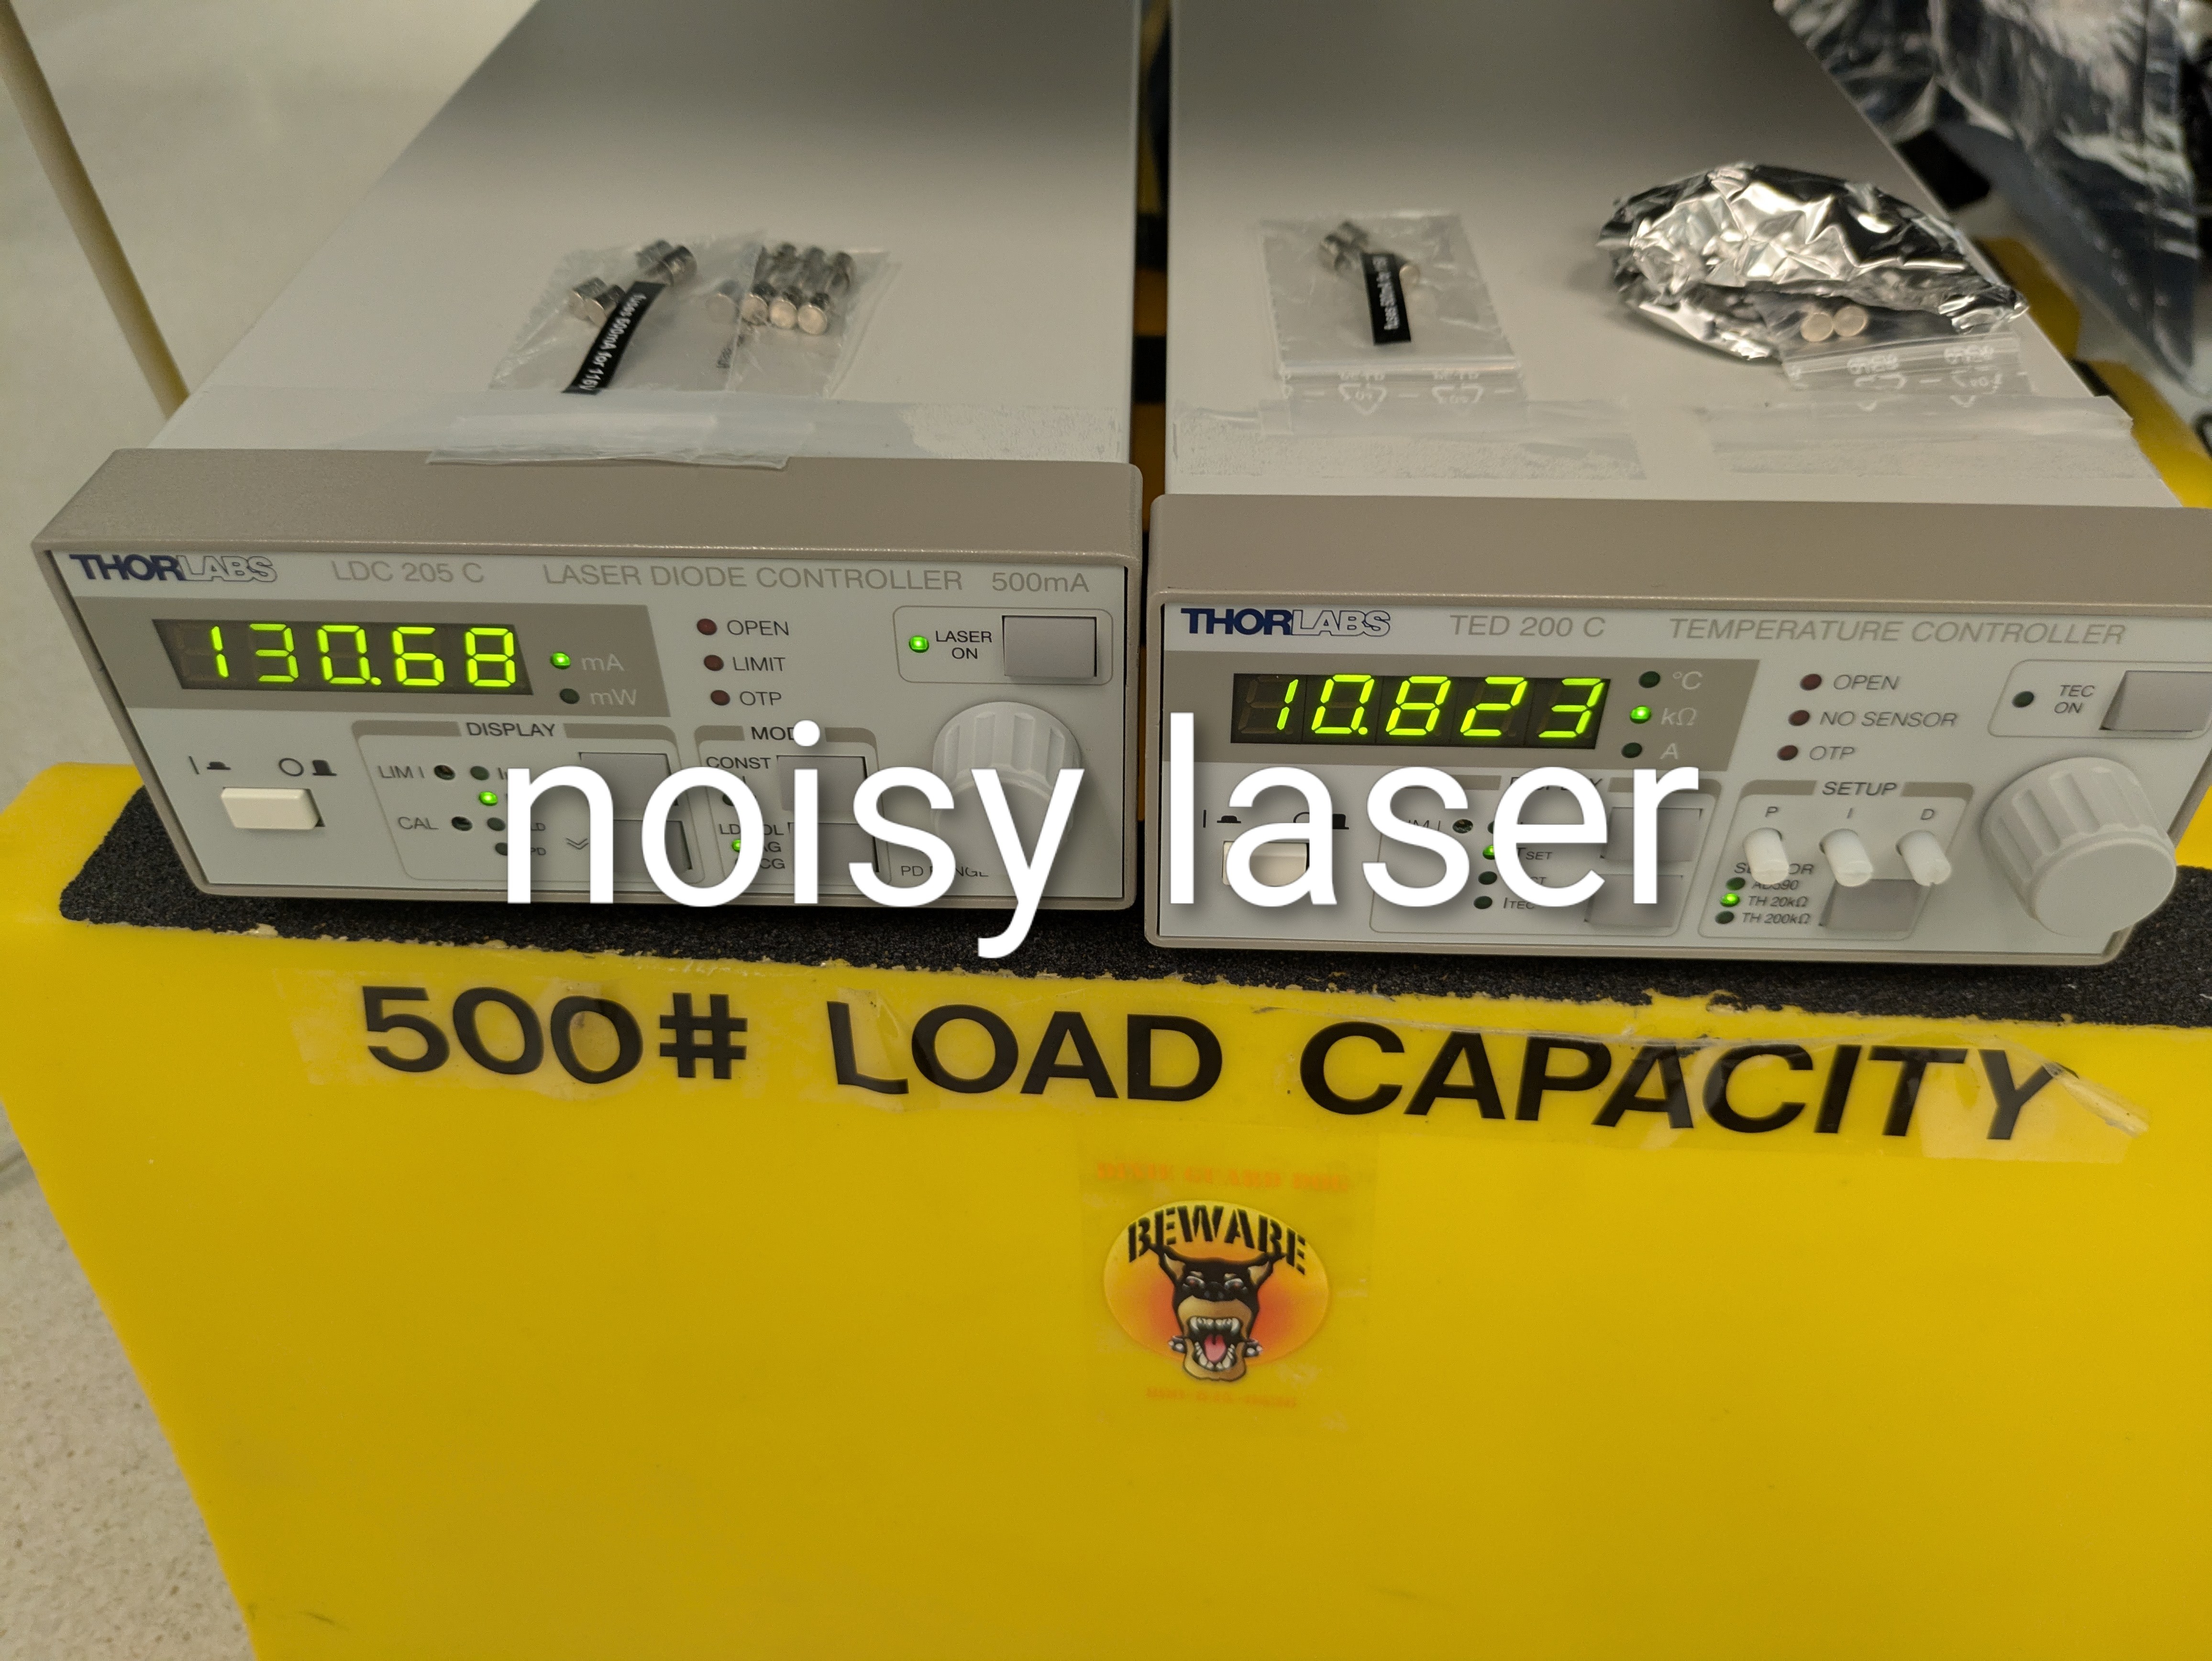
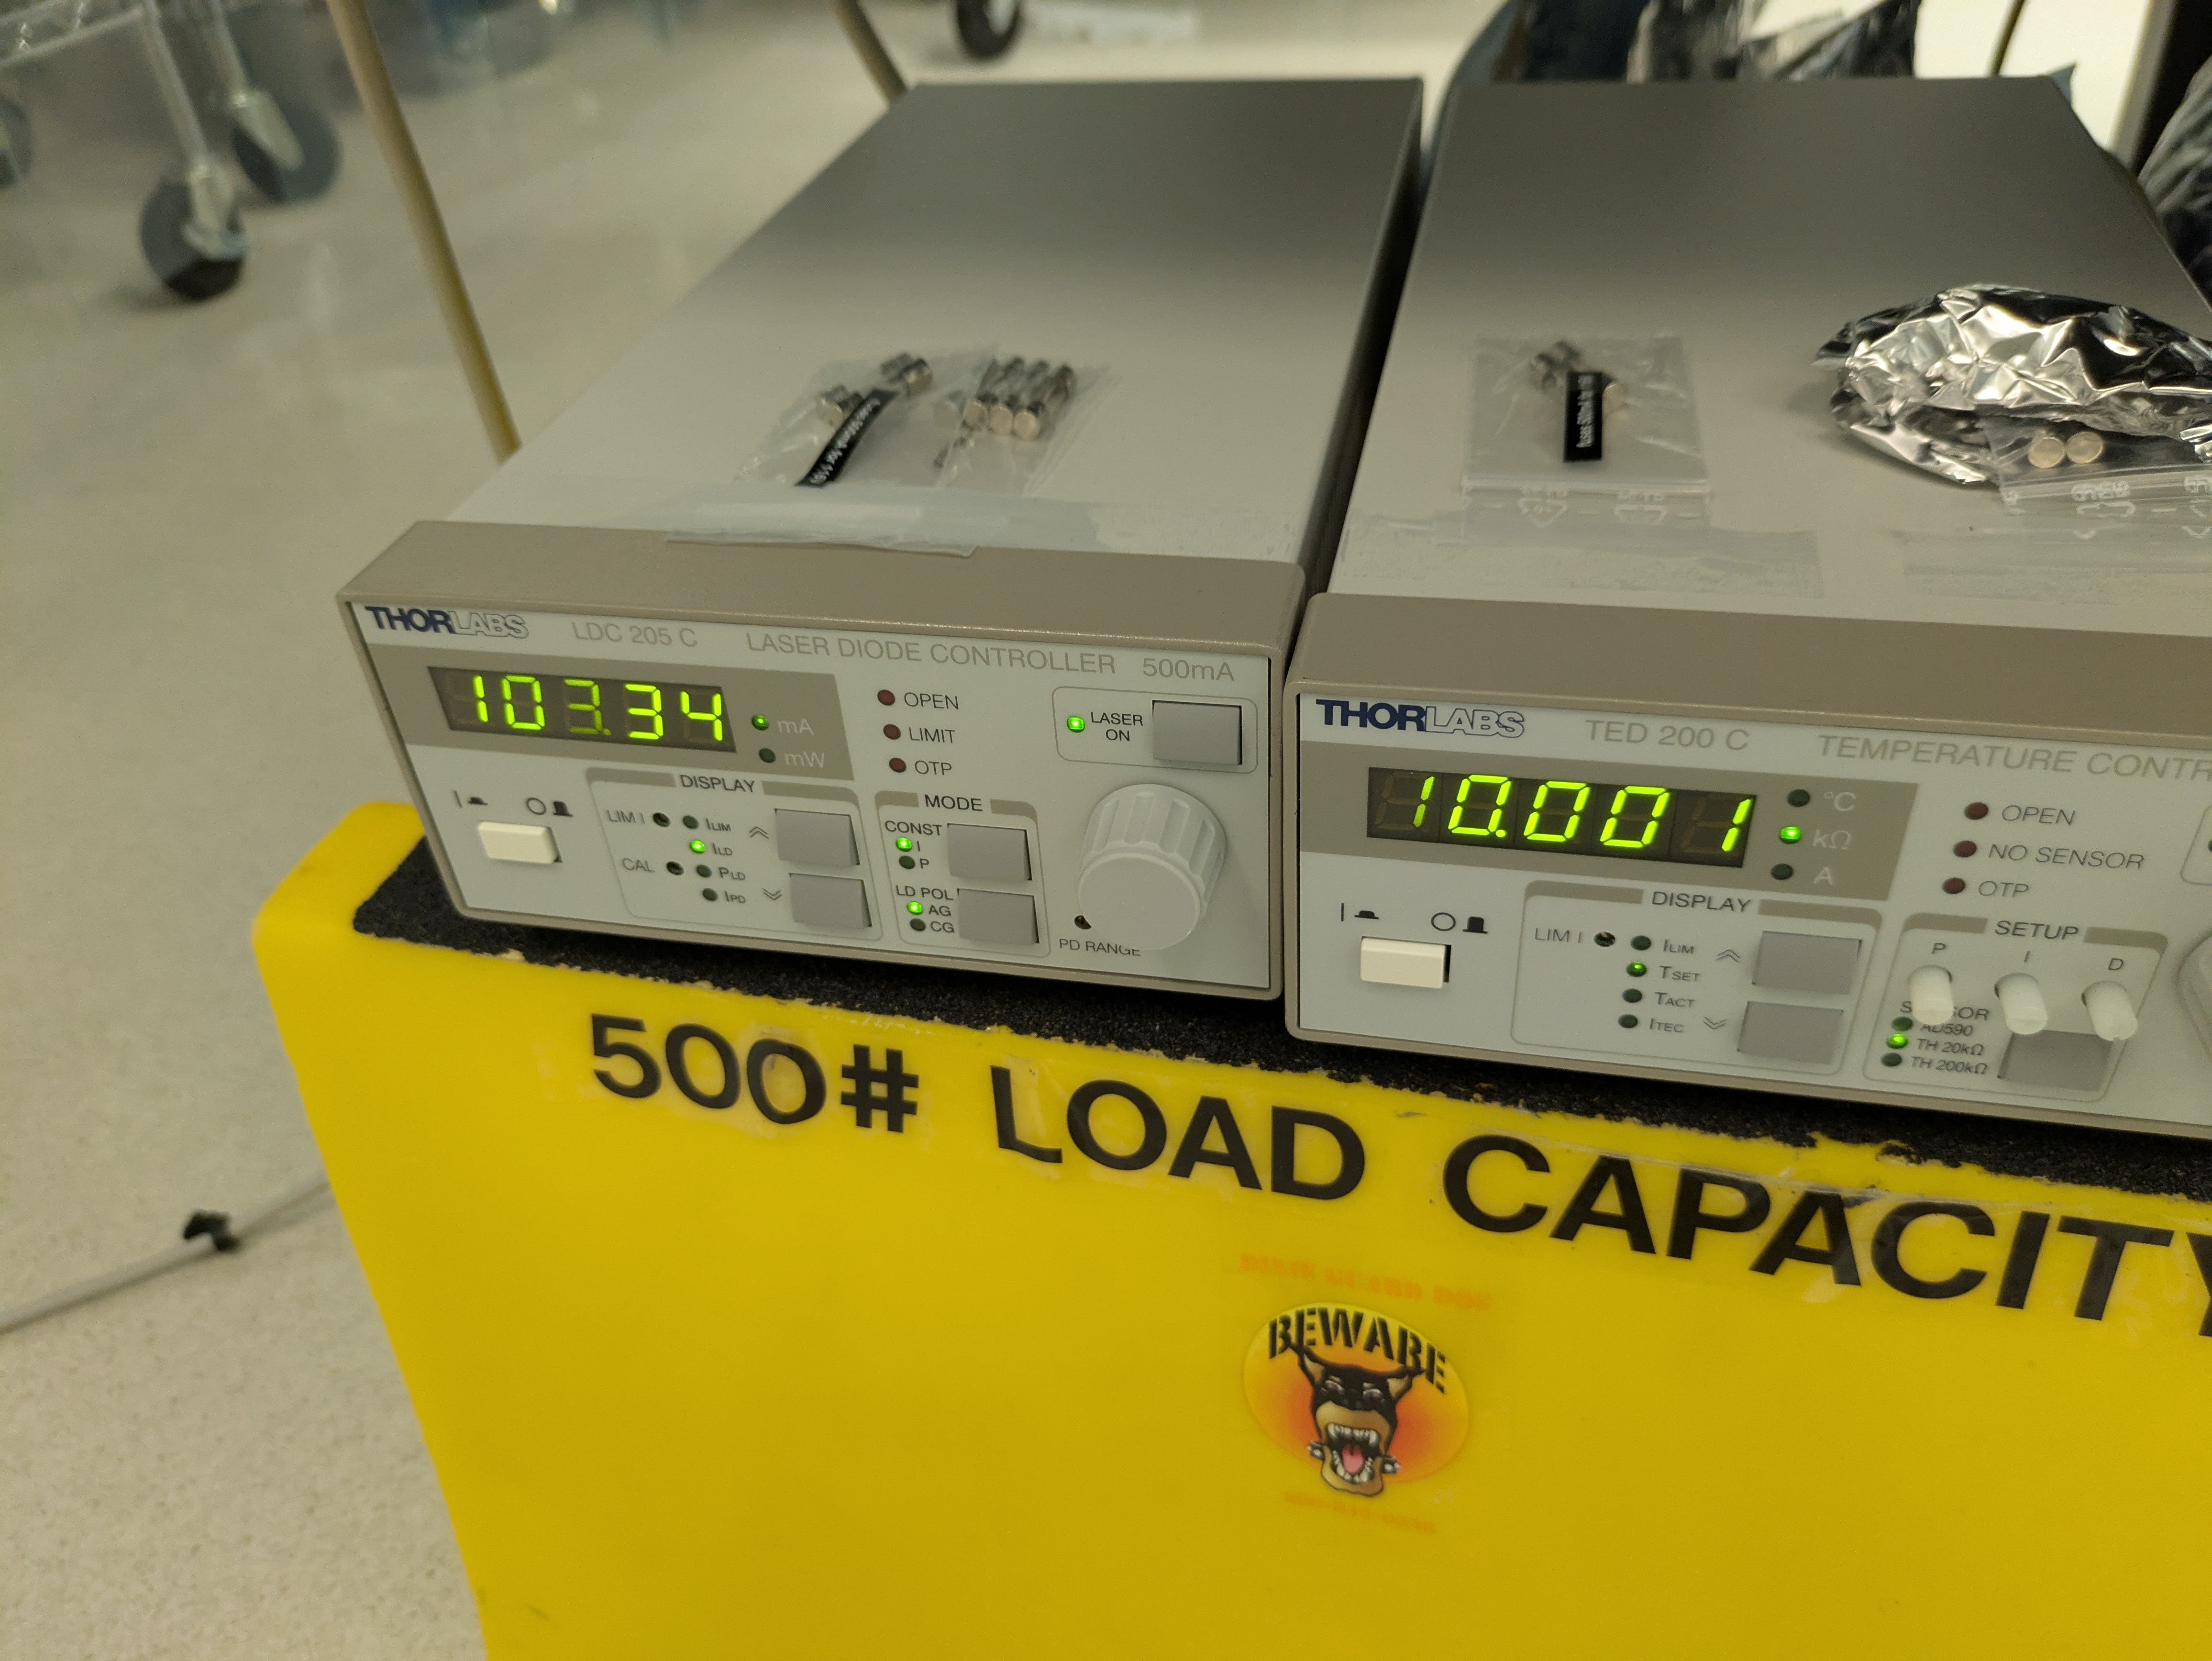
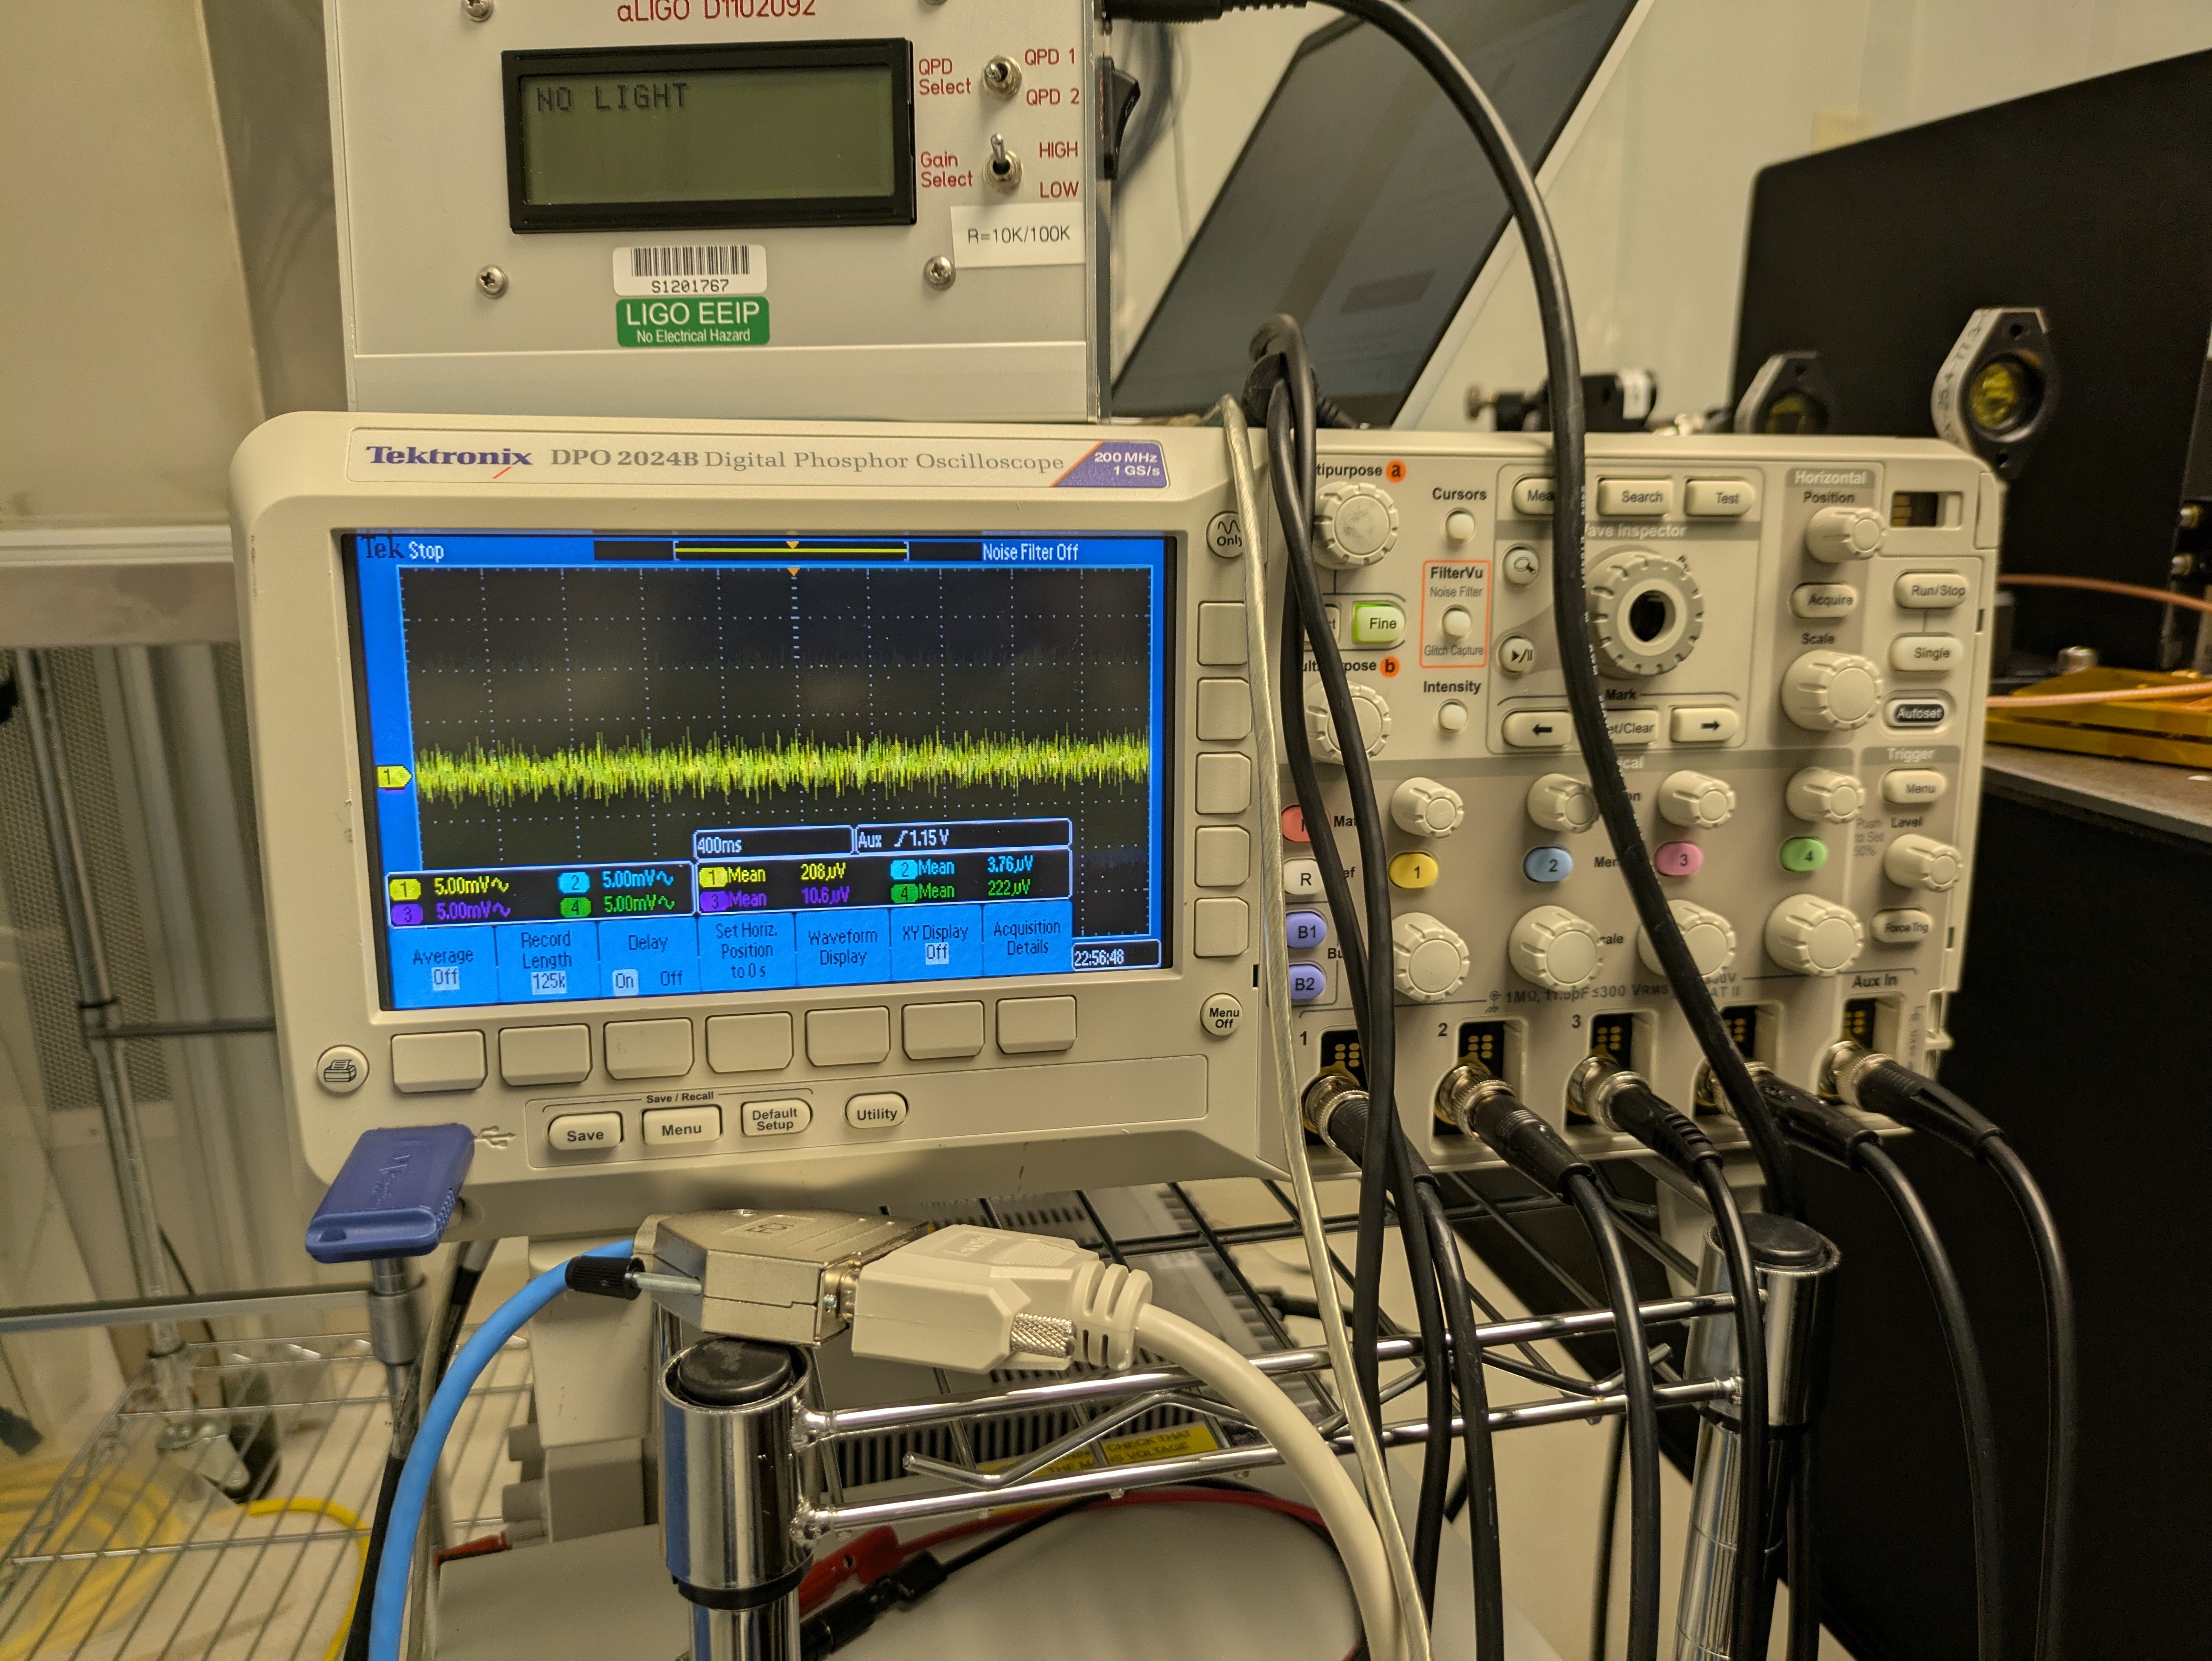
Yesterday I went into the optics lab and re-measured the coupling between input beam motion and PD array. While taking measurements I noticed that the injection could not be seen on the AC readouts of the PDs (example) so I tuned the temperature of the laser via changing the resistance of the controller, I went from ~10kOhms up to 13 kOHms and down to 8kOhms and while I found places where the noise reduced see example of noisy trace here, I couldn't find anywhere with the controller where the trace renamed stably in the non-noisy state. I then decided to tune the pump current down from 130mA to ~100mA and eventually found a somewhat stable place. I still had to wait through some periods of noise to trigger the measurement of the PDs.
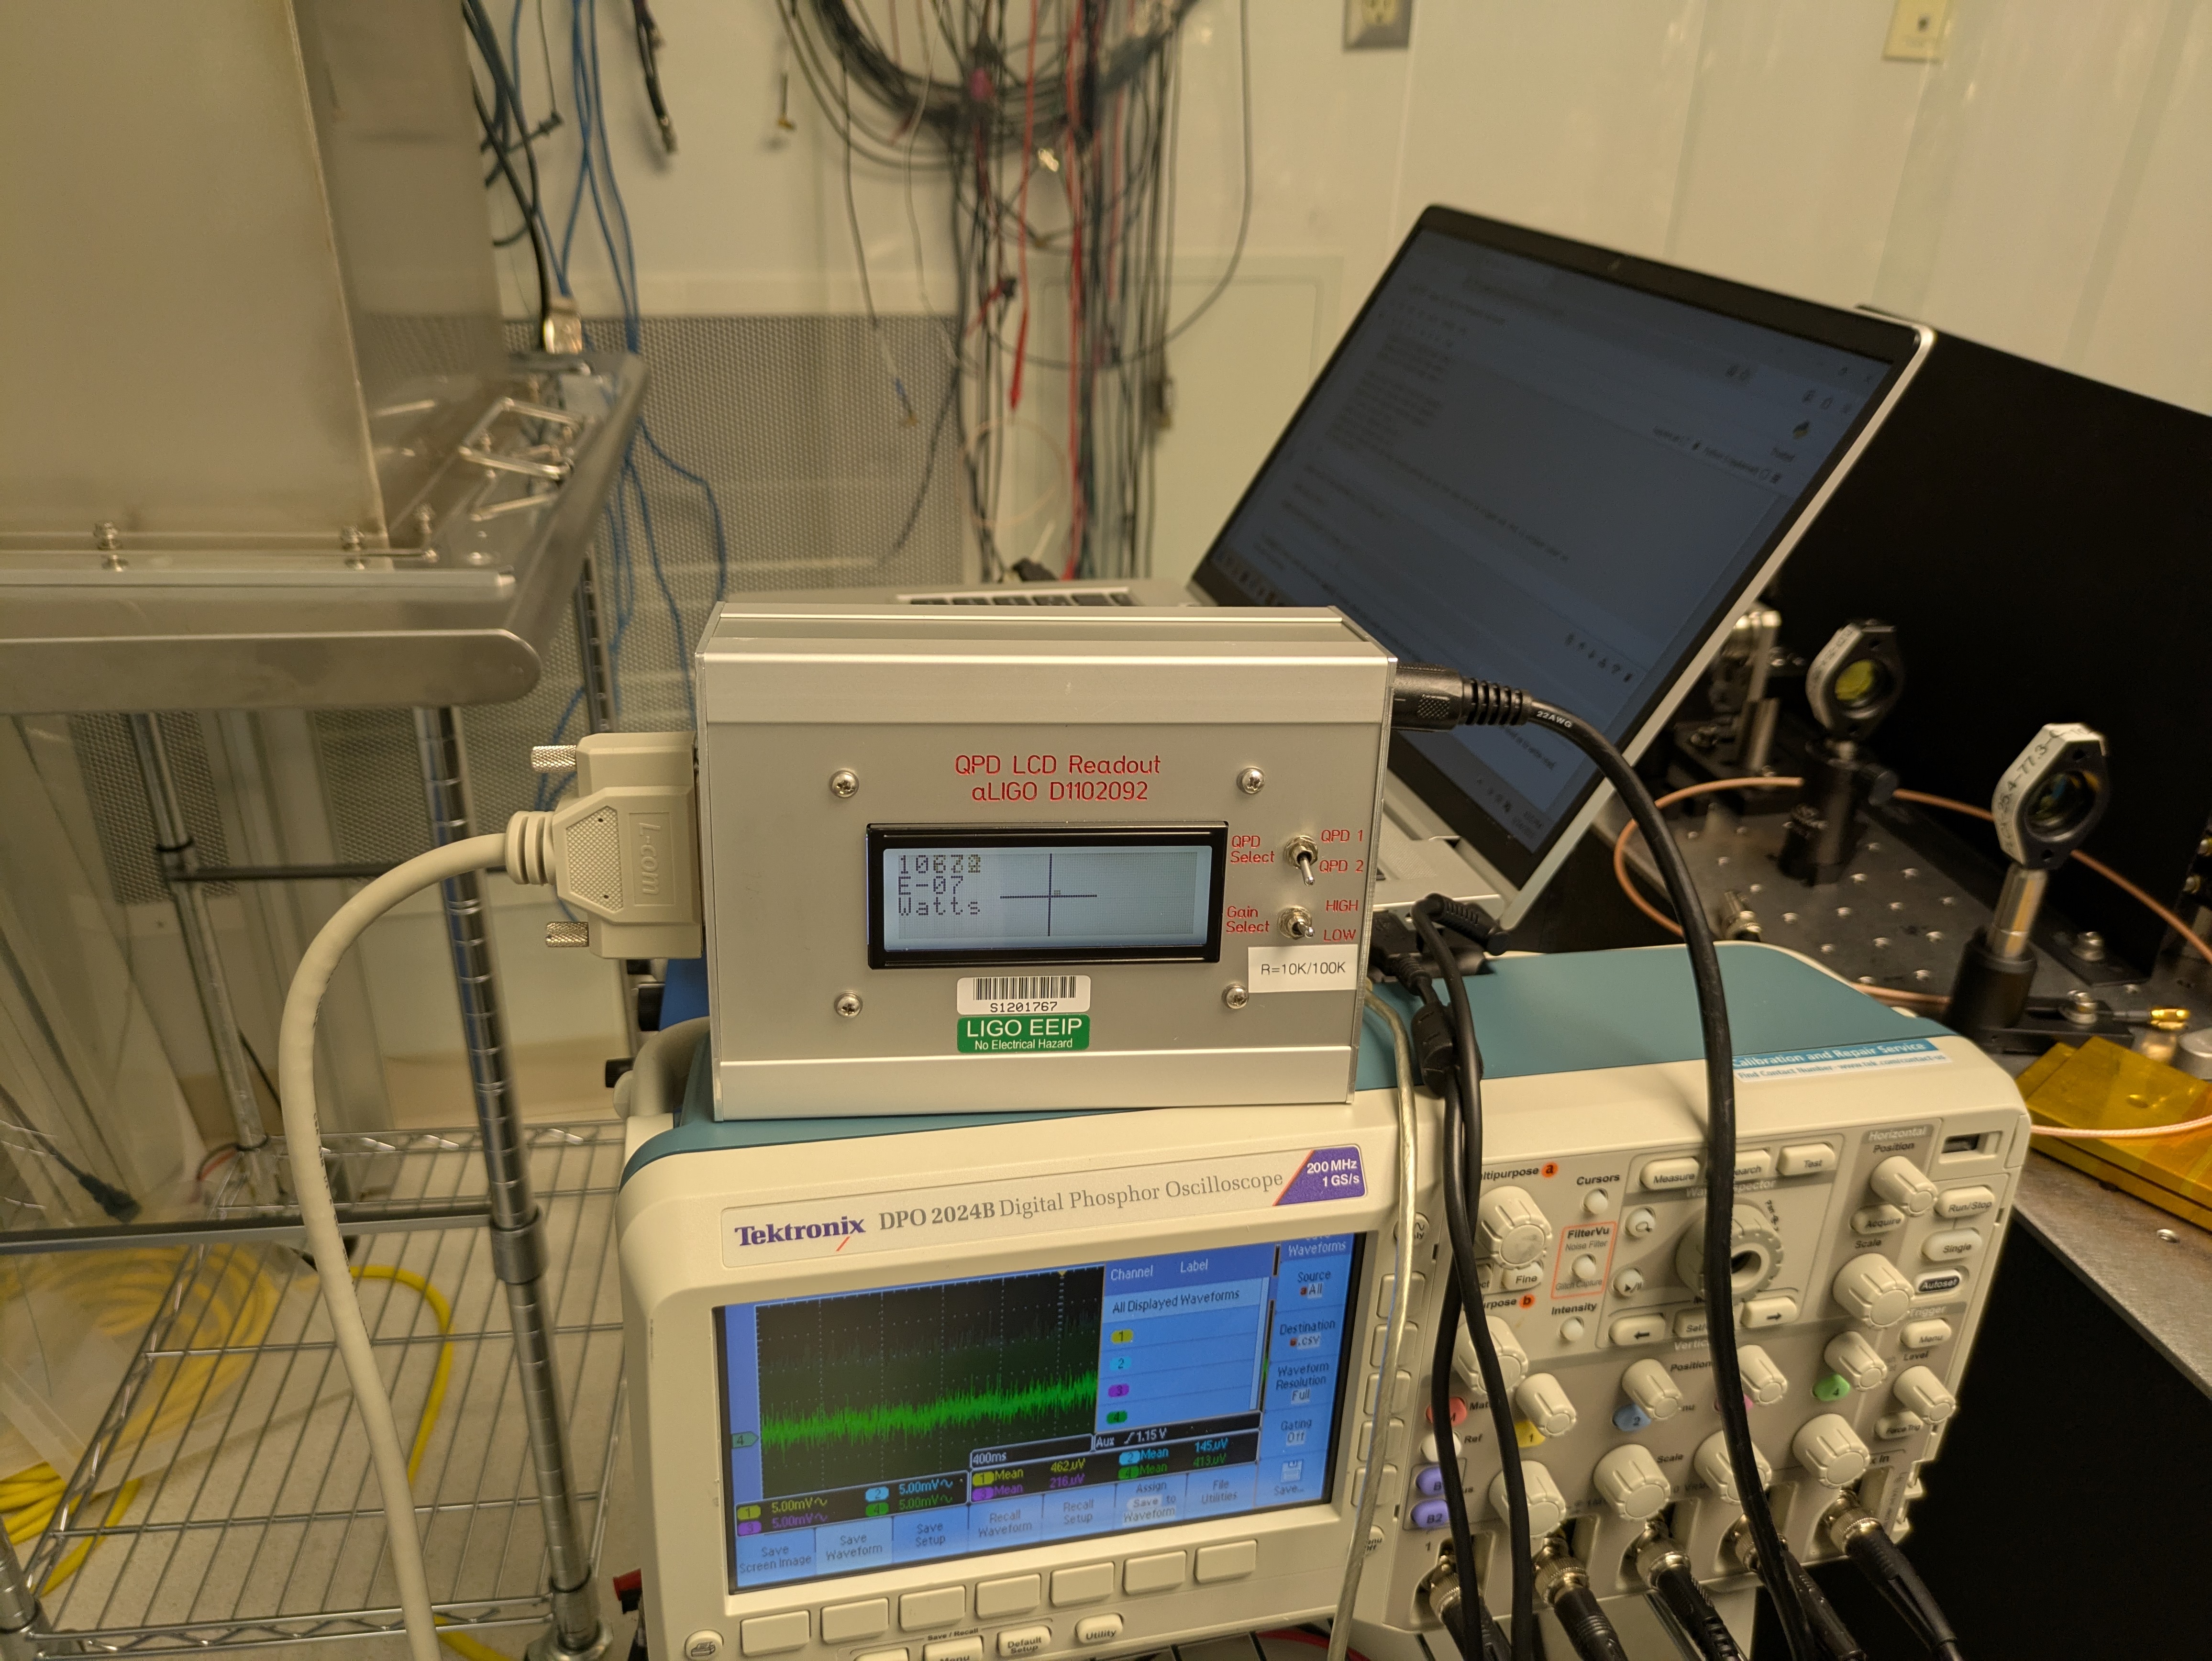
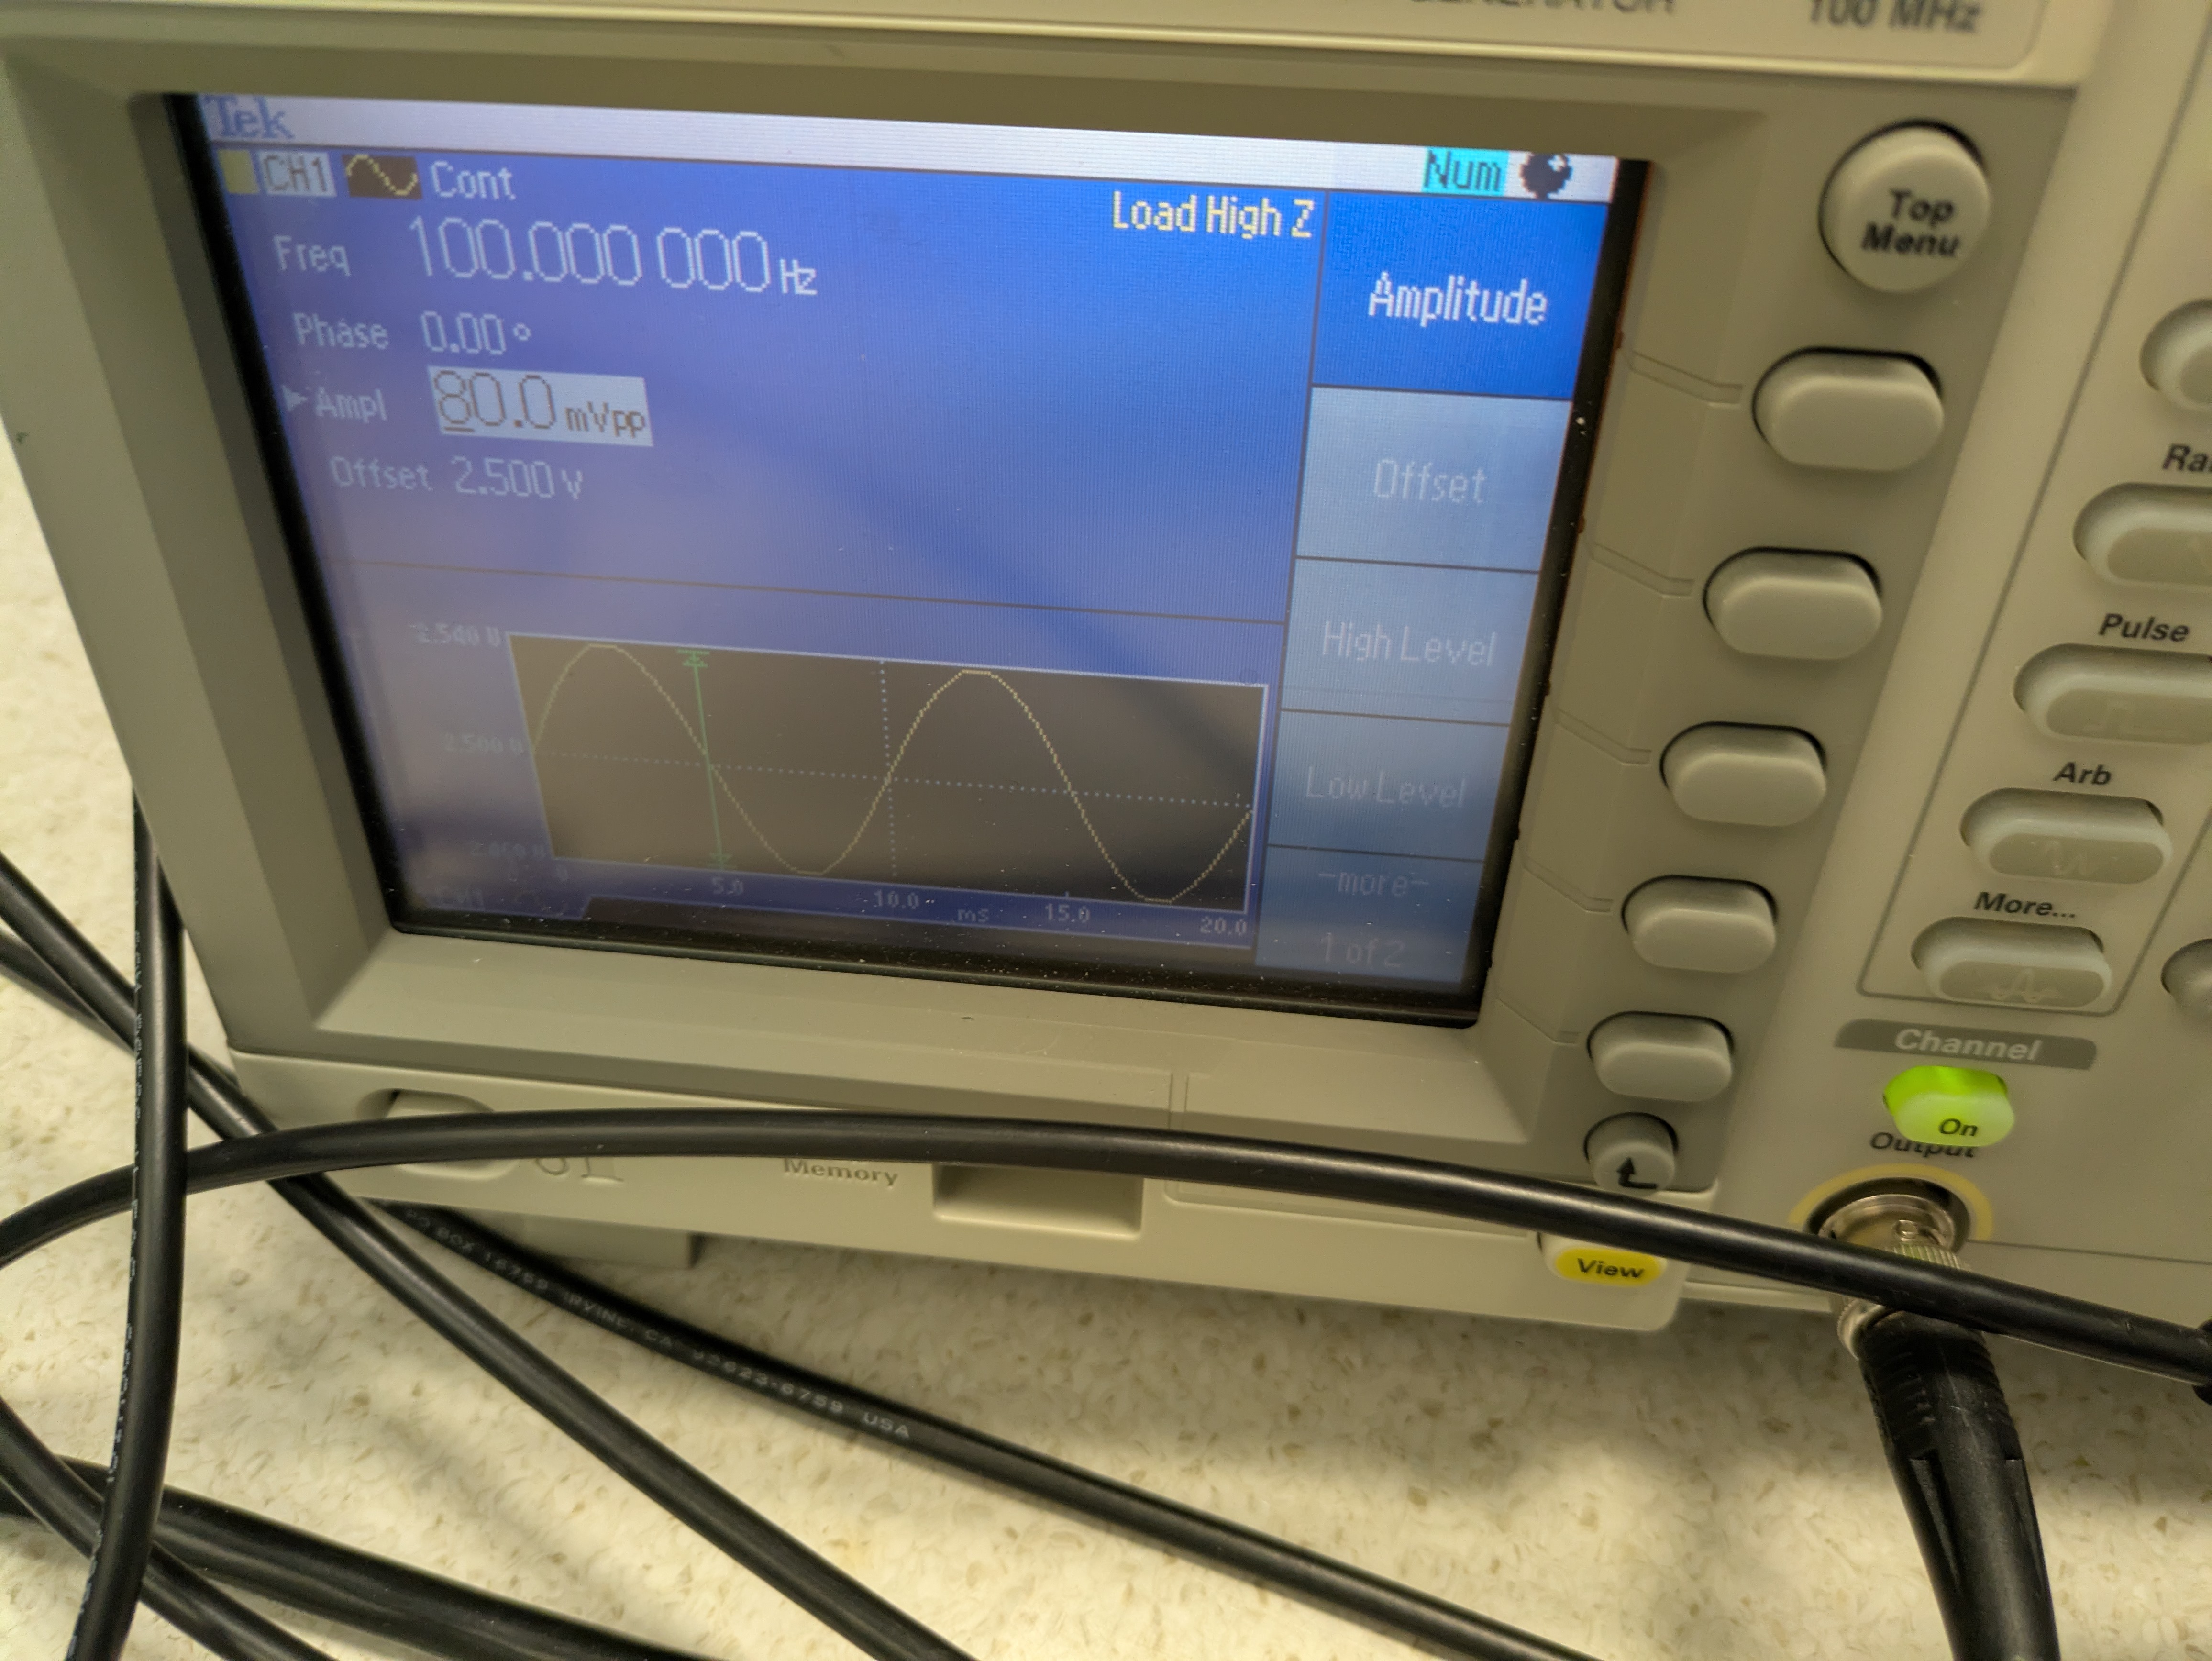
I alos increased the modulation ampltitude to 80 mVpp. The counts on the QPD LCD readout were 10672, see image.
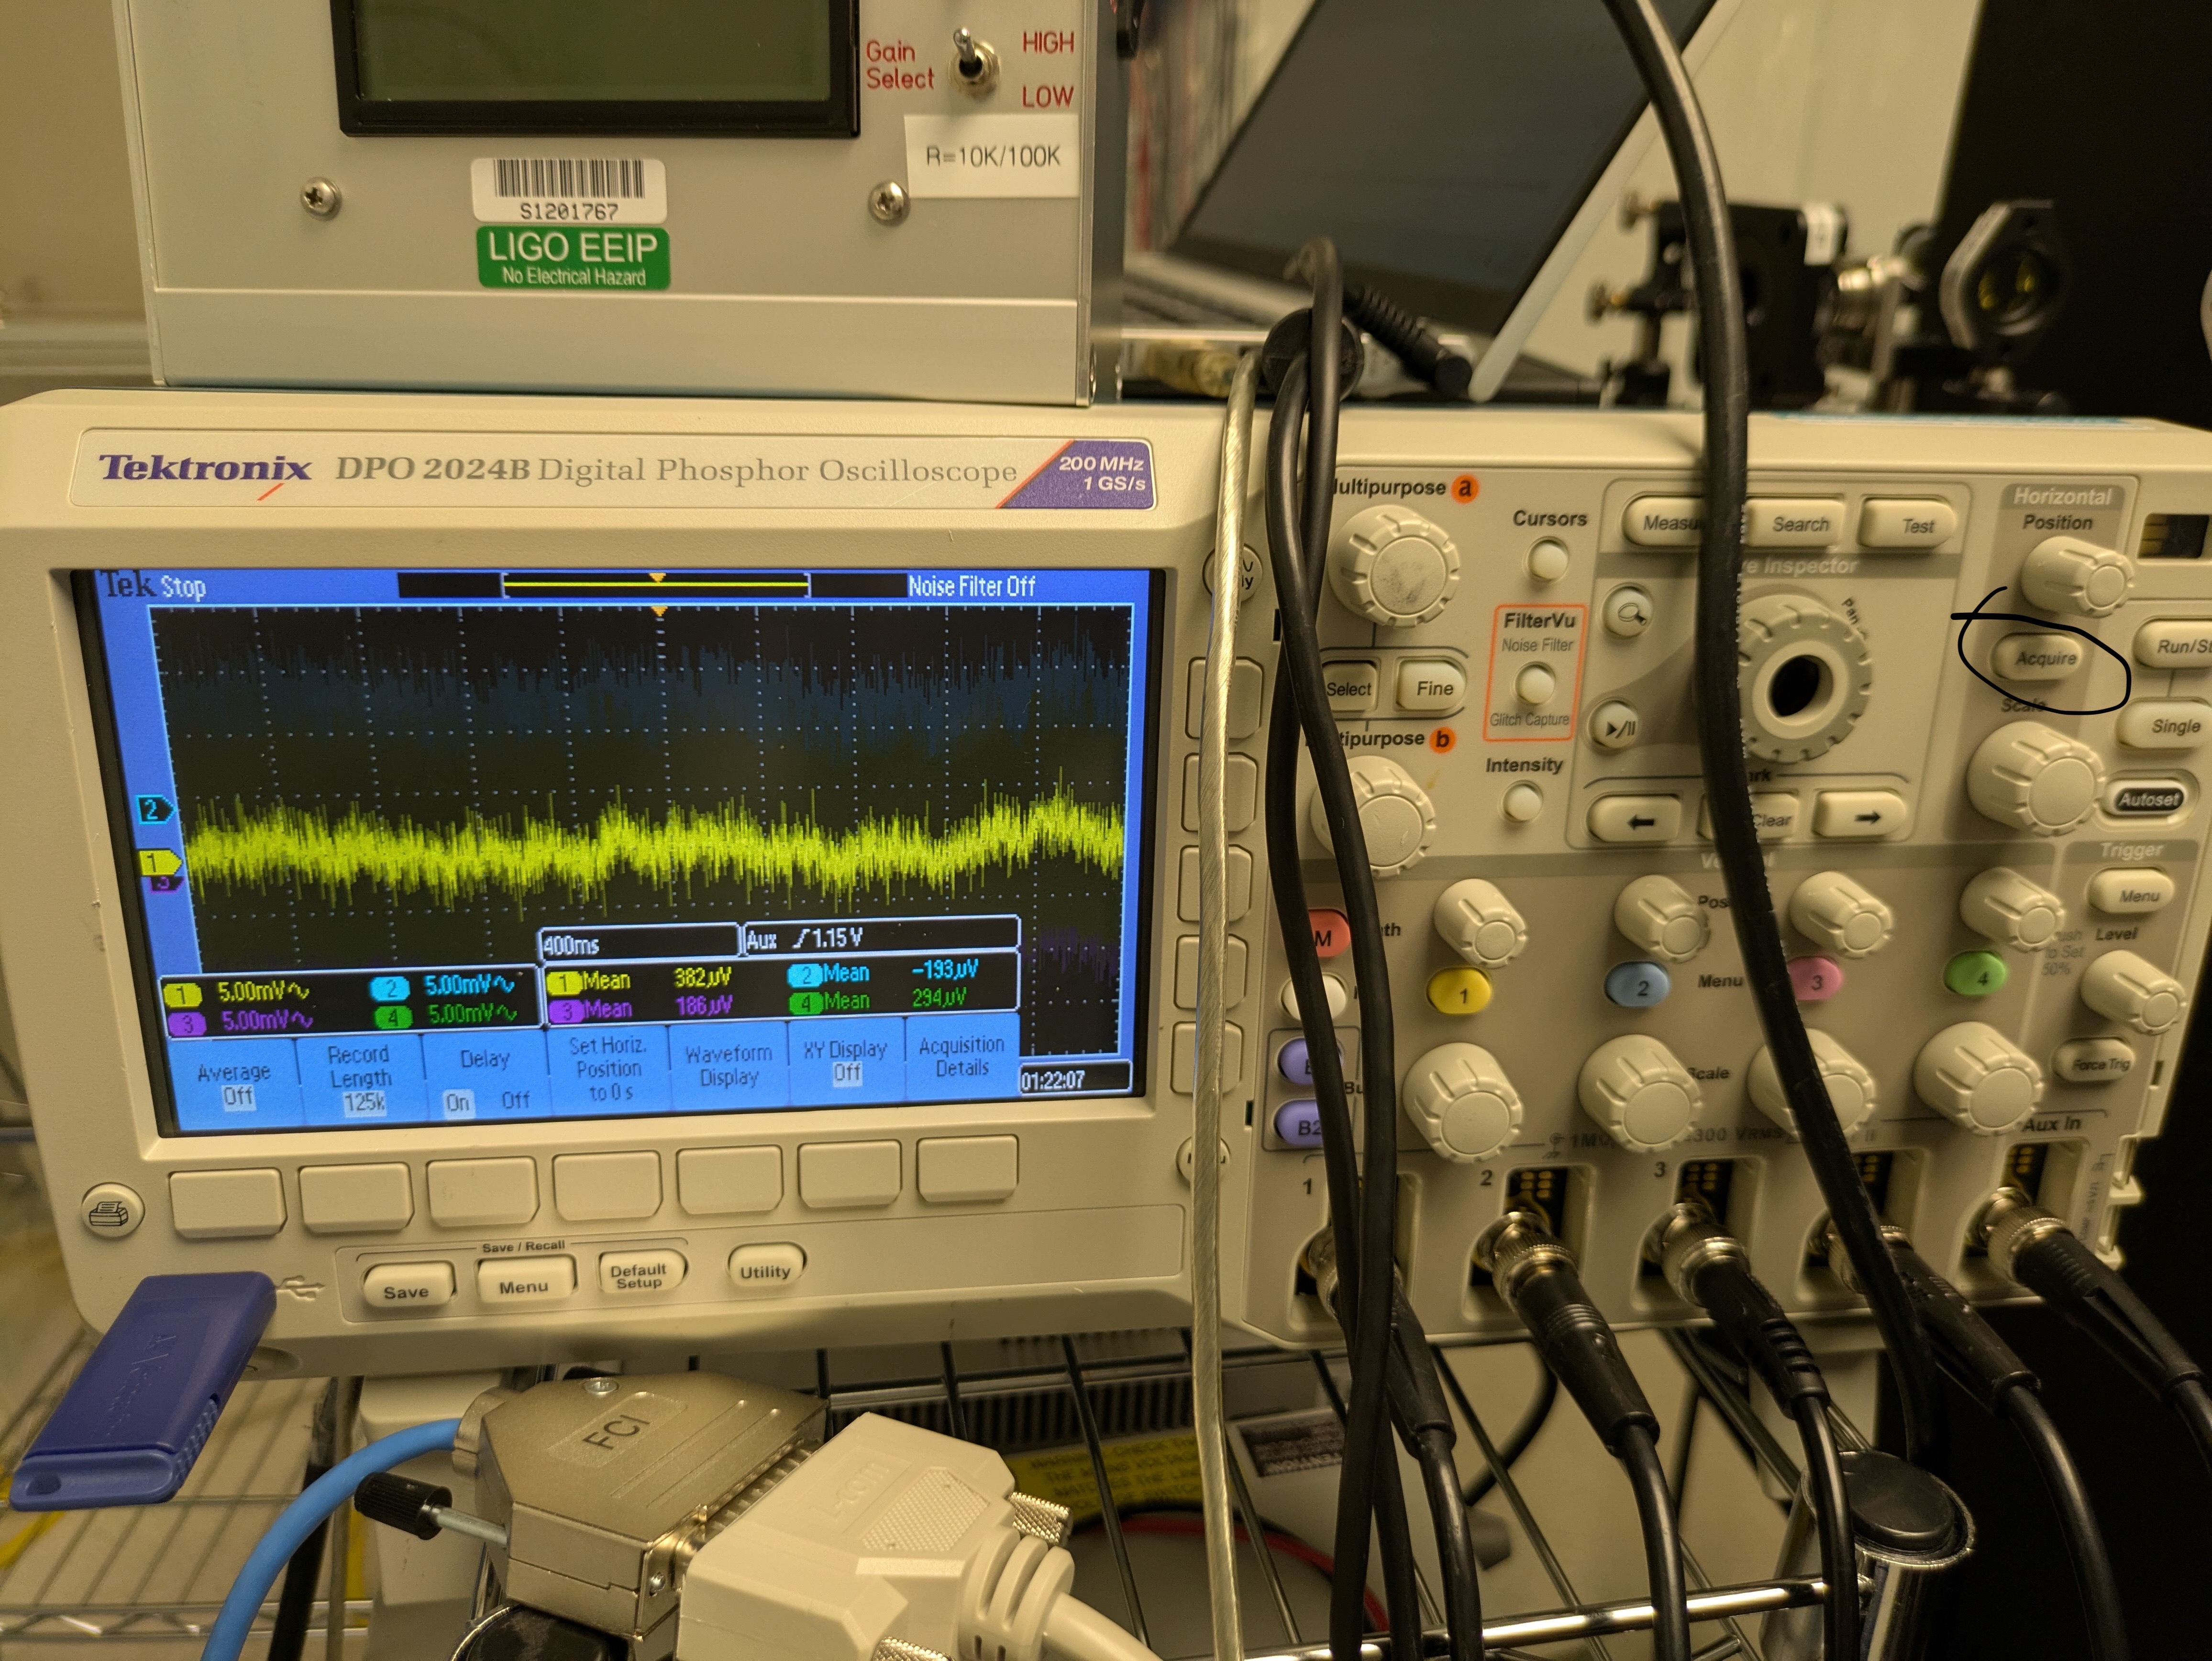
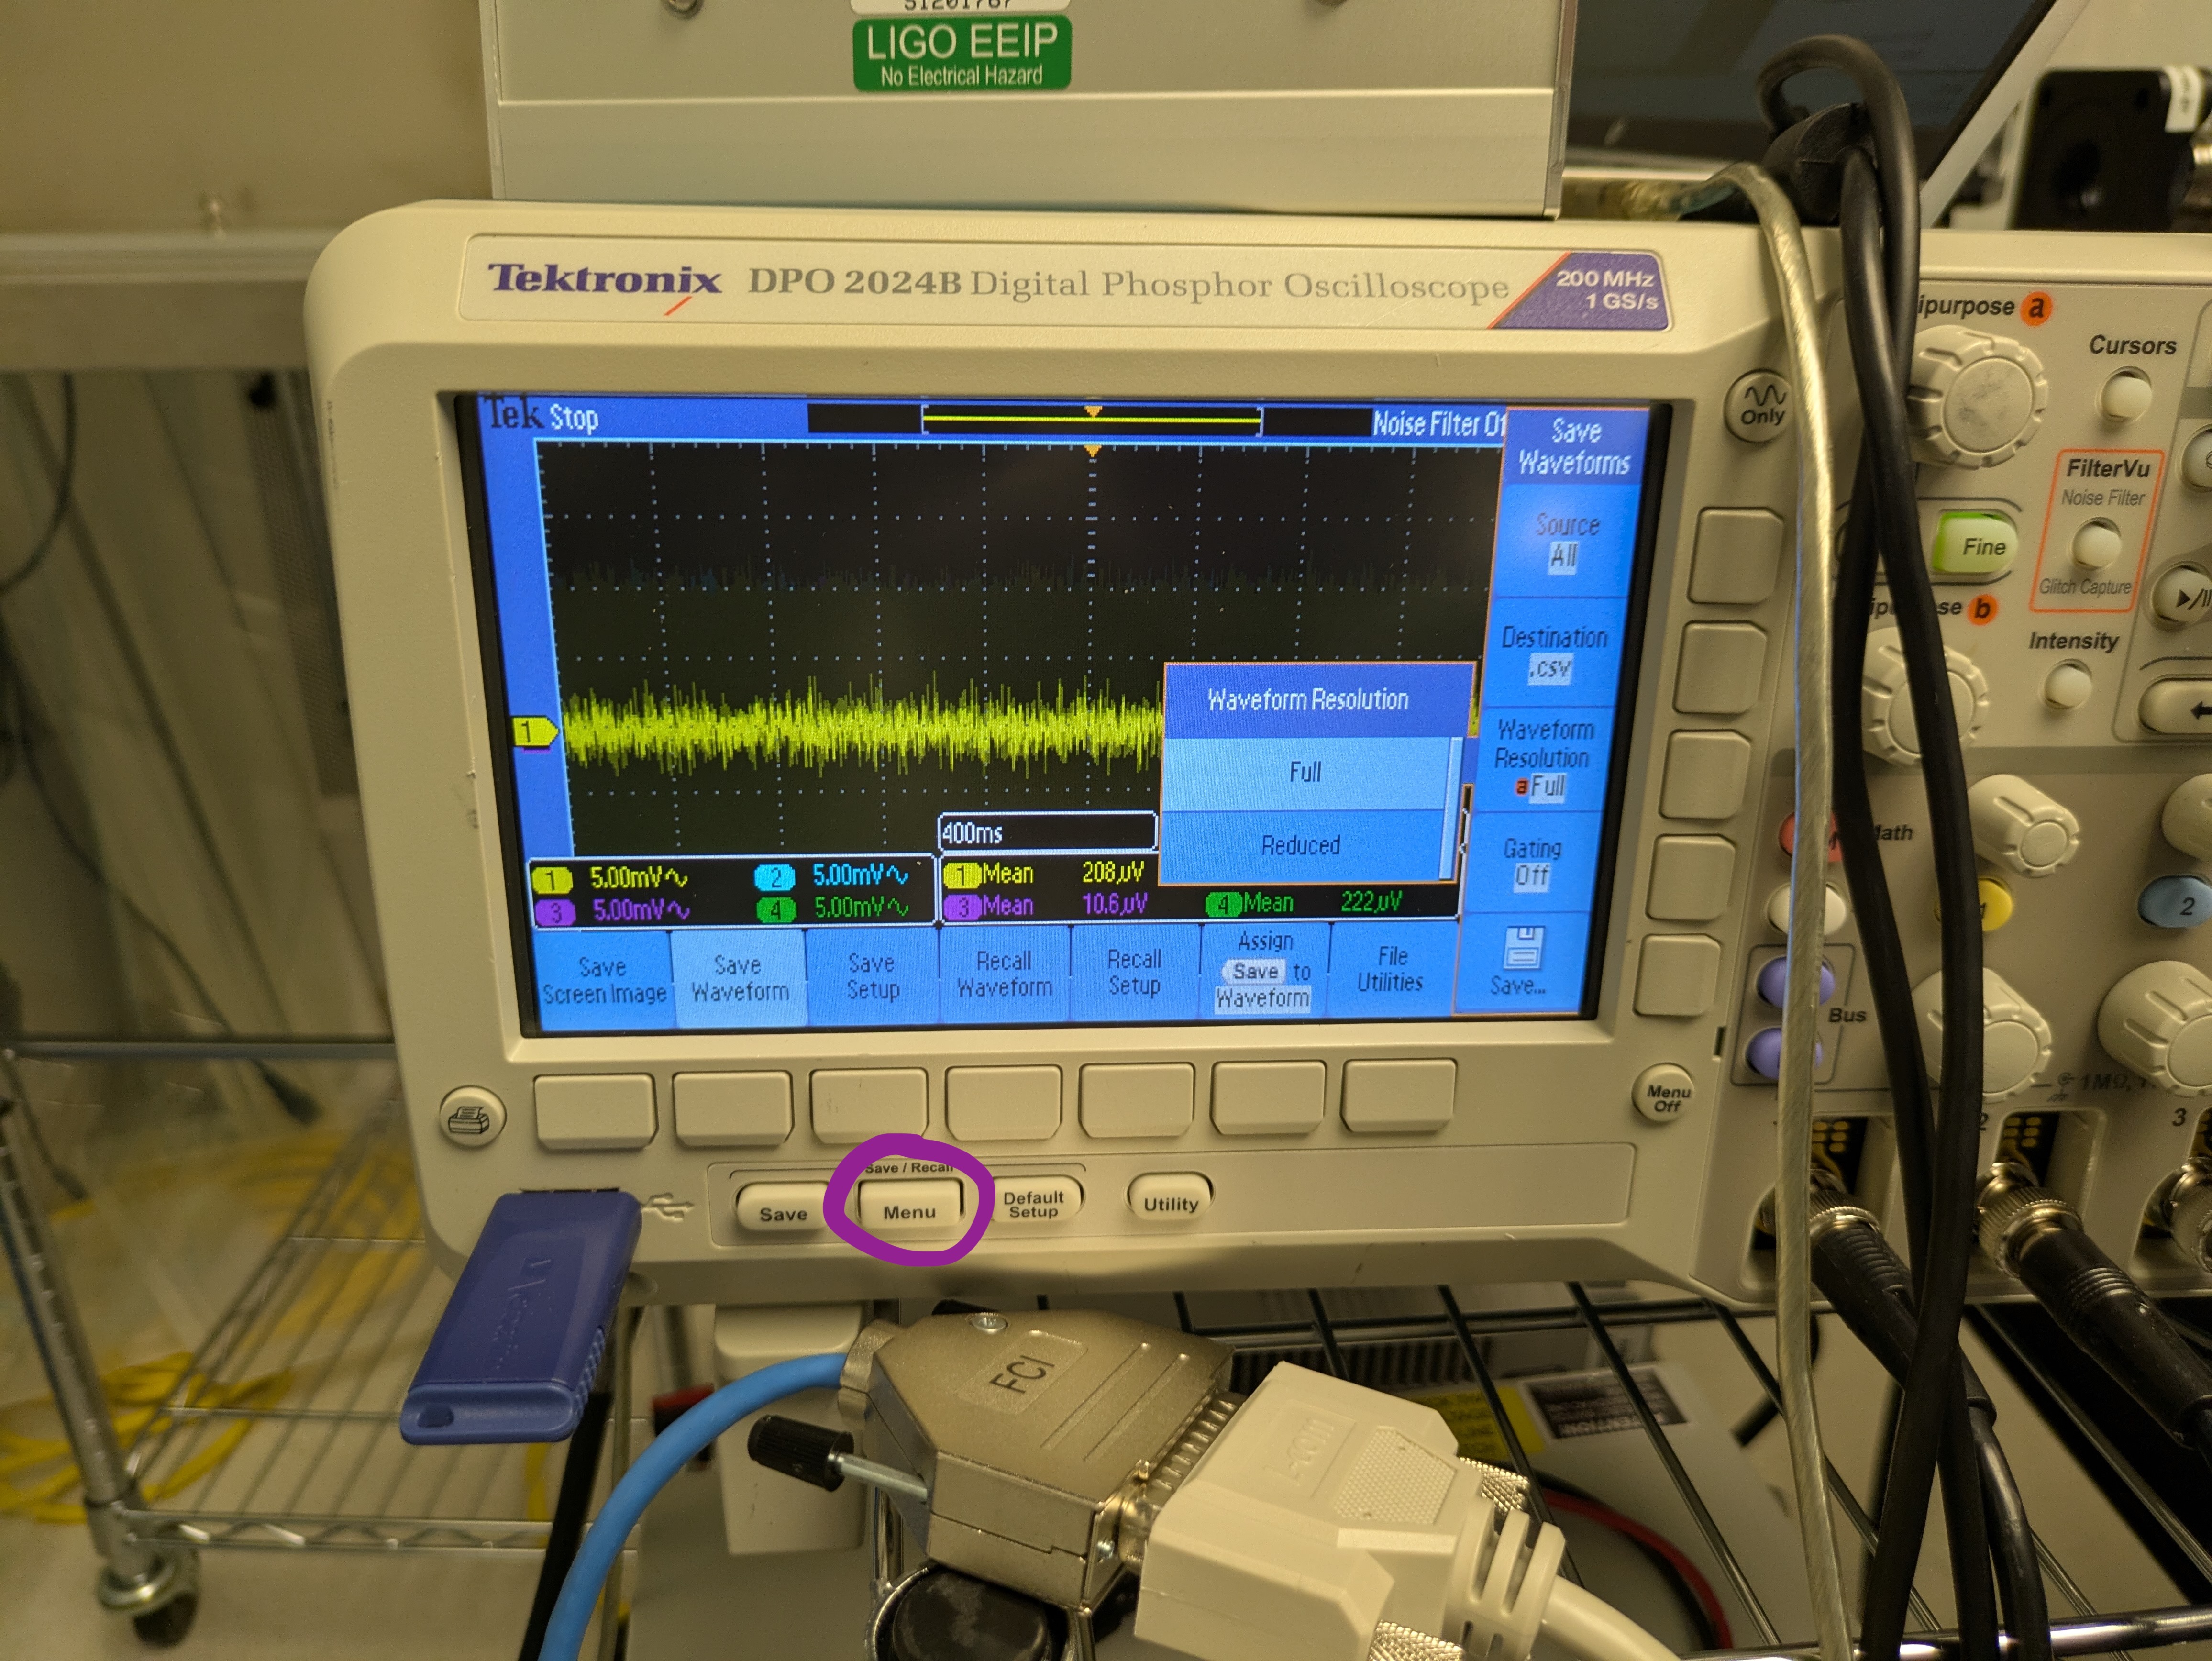
When the laser is in its quiet state the AC PD traces should comfortably fit on the screen of the osclloscopes with a 5mV scale, with the laser noisy this is more like 100mV, I also use 100mV scale for the QPD, I didn't change it when I reduced the noise on the laser.
The noisy state for the QPD outputs is here, the quiet state is here.
For each measurement I used a capture range of 400ms on the time axis of the scope and 125 000 samples selected on the 'ACQUIRE' menu.
The final measurements are:
PD 1 - 4 measured at AC: T0012ALL.CSV
PD 5 - 8 measured at AC: T0014ALL.CSV
QPD X, Y and SUM channels measured at AC: T0013ALL.CSV
The two DC measurements are going to be averaged so I didn't wait for a quiet time to measure them.
PD 1 - 4 measured at DC: T0011ALL.CSV
PD 5 - 8 measured at DC: T0010ALL.CSV
To save you need to click on the menu button and change the resolution to be'Full', the format to be CSV and the channels captured to be 'ALL', the file number will roll over every time you save so you don't need to enter it manually.
The code to produce this plot is in my optics lab code repo.
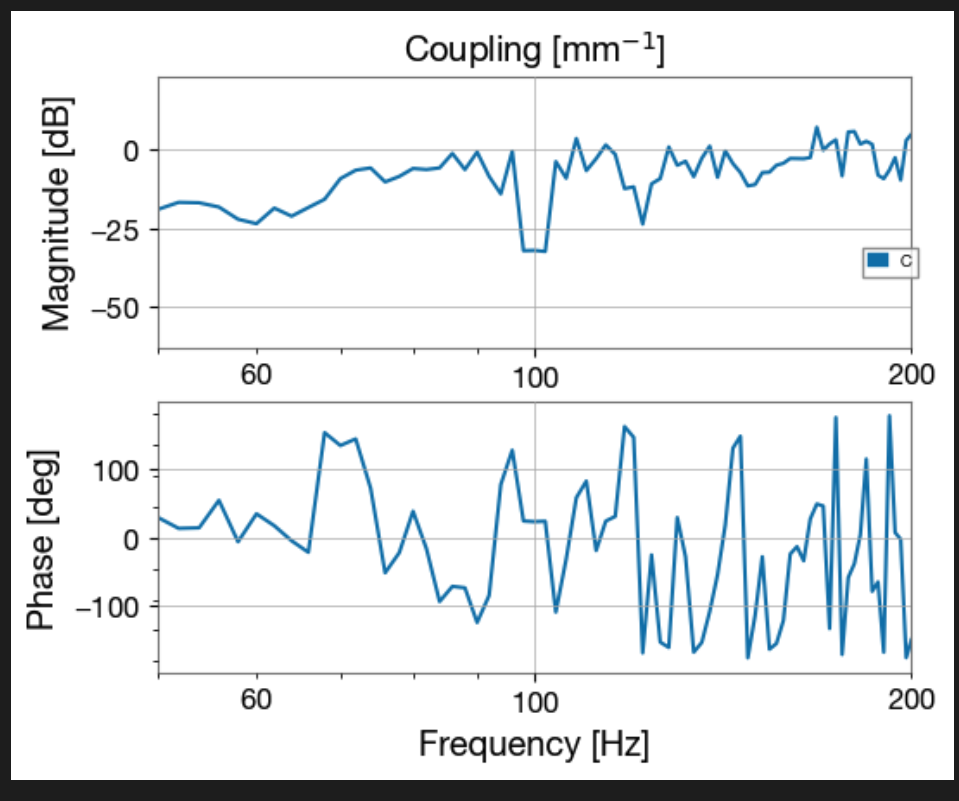
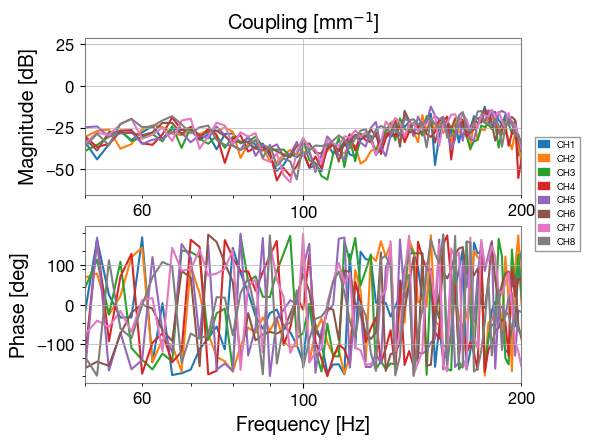
The graph of the TF from horizontal dither on the input mirror to horizontal dither across the array, shows that we are not getting much coherent modulation of the light intensity on the PDs at 100Hz which is the dither frequency. Either my code is wrong or I need to increase the dither amplitude for the mirror.
The maths to work this out was
A time series = abs(dither in direction horizontal to bench on QPD in V)/ (motion horizontal to bench volts on QPD/mm moved horizontal to bench on QPD)
B time series = AC voltage on each PD / mean of DC voltage on each PD
TF = CSD (B, A) / PSD (A, A)
I used gwpy for the calculations this time.
The attached plot shows each PD in the array as a different colour with magnitude on the top and phase on the bottom.
We realised in the analysis that we should be using :
H_amp on QPD = Xcos theta + Y sin theta where theta is the angle between the X axis of the QPD and the horizontal scan direction of the beam worked out from our previous calibration measurments, 14 degrees.
This gives a different value for the couplings. All the PDs other than PD6 did not have coherences 0.9 or over so I only attach the final TF for PD6. We increased the dither amplitude after this to improve the measurement of the other PDs.