S. Muusse
Calibrating sensors
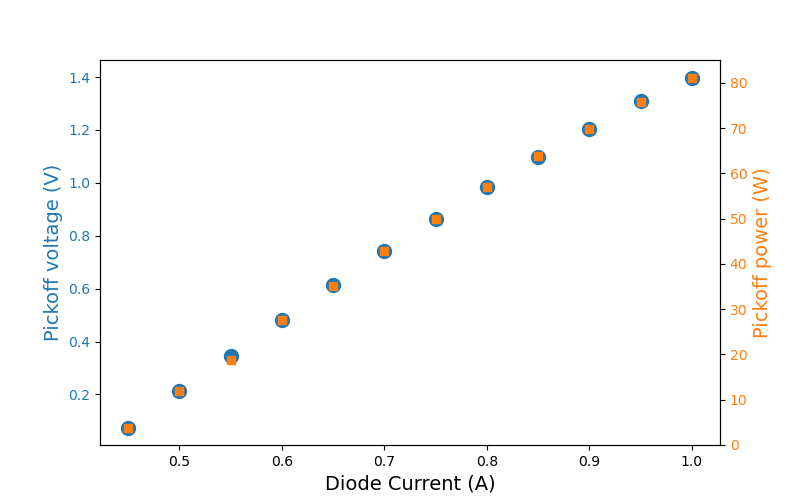
I have been working on calibrating the sensors on the cheta tables. When calibrating the power at the pick off that will be used to monitor CHETA power on ITM using beckhoff I was seeing voltage jumps up to saturation at 2.5V as shown in attached plot. This was determined to be due to the auto range on the thermal power head being on. This setting was turned off ( as outlined in T2600081 ) and a range of 0-22mV was selected as max incident power was ≈ 11mV. After which a linear relationship was observed and shown in the attached plot. The laser power vs laser current and the measured V vs laser current have been takem but I havent calculated the responsivity value for the beckhoff screen yet.
Profiling CHETA beam
The beam profiler has been shipped back from LLO to check the alignment against the model and profile the beam size as the second lens is moved by the translation stage. This is how we aim to control the CHETA beam size.
On the Y-table the beamsize was measured over a 60mm distance and the profile was fit with a non linear fit for w0 and z0 setting M2 =1. This is shown in the attached plot.
--- Horizontal (A1) Fit ---
Fit converged: w₀=896.3+/-37.1 µm, z₀=-528.0+/-47.8 mm
Model: w₀=1020.9 µm, z₀=-704 mm
--- Vertical (A2) Fit ---
Fit converged: w₀=977.3+/-40.1 µm, z₀=-449.0+/-40.1 mm
Model: w₀=999.36 µm, z₀=-459 mm
The vertical fit agrees for both w0 and z0 within the fit uncertainties and the horizontal profile was just outside the uncertainty bounds.
Subsequently, the beamsize has been measured along the same positions with L2 at its minimum and maximum displacements on the translaiton stage (±50mm) but this data hasnt been processed yet at will be added in a comment.


As described above the beam was profiled with L2 at different displacements and w0 and z0 determined using a non linear fit. The q from the fit values was then propagated to the ITM and the beamsize at the ITM was compared to the model.
Displacement: 0.0 mm
X:
Fit converged: w₀=896.3+/-37.1 µm, z₀=528.0+/-47.8 mm, wITM = 58.14mm
Model: w0=1020.9 µm, z=725.22 mm, wITM = 52.26mm
Y:
Fit converged: w₀=977.3+/-40.1 µm, z₀=449.0+/-40.1 mm, wITM = 53.21mm
Model: w0=999.36 µm, z=458.67 mm, wITM = 53.00mm
Displacement: 50.0 mm
X:
Fit converged: w₀=794.4+/-25.4 µm, z₀=506.2+/-38.8 mm, wITM = 74.48 mm
Model: w0=818.78 µm, z=537.12 mm, wITM = 64.91mm
Y:
Fit converged: w₀=882.3+/-36.1 µm, z₀=465.0+/-44.9 mm, wITM = 65.7 mm
Model: w0=836.41 µm, z=358.2 mm, wITM = 63.24 mm
Displacement: -50.0 mm
X:
Fit converged: w₀=1164.2+/-38.2 µm, z₀=712.0+/-33.5 mm, wITM = 34.79mm
Model: w0=1321 µm, z=901.17 mm, wITM = 40.54mm
Y:
Fit converged: w₀=1117.9+/-49.5 µm, z₀=456.1+/-34.1 mm, wITM = 40.85mm
Model: w0=1214.4 µm, z=521.06 mm, wITM = 43.36mm

