J. Oberling, R. Crouch, J. Warner, B. Weaver, I. Abouelfettouh, O. Patane, S. Appert
And finally, here is the long-promised alog for our full set of measurements of the now-deinstalled aLIGO BS. I will give a brief overview of the WBSC2 support tube and BS in-chamber measurements we took, but the bulk of this alog will concern the various test stand measurements we took and how they tie in to the in-chamber and support tube measurements. As a reminder, our alignment tolerances for the aLIGO BS were:
- Relative to IAS equipment (set normal to the AR surface of the optic)
- Horizontal: +/- 1.0 mm
- Vertical: +/- 1.0 mm
- Longitudinal: +/- 3.0 mm
- Relative to IFO axes
- X: +/- 2.8 mm
- Y: +/- 2.8 mm
- Z: +/- 1.0 mm
- Pitch: +/- 55 µrad
- Yaw: +/- 190 µrad
Strap in folks, this is going to be a long one with a wall of text. But first, I demand... A shrub, errr, a summary!
Summary
Earlier this year we measured the location of the ends of the WBSC2 support tubes. They indicated a -X translation of the WBSC2 cartridge and a CCW yaw. But, since the support tube length wasn't a controlled dimension for support tube construction we can't use them to definitively inform us about the cartridge assembly in the chamber (we've measure 4 tubes so far, and all 4 have been different lengths by several mm). The -X translation was a little surprising because we translated the cartridge in the +X direction during our 2013 install, implying that the support tubes were already sitting too far in the -X direction. The CCW yaw wasn't surprising since we yawed the cartridge CCW back in 2013.
At first we thought the in-chamber alignment looked pretty good, it was only after the cartridge had been removed from the chamber that we realized the mode we had used to make the measurements had a high potential to disguise positional deviations and make the measured point look closer to nominal than it actually was (see the in-chamber section below for full details). The decision to use this mode was made during our planning for the alignment (it's in our alignment procedure), and was based on an incomplete understanding of how the underlying mode actually worked. Well, now we know better, but unfortunately the consequence is that we cannot say how well the BS was aligned to the IFO XYZ coordinate system. What we can say is that the BS was clearly yawed in the CW direction w.r.t. the SUS cage, by potentially several mrad, but have no insight into how it was yawed w.r.t. the IFO XYZ axes.
On the test stand, we found the BS SUS to be right on the edge of our position tolerances for the optic. We never measured the SUS cage back in 2013, so this was the first time we had looked at it. The optic itself was found to be within our position specs, but we did measure the position to be in a different place than we did in 2013. We traced this primarily to 2 things: The large +/- 2.0 mm error bar in the total station's distance measurement mode (used to set the optic's longitudinal position in 2013) and errors in the position of the test stand's brass monuments (used to place the alignment equipment in 2013). We were able to trace this using the FARO, using its much higher accuracy to measure both the BS longitudinal position and the test stand monuments. We did find that the pointing of the BS was well outside of our specs: pitch was ~200 µrad up while yaw was ~710 µrad CW. While the pitch being out of spec after the cartridge was craned was not surprising (looking back through my aLIGO install notes we never had a pitch alignment survive craning into a chamber), we were surprised at the yaw measurement. The mispositioning of the test stand monuments did not explain this yaw, and we could find no obvious cause.
WBSC2 Support Tubes
The WBSC2 support tube ends were surveyed with FARO earlier this year. From talks with Jim, my understanding is that support tube length was not a critical dimension for tube construction, and so far this is holding up. We've measured the support tube ends for WBSC2 and WBSC3 so far (more to come as we're able), and the lengths have not been constant (the WBSC3 support tubes measured short of their design length, and each one was a different length, while both WBSC2 support tubes measured longer than their design length). Because of this, we can't give any definitive numbers about the respective cartridges, but the info does offer some general guidance. For WBSC2 this is:
- The cartridge was shifted in the -X direction (towards the PSL) by a couple mm
- This is odd, as the old notes from WBSC2 installation in 2013 indicate that HEPI was shifted +X by over 4 mm
- That said, the +X shift makes sense (the direction, not the exact number), see test stand section below
- Only explanation I have is a guess that the support tubes were not well located before cartridge install; I have no knowledge of how the aLIGO SEI install team set the support tubes before the cartridge was installed, so I have no data to back up this guess
- This is odd, as the old notes from WBSC2 installation in 2013 indicate that HEPI was shifted +X by over 4 mm
- The cartridge was rotated couterclockwise (CCW) when viewed from the top down by up to 1.3 mrad
- My notes from the in-chamber pitch/yaw alignment back up the direction, as we initially requested a 400 µrad CCW yaw shift be done via HEPI
The important thing to note here, in my opinion, is the CCW yaw (again, the direction, not so much the exact number). This will be important later on, once we get to the test stand measurements.
aLIGO BS In-Chamber
We took a series of measurements on the BS while in the chamber in mid-April, see the alog for more detail. Some important takeaways, in my opinion:
- Due to the construction of our rods, as they are not repeatable in X and Y, we do not have a good idea of where the WBSC2 ISI optics table is w.r.t. the IFO X and Y axes (this will only be an issue with WBSC2, since for the other 4 BSC chambers we can set FARO right outside the open door and measure the ISI directly)
- Averaging out the 7 Z axis deviations, the ISI is sitting too high by ~0.1 mm (average is -2.8 mm, and it should be -2.9 mm since this ISI should be lower by that amount to place the BS at the correct Z axis position; this wasn't corrected in CAD, hence the listed deviations)
- The SUS cage appears well positioned w.r.t. the IFO axes
- Although I now question that, given the large potential for misreads of the Build/Inspect mode's results, but it's the info we have and we cannot measure it again
- In future, we will not be using the Build/Inspect mode; its ease of use is attractive, especially for quick measurements, but we have found it to be error prone due to its automatic SMR radius compensation (explained in the paragraph immediately following these bullet points)
- Although I now question that, given the large potential for misreads of the Build/Inspect mode's results, but it's the info we have and we cannot measure it again
- Ruler measurements show the BS optic is well positioned w.r.t. the SUS cage
- When looking directly AT the HR surface, it's sitting ~0.25 +/- 0.25 mm to the left, ~0.25 +/- 0.25 mm low, and ~0.7 +/- 0.7 mm too close to the HR Figure 8 section of the SUS cage
- The error bar on the longitudinal measurement is large due to how the measurement had to be made, as explained in the 2nd comment to the in-chamber alog linked above
- Rotating this to the IFO axes gives:
- When looking directly AT the HR surface, it's sitting ~0.25 +/- 0.25 mm to the left, ~0.25 +/- 0.25 mm low, and ~0.7 +/- 0.7 mm too close to the HR Figure 8 section of the SUS cage
- The BS optic is yawed w.r.t. the SUS cage
- Betsy said this was visible by eye
- Ruler measurements from the lower Figure 8 of the SUS cage to the BS HR surface indicate this yaw is in the CW direction, but the error bar for this measurement is so large that the amount of yaw is largely unknown
- Test stand measurements shed more light on this yaw
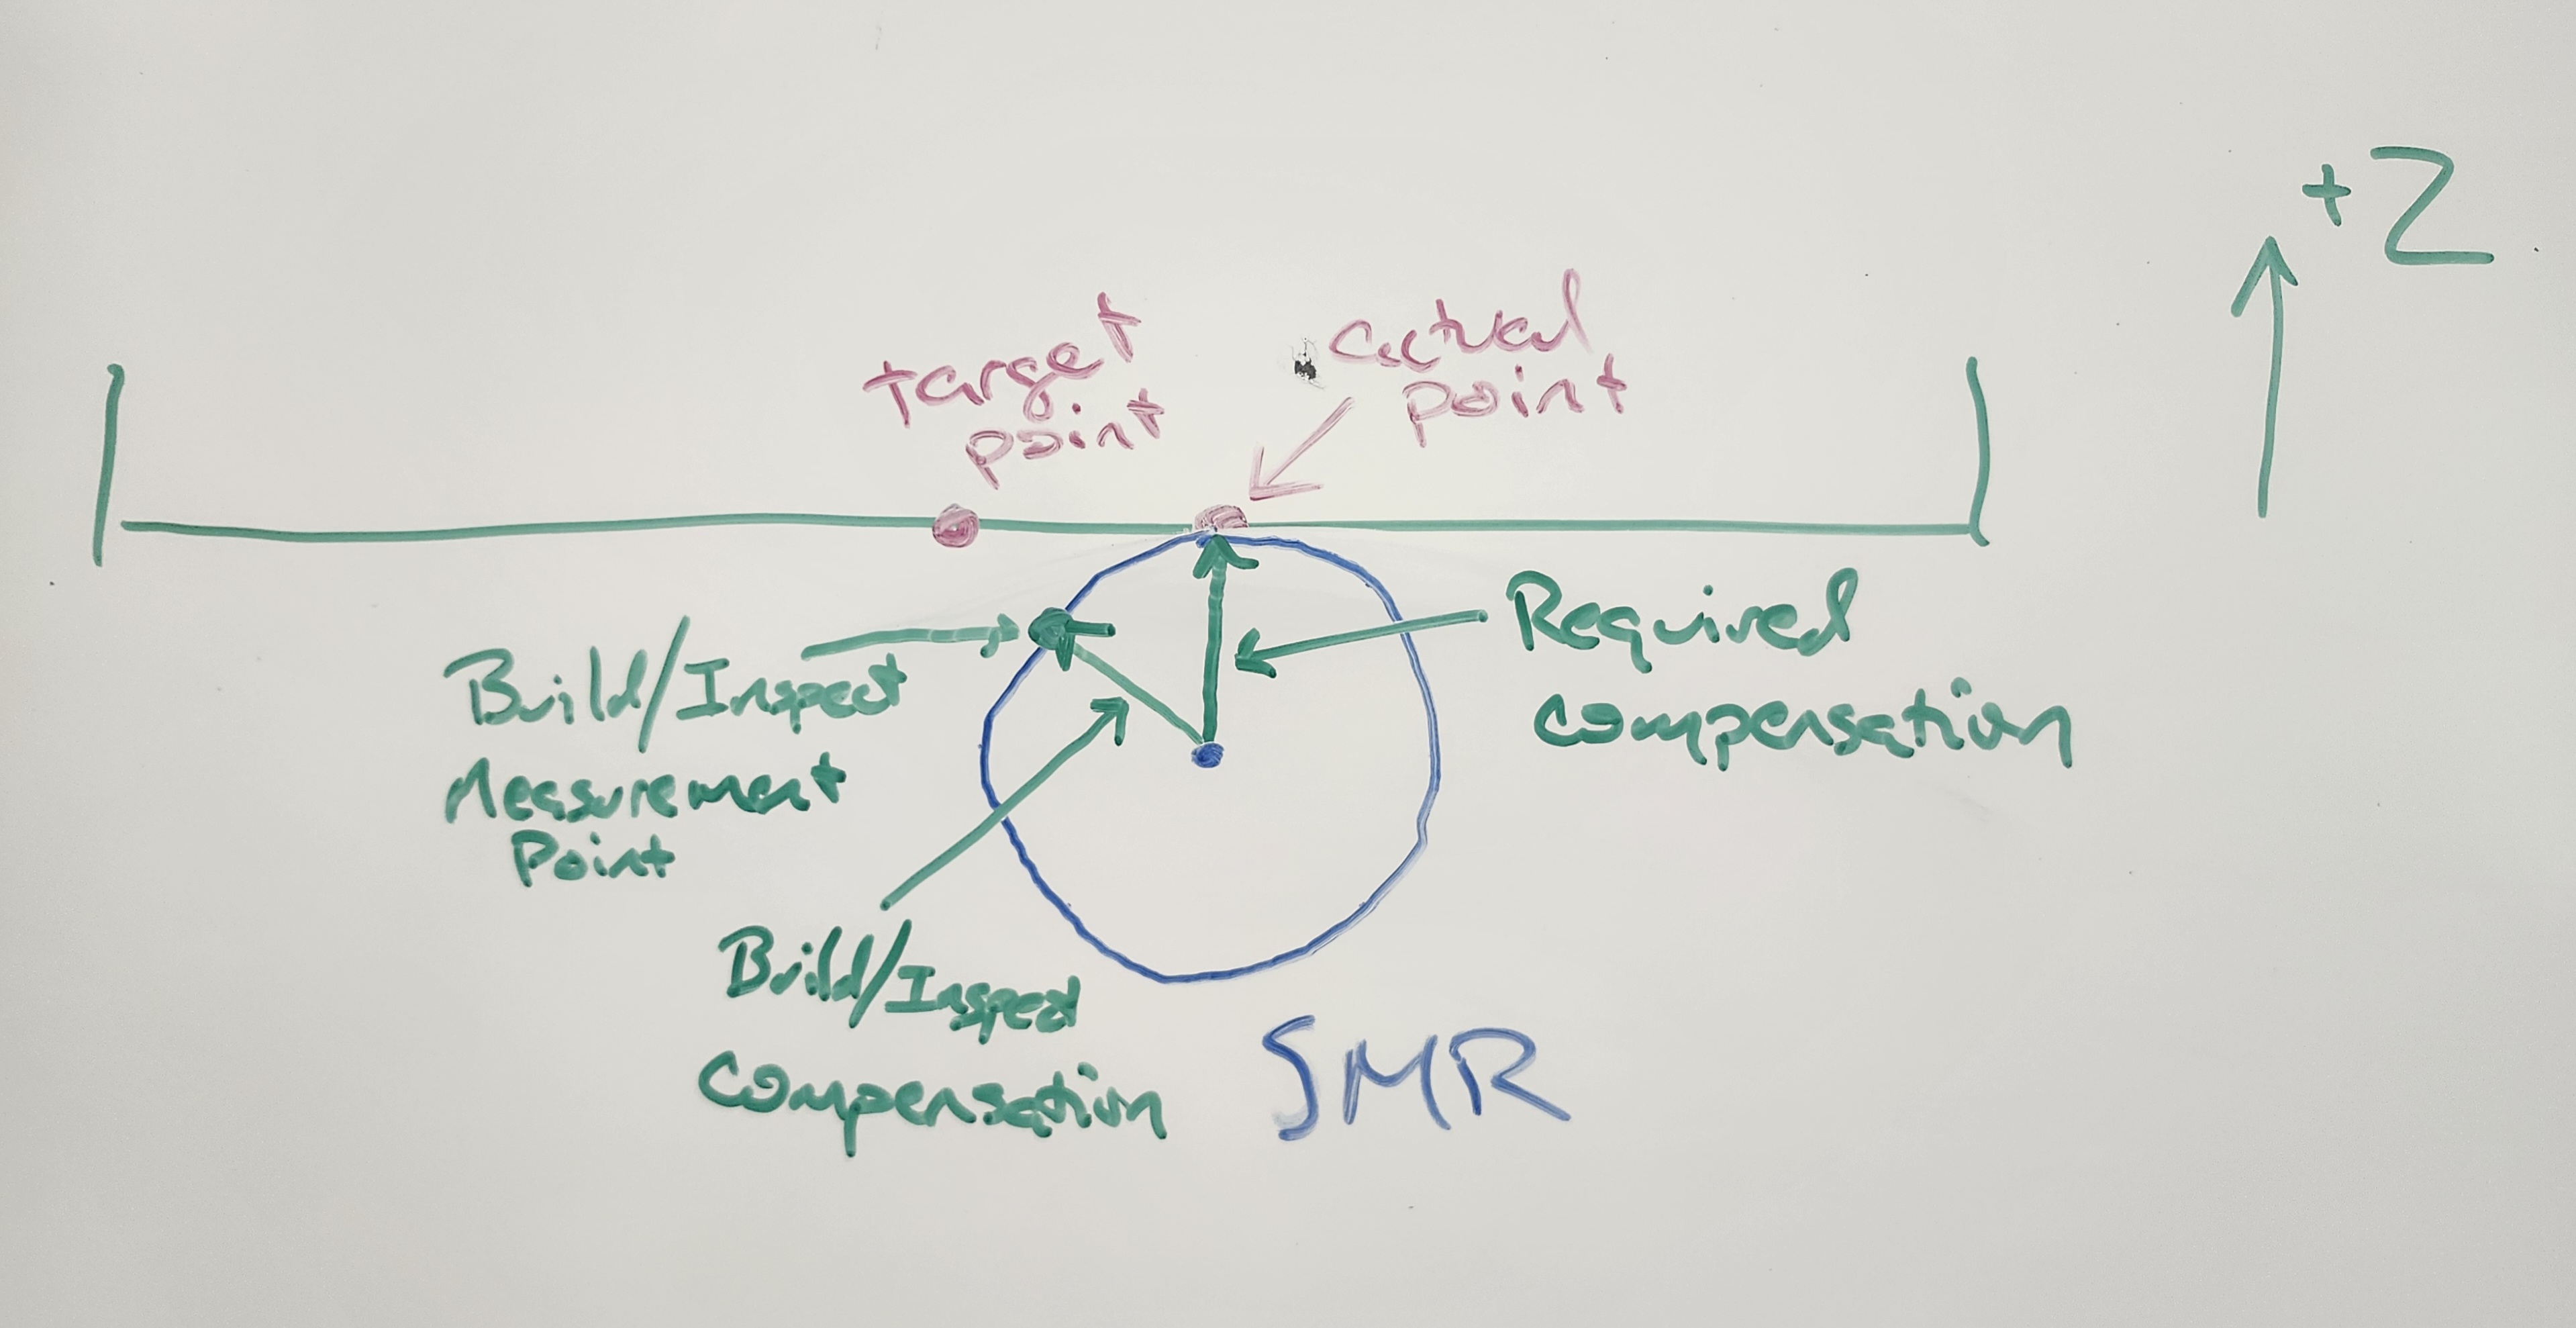
Because we used the Build/Inspect mode with the automatic SMR radius compensation turned ON to measure the BS SUS position in-chamber, we unfortunately do not have a good idea of where the SUS was located within WBSC2 and by extension do not have a good idea of where the BS optic was positioned. Subsequent testing after the cartridge had been removed from the chamber showed that we did not have a good understanding of how the automatic SMR compensation worked. Short version: It's dumb. It simply compensates in the direction of the measurement object, regardless of where your measured point is. For example, you're measuring a point on the the underside of a horizontal plate with Build/Inspect mode. The SMR would sit below this plate in the -Z direction, so the SMR radius should be compensated in the +Z direction. The automatic compensation does not compensate in the +Z axis alone, it compensates directly towards the nominal point. This then can result in a measurement that looks dead on but in fact could be nowhere close; if the actual point is off several mm in the X and Y directions, the automatic compensation would make the resulting measurement look like it was dead on as it compensates towards the measurement object, removing the actual deviations in the process. The final attached picture is a drawing showing this behavior. We finally noticed this while testing the FARO test stand alignment procedure on an old HAM passive stack after the BS cartridge was removed, and then confirmed it while aligning the BBS SUS on the test stand; initial BBSS placement was done via Build/Inspect as a real time feedback, but we measured the points using a more involved method that tells PolyWorks what direction to compensate in instead of letting the software do it automatically. The measured points were several mm off of the Build/Inpsect points, and we confirmed the automatic compensation was the cause by turning it on and off (when automatic compensation was turned off, Build/Inspect reported deviations that matched our direct measurement of the alignment points).
aLIGO BS Test Stand
FARO Measurements
And now we come to the test stand meausurements. To start, we aligned the FARO to the ISI using 10 points on the ISI; these points and the resulting alignment are shown in the 1st attached picture, and show the FARO is well aligned to the ISI. Once the FARO was aligned to the ISI we then measured several points along the bottom of the SUS cage, as well as the center of both the HR and AR sides of the lower Figure 8 structure; this is shown in the 2nd attached picture. We did not measure the SUS cage position during aLIGO install, only the optic position, so it's good to see the cage is mostly in the neighborhood of the optic position tolerances. One note about the Z axis numbers shown here: The CAD model used here is the in-chamber model, which places the BS at its in-chamber Z axis coordinate of -82.9 mm. However, the BS SUS is the same length as the QUAD SUSs, so the BS is placed w.r.t. the ISI the same as the QUADs, i.e. at -80.0 mm; -82.9 mm was acheived in-chamber by lowering HEPI, but on the test stand the BS was aligned at -80.0 mm. This was never properly corrected for in the CAD model; I think the SUS cage itself and its components were lowered while the ISI was left at its nominal height, so all the Z axis measurements should show a deviation of around +2.9 mm (since they are physically higher than the CAD would indicate). This is seen most clearly with the HR and AR Figure 8 structure measurements. Both Z axis positions measured right around -80.0 mm as they should, while the CAD model claims they are too high. This has been corrected for in the BBS CAD model, so this is the only time we'll see this discrepancy.
The 3rd attached picture shows a set of lines created from the measurement points we took on the structure which show how the BS SUS cage is rotated w.r.t. the ISI; I also rotated the CAD model so that it matches the target yaw angle of the BS optic itself. The angles here are reported w.r.t. their respective positive axes (i.e. X Ang is the angle measured from the positive X axis). As can be seen, the SUS cage had a large CCW yaw w.r.t. the ISI. Averaging the various yaw deviations gives a yaw of the BS SUS w.r.t. the ISI of 0.2762°, or 4.82 mrad CCW. This explains the large CW yaw of the BS optic w.r.t. the SUS cage.
With those measurements done we then used the FARO to set a total station looking at the AR surface of the BS, set along the target AR surface normal so we can measure position deviations from nominal. Once we had these position deviations we moved the total station to the HR side of the BS, mounted a laser autocollimator (LAC) on top of it, set it along the target HR surface normal and offset by 150.0 mm (to avoid the test stand leg) to measure the pitch and yaw of the BS. The results were posted to the alog here, so the details follow below.
I should note here how we measured the longitudinal position of the BS AR surface. As noted above, we used the FARO to measure the circle that represents the AR side of the lower Figure 8 structure of the BS SUS; PolyWorks calculates the center of this circle, and is what is shown on the 2nd attachement with the label "BS_FIG8_AR". We also know the position of the total station, as we set that using the FARO. We then use PolyWorks to measure the distance between the total station and the BS AR Figure 8, as well as measure the target distance from the total station to the BS AR surface. We then measure the distance from the AR Figure 8 to the BS AR surface using a depth micrometer; this was done on the left, right, top and bottom of the Figure 8. These 4 measurements are averaged together to give us a distance from the Figure 8 to the BS AR surface, which is then added to the measured distance from the total station to the AR Figure 8. This final distance is compared to the target "total station to BS AR" distance to give us the longitudinal position deviation of the BS AR surface.
BS Position and Pointing
The original BS test stand alignment was completed in early February 2013. The below table gives the final position and pointing deviations we measured in 2013 and those we measured now; I've rotated the position deviations to the IFO XYZ axes for both. In 2013 we were on Test Stand #2 (currently disassembled due to filter cavity interference) and using pre-set brass monuments, and now we are on Test Stand #1 and using the FARO to precisely set the total station.
| 2013 Test Stand | 2026 Test Stand | Difference | |
| X | +0.1 mm | -1.8 mm | -1.9 mm |
| Y | +0.1 mm | +0.8 mm | +0.7 mm |
| Z | +0.3 mm | -0.8 mm | -1.1 mm |
| Pitch | -20 µrad (up) | -200 µrad (up) | -180 µrad |
| Yaw | -10 µrad (CW) | -710 µrad (CW) | -700 µrad |
That's, uh, quite the difference, yeah? A couple of things that should be noted here:
- The 2026 pointing measurements, like the 2013 ones, were done with the alignment bias sliders OFF. With the alignment bias on we did not get a return in the LAC, as the beam was then too far in the CW direction. The yaw slider was set to -388 µrad, which is CW per SUS sign conventions, so the alignment sliders were pushing the BS further CW. This could be because of in-chamber yaw deviation, but we don't know for sure since the use of the automatic compensation in the Build/Inspect mode messed up the in-chamber measurements (as previously explained).
- We, obvously, did not have a FARO in 2013, so were using the total station entirely for positioning. For the longitudinal position (position along the AR surface normal of the BS) we used the total station's internal distance measurement function, which has an error bar of +/- 2.0 mm. Keep this in mind, as in 2013 we measured a longitudinal deviation of 0.0 mm, while now with the more accurate FARO assisting our setup we measured a longitudinal deviation of +1.8 mm (within the +/- 2.0 mm error bar of the total station's distance measurement).
Despite the large difference in position deviations between 2013 and 2026, these are still within our set position specification. The pointing is decidedly not. While it's entirely possible that things have drifted in the 13 years since the BS was installed, there are 2 somewhat obvious things that would contribute to this difference: The total station's +/- 2.0 mm error bar for distance measurements and error in the placement of the test stand's brass monuments. We've already measured a difference in longitudinal position between 2013 and 2026 that is within the error bar of the total station's distance measurement, but what about the test stand monuments? Well, we used FARO to measure those.
Test Stand #2 Monuments
To measure the test stand monuments we first had to align the FARO to the test stand coordinate system. To do this, we used the set of monuments set along the XY axes of the stand and PolyWorks' Best-Fit Alignment routine (the same routine used to align the FARO to the ISI on the test stand); the test stand coordinate system was assumed to be flat along the floor and 2 dimensional (XY only), so I forced all of the Z axis nominals and measured to 0.0. The results of the alignment are shown in the 4th attachment. It's immediately apparent that our test stand monuments are not going to be where we thought they were, as the alignment routine was not able to fit a good alignment between the nominal and measured coordinates of the alignment monuments (the first attachment shows the results of the alignment routine when it can find a good fit between the nominal and measured data). We re-did this a couple times and got very similar results each time (to <0.1 mm), so the monuments are definitely not where we thought they were. We proceeded to use this alignment to measure the rest of the test stand monuments; those are shown in the 5th attachment. As expected, none of the monuments are well positioned, all show large errors. Well then. So now we have both an error in the longitudinal measurement (but within the error bar) and test stand monuments not where we thought they were. How could this have affected the 2013 BS XY alignment? To figure this out, I used PolyWorks to recreate our 2013 alignment setup, now with our mispositioned monuments and with our longitudinal position error. Since we had to rotate the cartridge to place it on the test stand, I created a new coordinate system that's rotated 90° CW, so the monuments are in the same coordinates as the BS would be once installed in-chamber (I was getting cross-eyed constantly flipping between the IFO and test stand coordinate systems, this made things much easier).
First I wanted to consider how these issues could have affected our 2013 XY position alignment, so I recreated the setup looking at the AR side of the BS. The 6th attachment shows this. There's a lot of info in this picture, so match the below numbered list with the red numbers in the picture. Also, "Theo" is my shorthand for theodolite, which is another name for a total station.
- These are our targets: The target XY position of the AR surface of the BS and the target theodolite sighting line. I created the target sighting line by making a line from our total station monument, TS2-18, and the target AR position. The listed angles are from the nearest axis, so X Acute Ang is measured from the -X axis and Y Acute Ang is measured from the +Y axis. The listed angles are calculated by PolyWorks based on the nominal positions of TS2-18 and the BS AR surface.
- These are our total station setup monuments. The total station was set over monument TS2-18 and sighted TS2-11 to create the 0° horizontal angle reference, which is represented by the "Theo AR 0 Ref Line". The measured column here is the error in our 0 reference based on the misposition of monuments TS2-18 and TS2-11. Y Ang is the angle measured from the positive axis, +Y axis in this case, so while we thought we were setting our 0 reference parallel to the X axis, we were actually setting it 0.0012° CCW of the X axis. 0.0012° ~= 4 arcseconds ~= 20 µrad, so not a huge angular deviation.
- Here's where things start getting a little tricky. There's 2 boxes here, "Theo AR Actual Sighting Line" and "BS AR Center w/ Devs". We'll consider the Actual Sighting Line first.
- So, according to PolyWorks we should have turned an angle of 45.1052° from our 0 Ref Line to sight the target center of the BS AR surface, but this is not the angle we were told to turn. The actual angle we turned was 45.1047°. Again, a very small difference (0.0005° ~= 2 arcseconds ~= 10 µrad). So the "Theo AR Actual Sighting Line" nominal column shows the angle we actually turned back in 2013, and the line length is the target longitudinal length from the total station to the BS AR surface. The Measured column shows what the angle actually is once the 0.0012° CCW deviation of our 0 Reference Line is taken into consideration. I should also note that the Actual Sighting Line originates at TS2-18, with the nominal line originating at the nominal TS2-18 coordinates while the measured line originates at the measured TS2-18 coordinates.
- The box "BS AR Center w/ Devs" shows the point that we would have been pointing the total station at assuming we had no deviation in longitudinal distance (which is what we measured in 2013 with the total station's distance measurement function); in other words, if we had no positioning deviations with the BS at all, this is where the center of the BS AR surface would have ended up. The nominal column only considers the small 0.005° angular deviation between the angle we turned and the angle PolyWorks calculated we should have turned. As seen, this small angle does not cause much of a shift in AR surface position, a handful of µm in both X and Y. The measured column, however, is much more interesting. This column considers both the 0.0012° error in our 0 Reference Line and the mispositioning of monument TS2-18. As can be seen, the misposition of TS2-18 puts the AR center well off of its target, but still within our positioning specification.
- Number 3 assumed no longitudinal position deviation in the BS AR surface, and while that's what we measured in 2013 our 2026 measurements showed the longitudinal position of the AR surface was 1.8 mm longer than it should have been. As I've said previously, this is within the error bar of the total station's distance measurement function that we used in 2013, so we would not have seen this deviation at the time. But now that we have seen it, how did this change the 2013 alignment? Queue the next set of boxes, "Theo AR Act Sighting Line + Length" and "BS AR Center w/ Devs + Length". These boxes provide the same information as given in Number 3, but now I've included the +1.8 mm longitudinal deviation that we have now measured (thanks to the FARO). The nominal column here is the same as Number 3, so I'll only talk about the measured column.
- Now the measured column is including 3 different deviations: The 0.0012° deviation in the 0 Reference Line, the misposition of monument TS2-18, and the +1.8 mm longitudinal position deviation measured with the FARO. As can be seen, this pushes the AR center further away in X but closer in Y, but still within our position specification for the BS.
- To see how this compares to our 2026 measurement I added that in as well. I placed the point that we ended setting the total station over into this test stand coordinate, then created a line at the angle we turned for the measurement. Interestingly, this was yet another different angle than the one we used in 2013. The nominal column for the 2026 sighting line lists the angle calculated by PolyWorks, 45.1058°, which was slightly different from what we used for our real test stand measurement, 45.1061°, which again differs from the 45.1047° used in 2013. This 0.0003° is approximately 1 arcsecond, or ~5 µrad, so a very small difference. The measured column for the sighting line is slightly different, however. I wanted to place a point where we measured the BS, which means I had to consider both the longitudinal deviation (seen in the length of the line) and the horizontal deviation. To include the horizontal deviation I calculated the angle subtended by the -0.7 mm horizontal deviation and the measured distance to the BS AR surface (which includes the longitudinal deviation). This angle was 0.0085° (arctan 0.7/4713.6). I subtracted this angle from the 45.1061° we turned to sight the target center of the BS, since the horizontal deviation puts the AR side closer to the -X axis, then created a point at the end of the line. The measured column of the box "2026 BS AR Measured Position" is this point. As can be seen, it closely matches the deviation I calculated in the table above, but doesn't quite match the positional deviation seen in Number 4; X position is decently close, within a couple tenths of a mm, but Y deviation is roughly 0.5 mm. While I don't have an explanation for these small differences, this does show that the mispositioning of the test stand monuments makes up a large portion of the difference between our 2013 BS position measurement and our 2026 one.
That's all well and good for X and Y, but what about the Z axis deviation between 2013 and 2026? Again, all I have to fall back on is 2013 equipment setup errors or things drifting over the course of the last 13 years. For equipment setup, we set optic height by setting the total station at a target distance down from the ISI, using a scale attached to a fixed-length rod, that matched the desired Z axis position of the BS. There could have been an issue with the scale/rod setup (such as a mistake in rod length (not likely) or the scale not mounted properly) or an issue with the total station setup (such as not well levelled or sighting the scale along a zenith angle other than 90°). While I'd like to think that 2013 me would not have made such obvious mistakes, 2026 me doesn't have perfect recall of events from over a decade ago so I cannot say for sure.
For pointing I made our HR test stand setup in PolyWorks, this is shown in the 7th attachment. This is much simpler as I'm only looking to see if the monument misposition caused a large yaw error back in 2013. Quick explanation, we set our total station/LAC combo over monument TS2-20 and sighted monument TS2-19 to set our 0° reference line. We then turned 44.9711° so we were sighting parallel to the HR surface normal of the BS; the gap between the 2 lines in the picture was handled by a Lateral Hollow Transfer Periscope, a device that horizontally translates the beam by ~400 mm while keeping the output beam parallel to the input beam by 1 arcsecond (0.0003°). For a 710 µrad CW yaw deviation in the BS to be caused by the monument mispositioning the deviation of the 0 Reference Line would have to be 0.0407° in the CW direction; this would be a measured X Angle of the line "Theodolite HR HA Ref" of 90.0407°. Clearly, this is not the case. In fact, the angle deviation caused by the monument misposition is only 0.0019°, or ~33 µrad, in the CCW direction. At this point, the only explanation I have for the difference in yaw between 2013 and 2026 is an equipment setup error in 2013 or things subtly shifting in the last 13 years. Keep in mind, we're not talking large shifts in the BS to cause this yaw. If we hold one side of the BS fixed in position and then yaw it by 710 µrad, the opposite side only moves by 0.26 mm (0.000710 * 370.0 = 0.263).
Wrapping Up
So, what does this all mean? Well, with the mistake in using the Build/Inspect automatic compensation mode we don't have any better of an idea where the BS was in the IFO XYZ coordinate system than we did before the cartridge was disassembled. The measurement looks good, but as I explained above I do not trust it. The support tube measurement indicates a -X shift from nominal and a CCW yaw, but these aren't good metrics since support tube length wasn't a critical dimension during tube construction (we've measured 4 so far and all 4 have been different by several mm). I wish I had better news to report here, but we didn't notice the mistake until after the cartridge had been removed from the WBSC2 chamber so there was no way to remeasure the in-chamber position.
The test stand measurements show that the BS SUS was on the edge of our positional tolerance for the optic, with a few points just outside of it. The optic itself, the object of primary importance and the only thing we actually measured in 2013, was within our positional tolerances but different from our 2013 measurements. The primary causes of this were found to be errors in the positions of the test stand brass monuments that we used to set our alignment equipment during the intial 2013 alignment, and the large error bar in the total station's distance measurement mode. The pointing was found to be well outside our tolerances, and I currently cannot explain the yaw deviation. Looking back through my old install notes we never had our test stand pitch alignment survive being craned into the chamber (ITMx shifted by over 2 mrad in pitch after being craned into the WBSC3 chamber), so the pitch being off wasn't really surprising. But the yaw was. Our measurements of the test stand monuments, despite the position deviations, did not show a large yaw deviation. The angle we turned the total station to measure the yaw was different between our 2013 alignment and 2026 measurements, but only by ~24 µrad so not enough to account for the 710 µrad CCW yaw we measured in 2026. We couldn't find any obvious cause of this, so all I can offer are guesses (procedure mistake, equipment setup mistake, small drifts over 13 years, etc.).