
[Sheila, Camilla, Ryan, Eric]
We would like to verify that our recent mode measurements after ZM5 ( 90783) and before ZM4 (90815 ) make sense by connecting the two. We decided to use the q value from the measurement at the nominal ZM2 strain in 90815 (ZM2 strain = 3.15V) and propagate that mode through the path containing ZM4 and ZM5 and calculate the overlap with the q values from 90783 measured at different strain settings for ZM4/ZM5. The goals here are as follows:
- Improve our model of the ZM4 - to - SEC path and verify that we're interpreting our mode measurements (with M^2 > 1) correctly.
- Determine the ROC for ZM4 and ZM5 as a function of the strain gauge voltage. This is particularly important since we are going to replace ZM5 and Camille would like to know what ROC to shoot for with the pre-stressing procedure.
First, I address item 1.
Mode Measurements with M2 > 1:
Our system seems to be adding some higher order abberations to the beam. As a result, our mode measurements indicate that we have an M^2 number significantly above 1 (between 1.2 - 1.5 depending on the PSAM settings). When M^2 is > 1, the presence of HOM content in the beam prevents one from focusing down to as tight of a waist, for the same divergence angle, the beam radius at the waist will be larger by a factor of M. The thorlabs beam profiler accounts for this by fitting the data to the following formula (which we confirmed by doing our own independent fit):
w(z)2 = wM2[1 +(z - z0)2 (pi*wM2/(M2*lambda))2]
Where wM2 = M2*w02 Is the waist for a beam with M2>1, and w0 is the waist for the TEM00 component of the beam (ie for M2 = 1).
The q parameter ends up the same as before:
q(z) = (z-z0) + i*zR
where zR = pi*w02/lambda = pi*wM2/(lambda* M2)
Knowing that M2 > 1 tells us that our beam is a mixture of TEM00 and some higher order mode content. However, from the M2 value alone we don't know which higher order modes are excited (in principle one might be able to make some rough projections using the surface abberation measurements of the PSAMs from Caltech, but that sounds tricky and is beyond the scope of today's post). If we want to do mode matching calculations, the only thing we can do at the moment is back propagate the TEM00 component and do all mode calculations for TEM00.
We use the same beam propagation matricies as always to back propagate the TEM00 component to determine what the TEM00 mode looks like in HAM 7.
Determination of the ZM4 and ZM5 ROCs
I then took the q value (for the nominal ZM2 = 3.15V) from the measurement before ZM4, back propagated it to ZM4 using our length measurements. I then propagated the q through ZM4 and ZM5 and calculated the overlap with the q values measured after ZM5 for various values of the ZM4/ZM5 strain gauge settings in ( 90783)
Then, the ROCs for ZM4 and ZM5 were chosen for each strain gauge settings to maximize the overlap. The overlap is => 98% over the entire 2D grid of ZM4/ZM5 strain gauge values, which gives us some confidence that the ROC values are accurate. One thing that gives us pause is that the change in ROC for ZM5 doesn't appear to change linearly in diopters with the strain gauge reading. ZM4, on the other hand is roughly consistant with a 5 mD/V change though because the beam spot is quite small on ZM4, we are relatively insensitive to its ROC value.
| ZM4 Strain (V) | ZM4 ROC (m) |
|---|---|
| 2.0 | -12 |
| 4.0 | -11 |
| 6.0 | -10 |
| 8.0 | -9 |
| ZM5 Strain(V) | ZM5 ROC (m) |
|---|---|
| -4.5 | 3.8 |
| -2.0 | 4.05 |
| 0.0 | 4.4 |
| 2.0 | 4.55 |
These values give the following overlaps for the x and y direction (our mode measurements indicate we have non-negligible asitgmatism on this path) for propagating the nominal q value from (90815 where ZM2 strain = 3.15) to the q vales from ( 90783) .
| ZM4 \ ZM5 | -4.5 | -2.0 | 0.0 | 2.0 |
|---|---|---|---|---|
| 2.0 | x = .994, y = .995 | x = .998, y = .997 | x = .990, y = .995 | x = .9874, y = .993 |
| 4.0 | x =.996, y = .997 | x = .994, y = .995 | x = .986, y = .992 | x = .983, y = .991 |
| 6.0 | x =.995, y = .997 | x =.992, y = .993 | x =.983, y = .989 | x =.980, y = .984 |
| 8.0 | x =.993, y = .995 | x =.990, y = .992 | x =.980, y = .984 | x =.977, y = .980 |
The fact that this set of ROC values gives good overlap over the entire 2D grid suggests that these ROCs are a resonable model for ZM4 and ZM5 at these strain gauge settings.
Attached is an a la mode file for doing the beam propagation. One could do some more intellegent fitting of the data to extract the best ROC estimates; I'm just sorta hand fitting it at the moment.

We have ZM5 SN4 installed now. Original data before we changed the preloading (E2100297) had the ROC range 3.0m to 3.9m. With at 0V applied 667mD optical power, with 200V applied 508mD.
In alog 75709 we increased the preload from 20 in lb to 47 in lbs. An estimated linear increase of 65mD as according to T2300426, changing the preloading changes the optical power by 2.4mD/in.lb.The preloading should make the magnitude of the optical power larger, so it should be increased to 667mD - 2.4mD/in lb * 27 in lbs = 602mD mD with 0 V on the PZT, 443mD with 200V on the PZT. This is an estimated ROC range of 3.3 to 4.5 meters for strain gauge -5.0 to +2.6V (it's range with 0V and 200V applied). This mostly agrees with Eric's data.
We have ZM4 SN1 installed now. Original data before we changed the preloading (E2100289) had the ROC range -19.3m to -9.0m. With at 0V applied -104mD optical power, with 200V applied -221mD.
In alog 75677 we increased the preload from 46 in lb to 75 in lb. An estimated linear increase of 70mD. This should be increased to -104mD - 2.4mD/in lb * 29 in lbs = -174mD mD with 0 V on the PZT, -291mD with 200V on the PZT. This is an estimated ROC range of -11.5 to -6.9 meters for strain gauge 1.0 to 8.3V. This mostly agrees with Eric's data.
I attempted to confirm these values by repeating this exercise with a second dataset from 90827. This was an additional set of q measurements made directly after ZM4. The idea here is that this should allow us to fit the ROC values for ZM5 only by taking these measured qs, propagating them through ZM 5 and comparing with the measurements from 90783. Unfortunately this did not proceed as smoothly. The fits and mode overlap values are tabulated below. This isn't too far from the old ROC range, but the agreement between the q values isn't nearly as good as before
Rough values for ZM5:
| ZM5 Strain (V) | ZM5 ROC (m) |
|---|---|
| -4.5 | 4.0 |
| -2 | 4.3 |
| 0 | 4.7 |
| 2 | 4.9 |
Mode overlap after propagating through ZM5 assuming the above ROC values. I was mostly optimizing the y value; the astigmatism seemed to be quite different in this dataset, leading to poor x/y agreement when propagating and comparing with the other data.
| ZM4 \ ZM5 | -4.5 | -2 | 0 | 2 |
|---|---|---|---|---|
| 2 | x = .975, y = .996 | x = .976, y = .990 | x = .954, y = .986 | x = .948, y = .982 |
| 4 | x = .981, y = .994 | x = .971, y = .986 | x = .956, y = .982 |
x = .947, y = .981 |
| 6 | x = .974, y = .992 | x = .969, y = .990 | x = .946, y = .977 | x = .937, y = .971 |
| 8 | x = .969, y = .990 | x = .955, y = .980 | x = .940, y = .970 | x = .930, y = .963 |
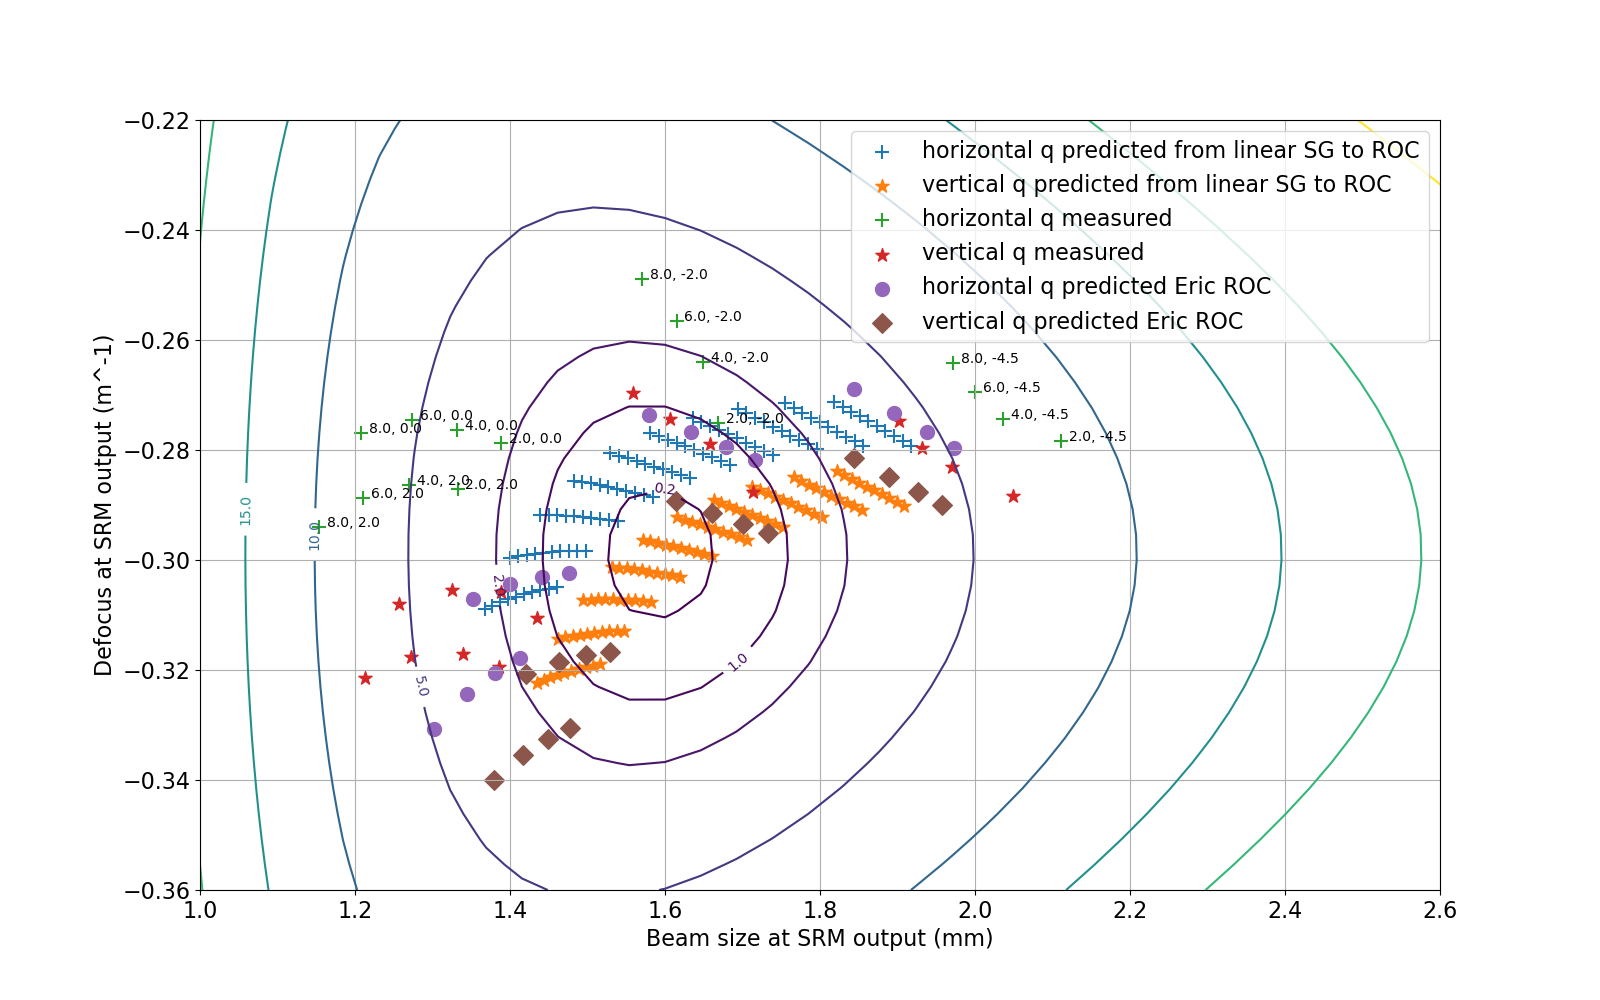
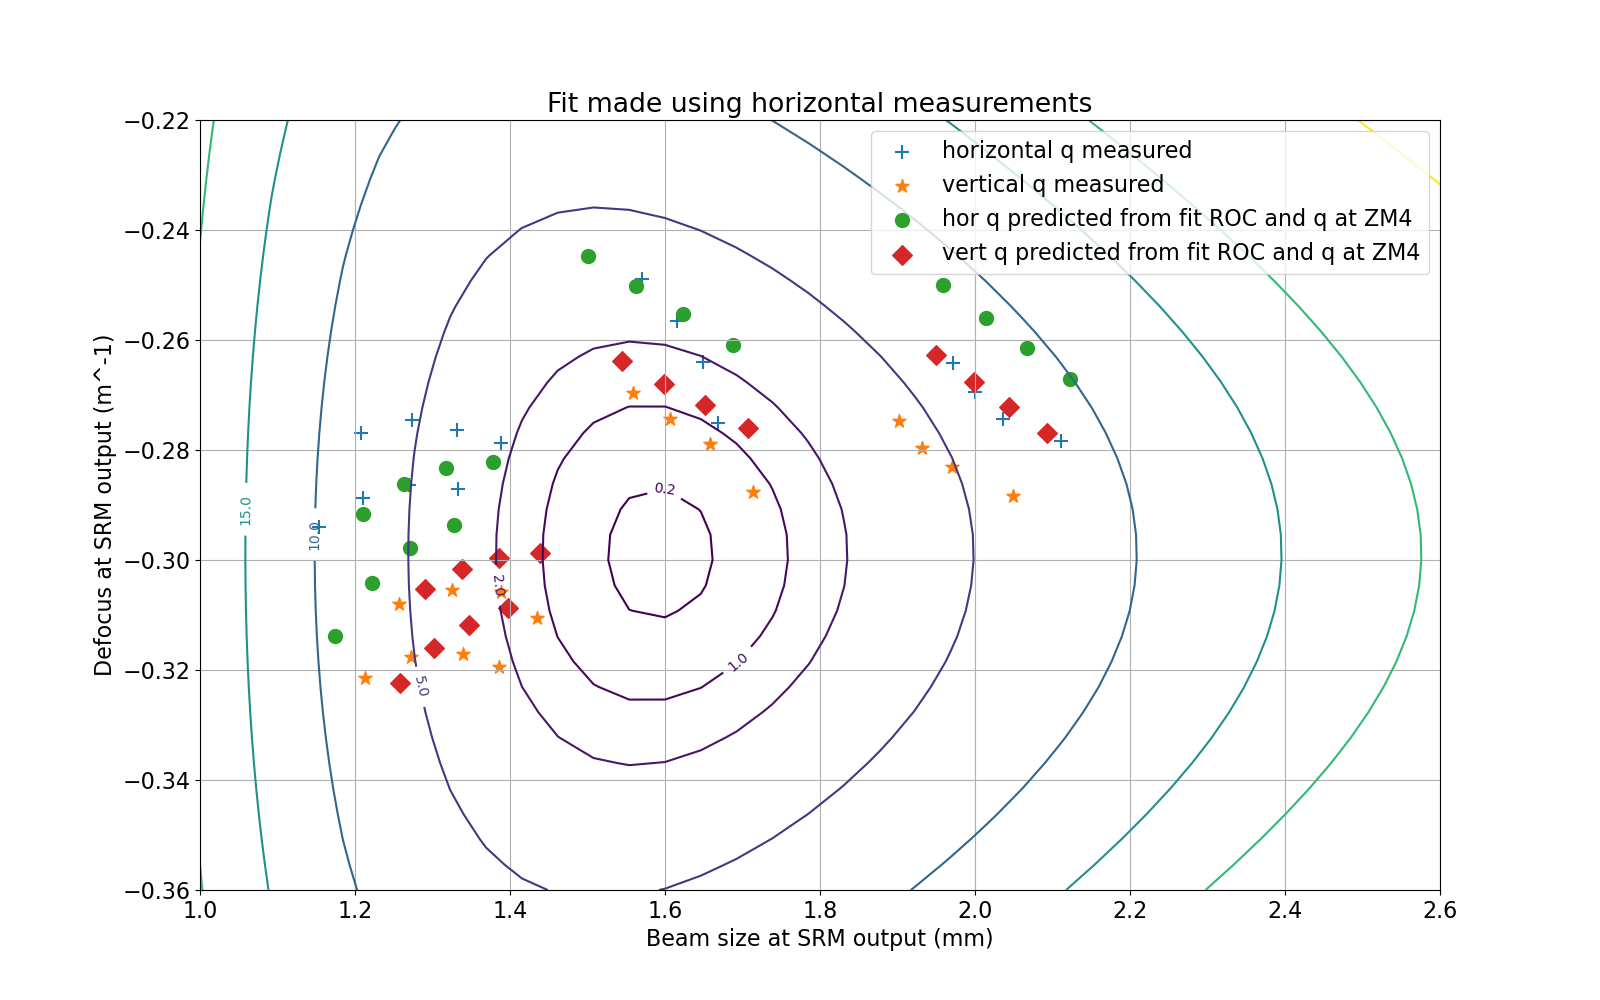
Attached is a Sw plot at SRM made using the ROCs Eric logged above, and the measured q at the input of ZM4.
The measurements seem to be systematically different from the prediction based on ROC and the input q. I reproduced the overlaps that Eric listed above, and they are similarly above 98% for all of these (the overlap between the prediction and the measurement for each strain guage pair).
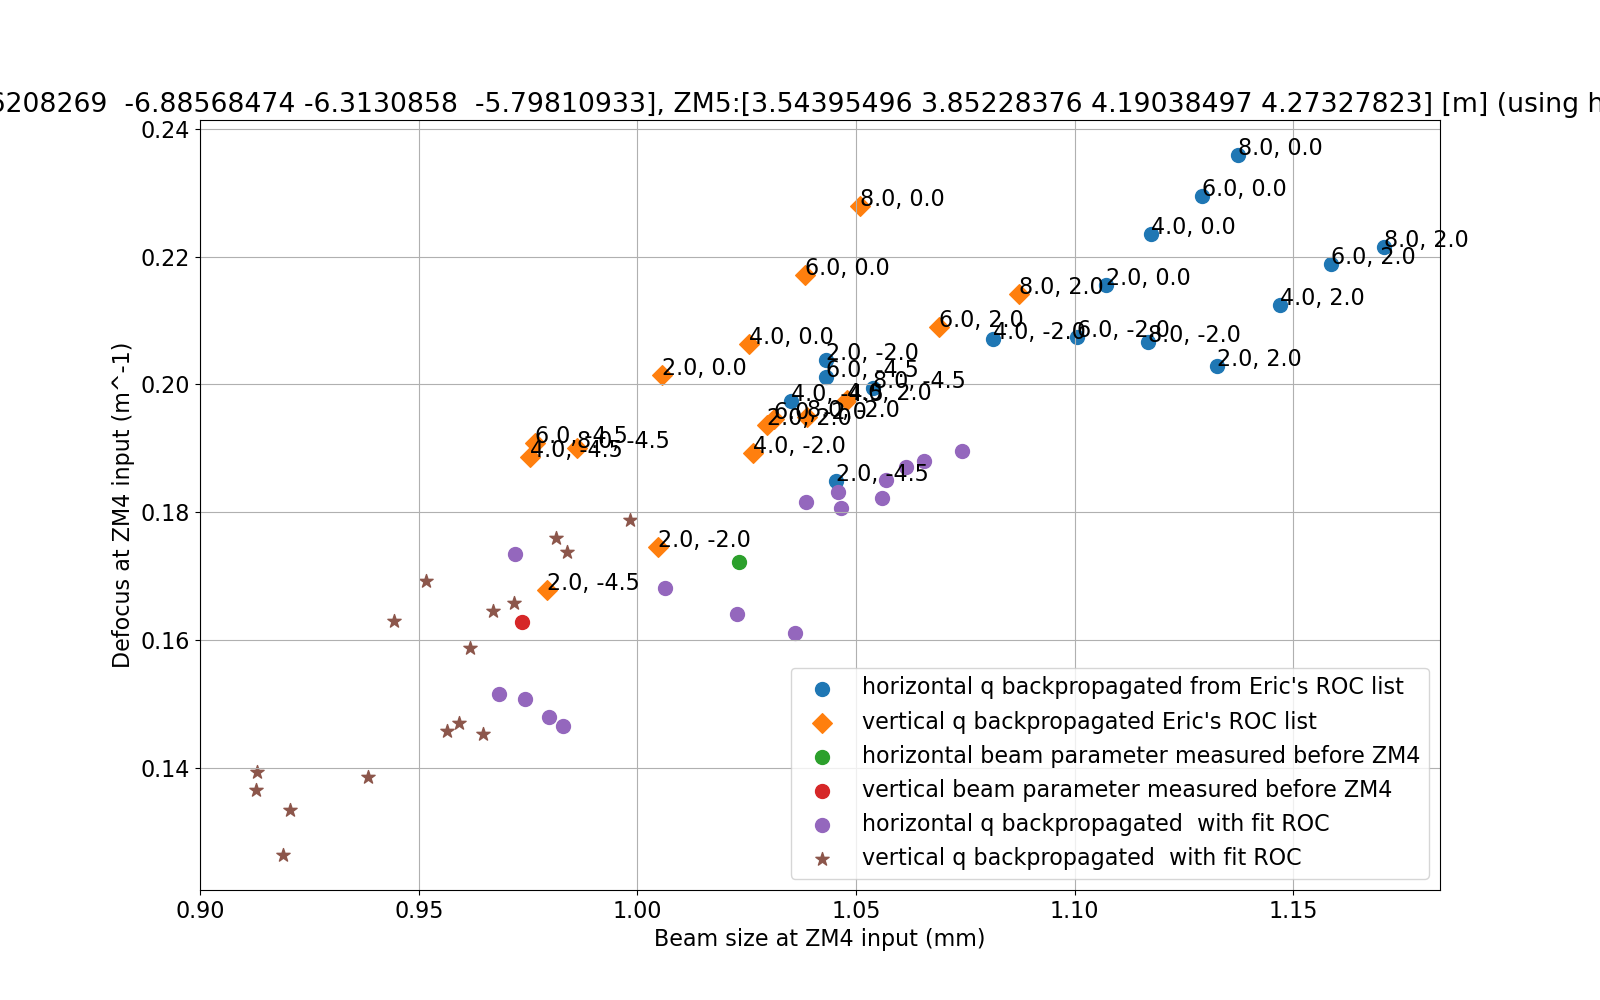
I also made a linear estimate of the diopters per strain guage based on the ROCs that Eric listed above, for ZM4 this give -7mD/ strain guage volt (for -11m ROC at 4V SG), for ZM5 -10.5mD/ SG V (for 4.05m ROC with SG at -2V). This is shown by the orange stars and blue + in the attached plot, there is some discrepancy with the red and brown "predicted" points (based on just the ROCs that Eric listed above and the input q), because of the nonlinearity of Eric's ZM5 ROCs.
Continuing from Camilla's accounting of where we want the ZM4 preload to be.
Eric's ROC values above show the range to be from -12m ROC to -9meters (this is not quite the full range but close to it), which is -170mD to -220 mD, so the range of ZM4 psams seems to be close to 50mD. In Camille's original charachterization data before the preload change E2100289 the range was 118mD.
If we make a decision on where we want to move ZM4 based on the OMC matching grid in the attachment to 90804, we would gues that we'd want the lower edge of the ZM4 range to be in the middle of the range. This means we want to reduce the pre-load by 25mD, reducing the pre-load by 10 in lbs, to 65 in lbs.
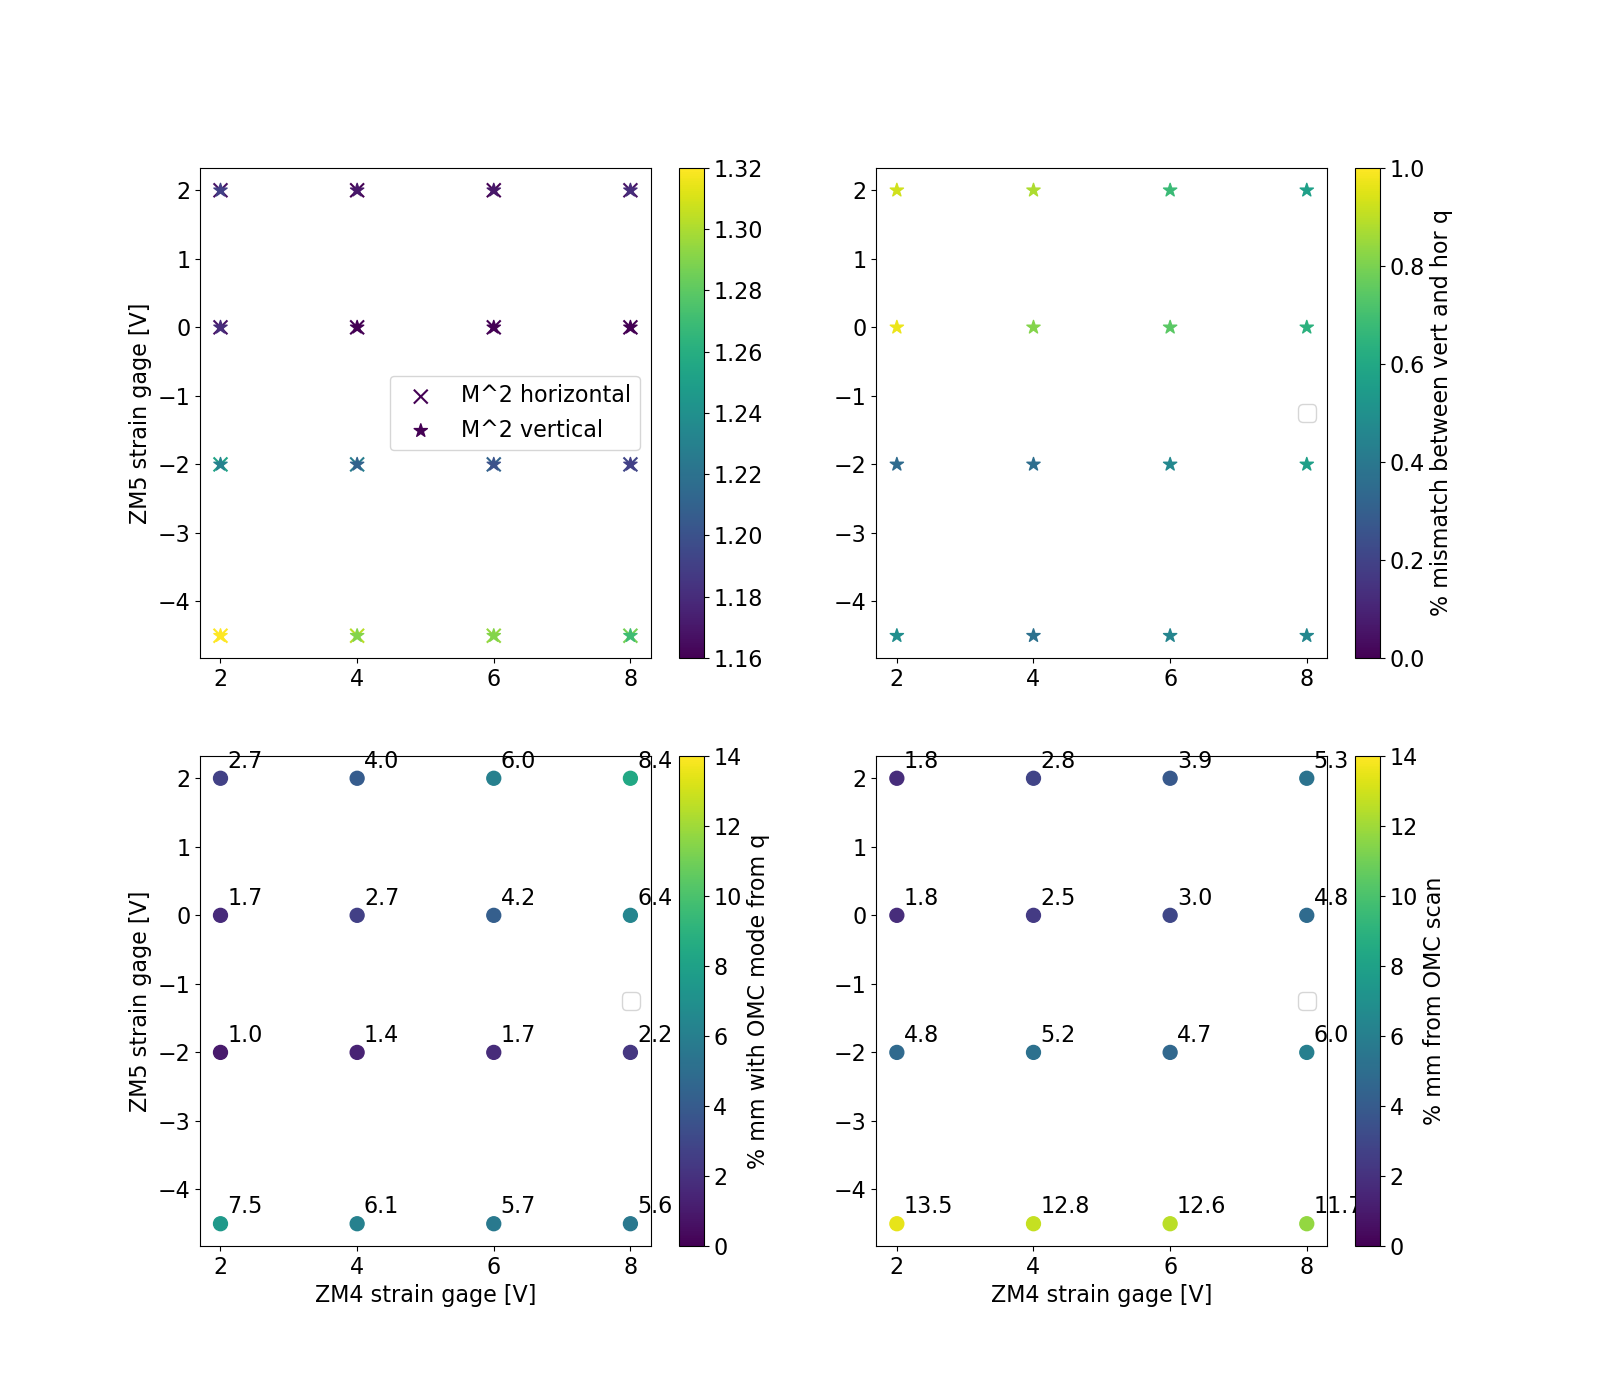
Above, Eric found ROCs for each strain guage value that can predict our measured q's after ZM5 (90783) starting with the measured q before ZM4, where the predicted qs overlapped with the measured qs by more than 98%. We are aiming for sqz to OMC mode matching of better than 99%, so I wondered if we can get better agreement than this with our measurement technique. If we want to be able to set ROCs or distances based on these measurements, we want to know if they are repeatable and consistent with a model at a level better than the mode matching that we are trying to acheive. In O4 we had squeezer to OMC mode mismatch of 2.2%, we would like that to be less than 1%.
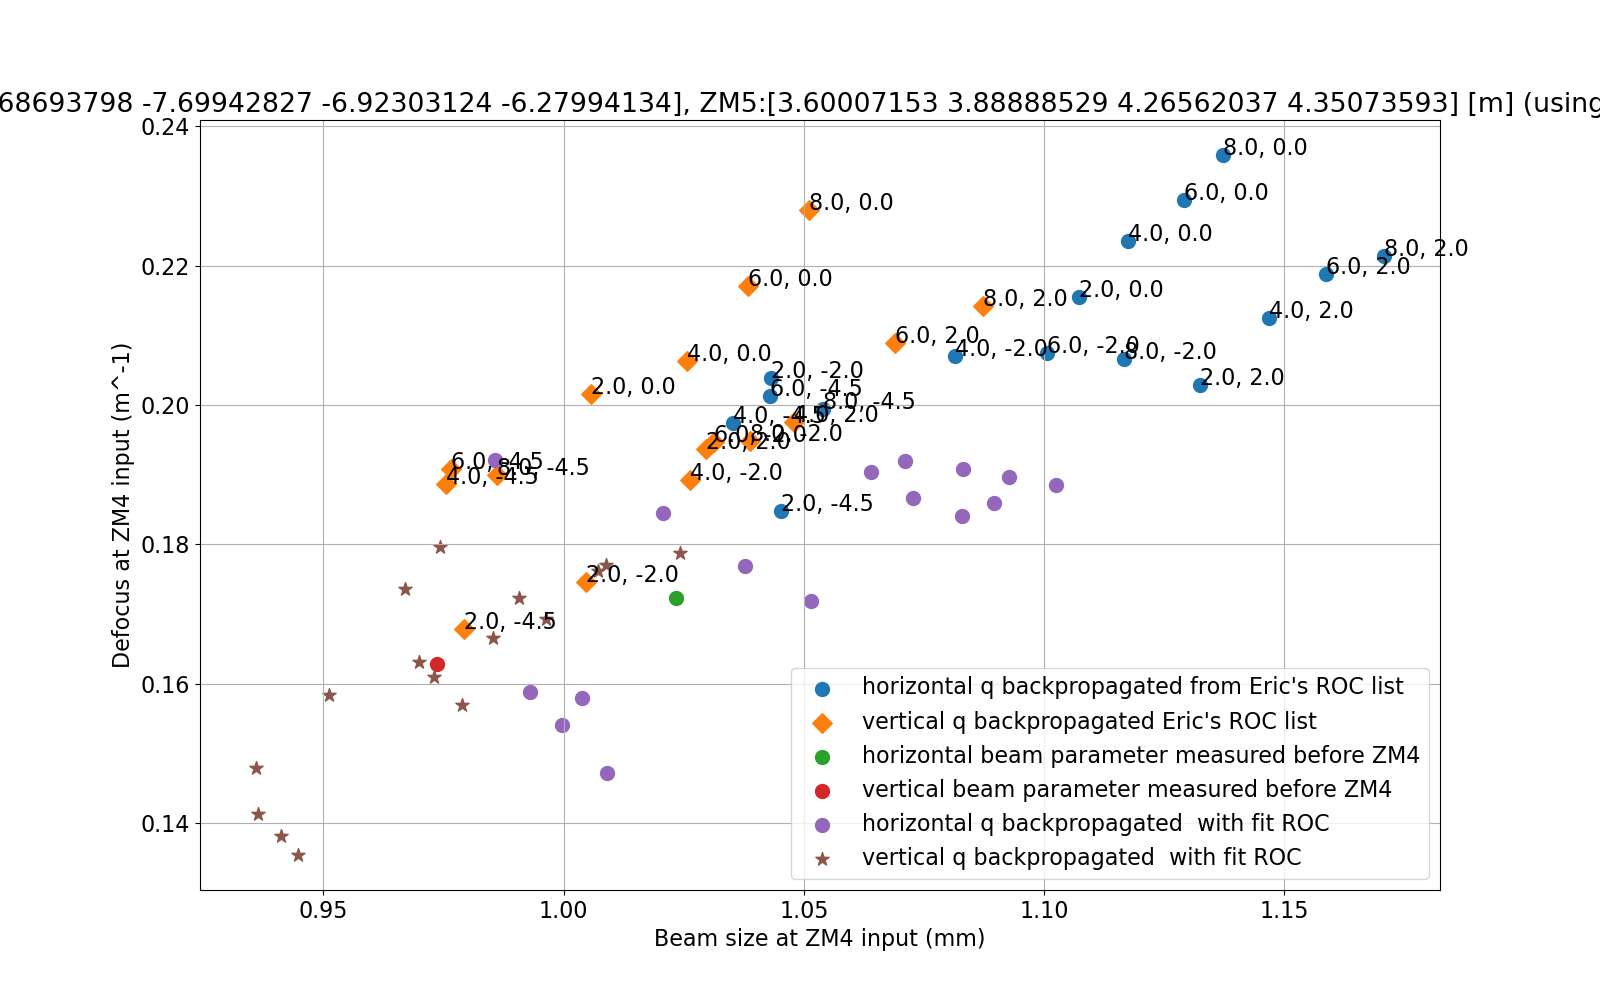
I take the q's measured after ZM5, propagate them back to before zm4 using the guesses for ROCs and the AOIs from the finesse .yml file, and calculates the overlap with the measured q before ZM4 for each. The sum off the mode mismatches is the cost function used to fit either vertical or horizontal ROCs. In this version of the script, it is fitting either the vertical or horizontal data, I would like in the future to have it include both in the cost function.
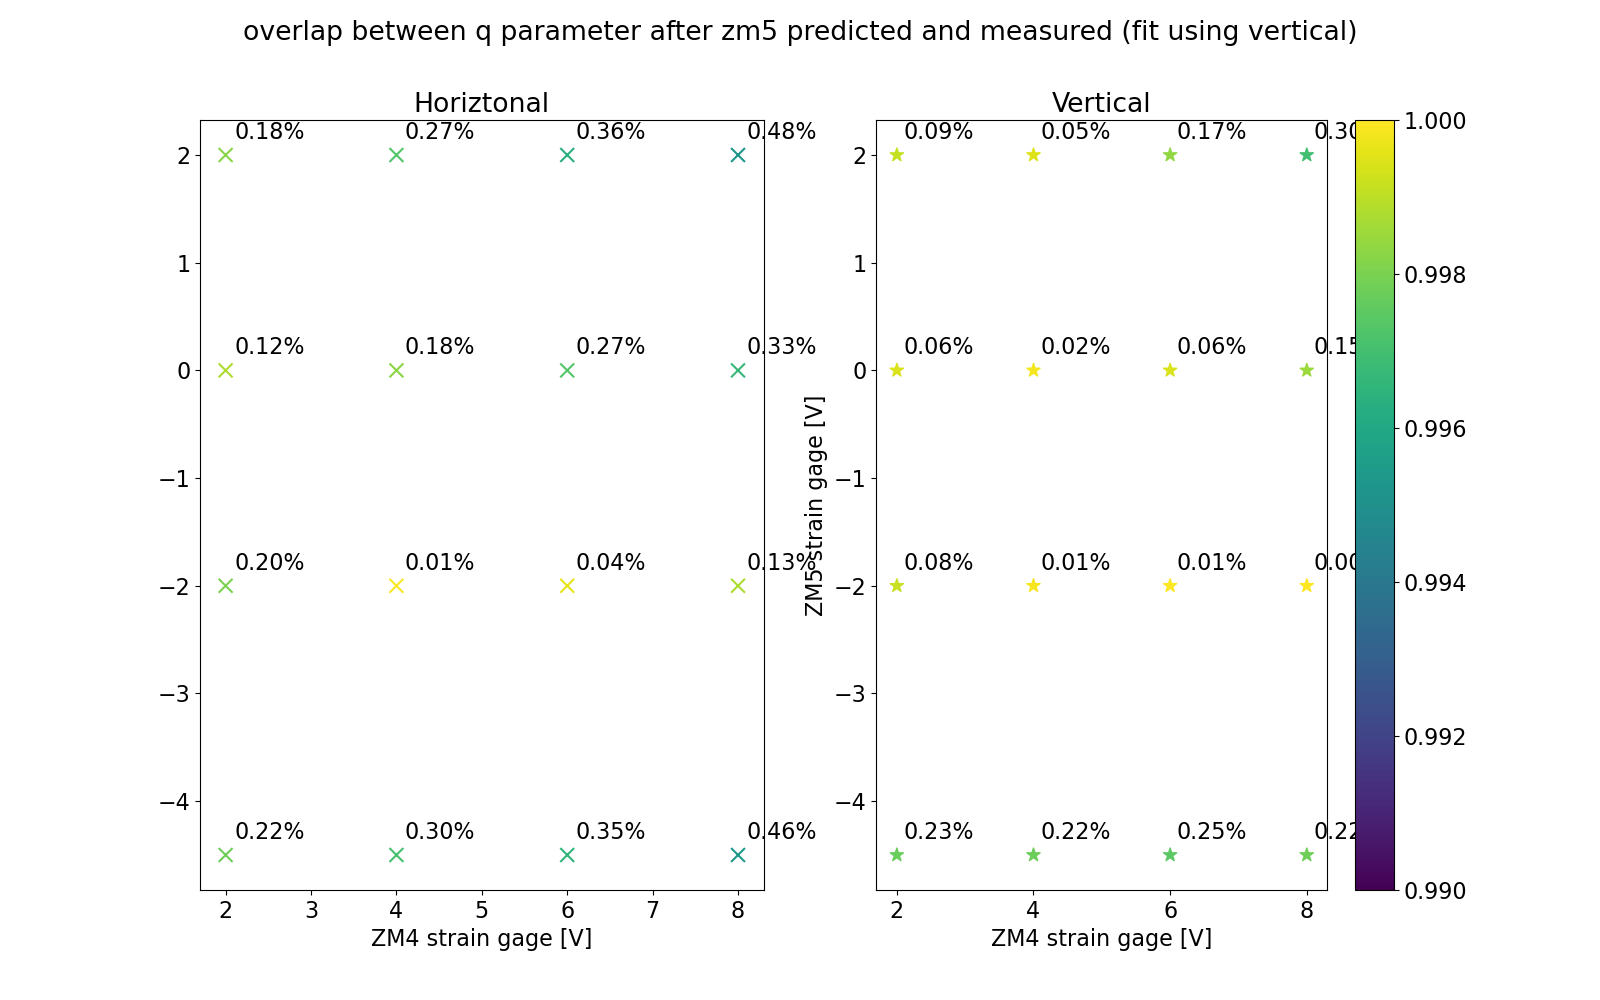
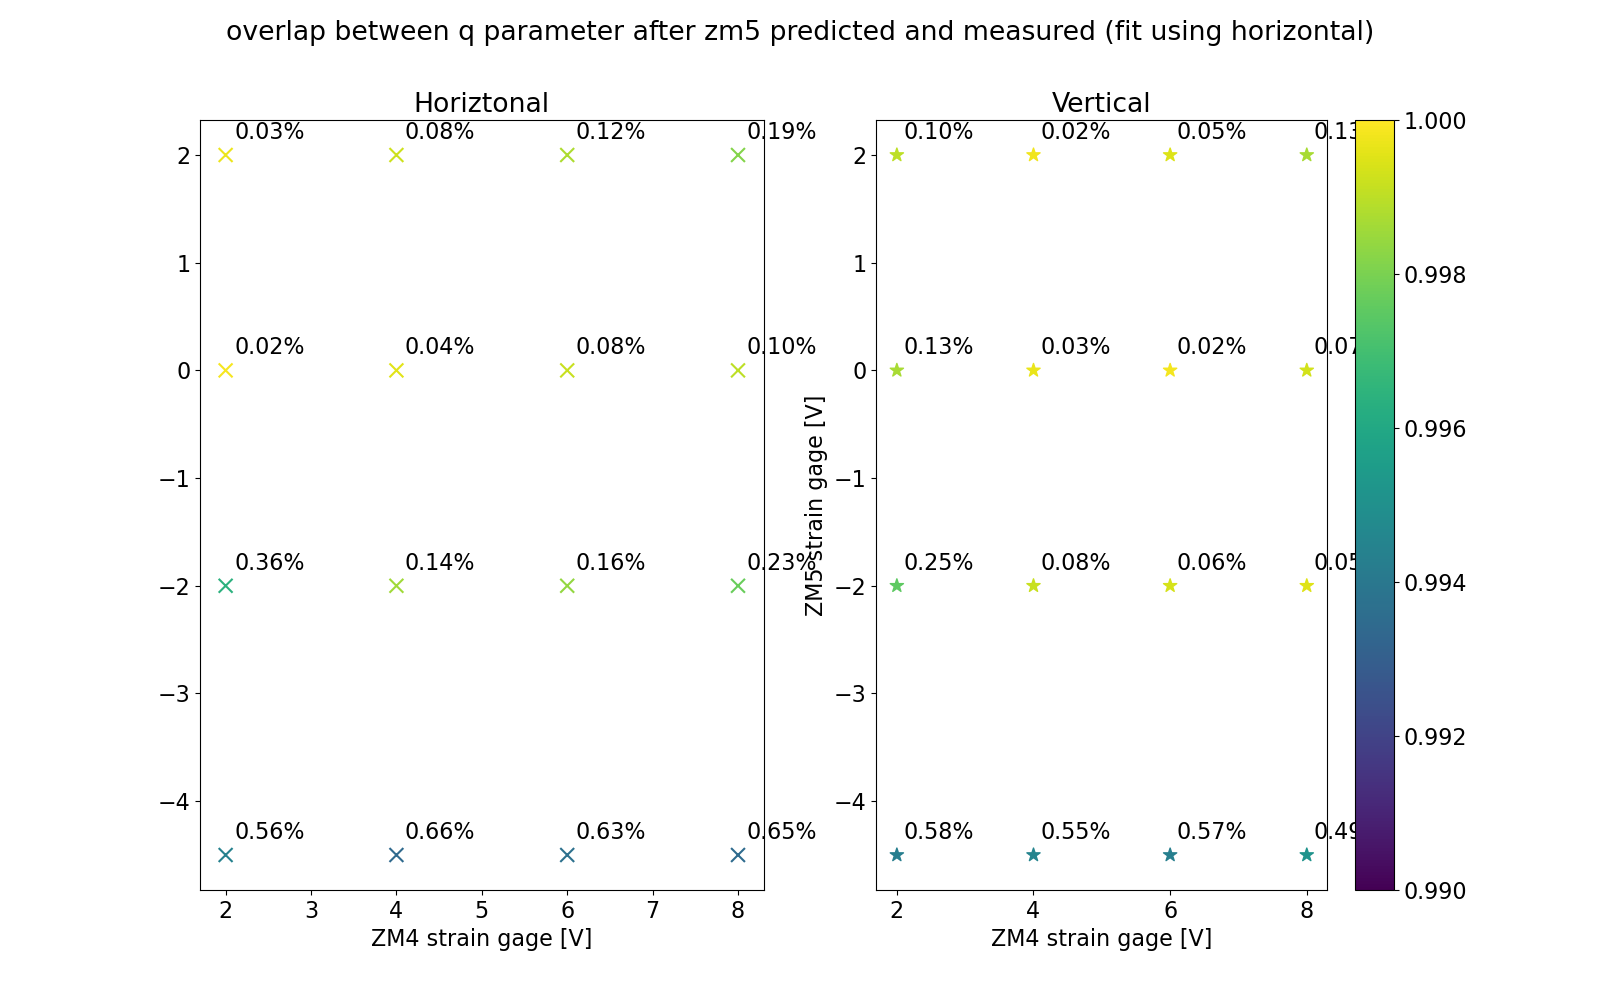
These plots (horizontal and vertical) show that this fitting results in overlap between the measured beam and the forward propagated beam using the fit ROCs is better that 99.5% for all the data. This is true when I use only the horizontal (vertical) data in the fit, and use those ROCs to propagate the vertical (horiztonal) mode. The worst overlaps are all for points measured where ZM5 strain guage was at -4.5V, which also had the worst values of M^2 (see top left panel).
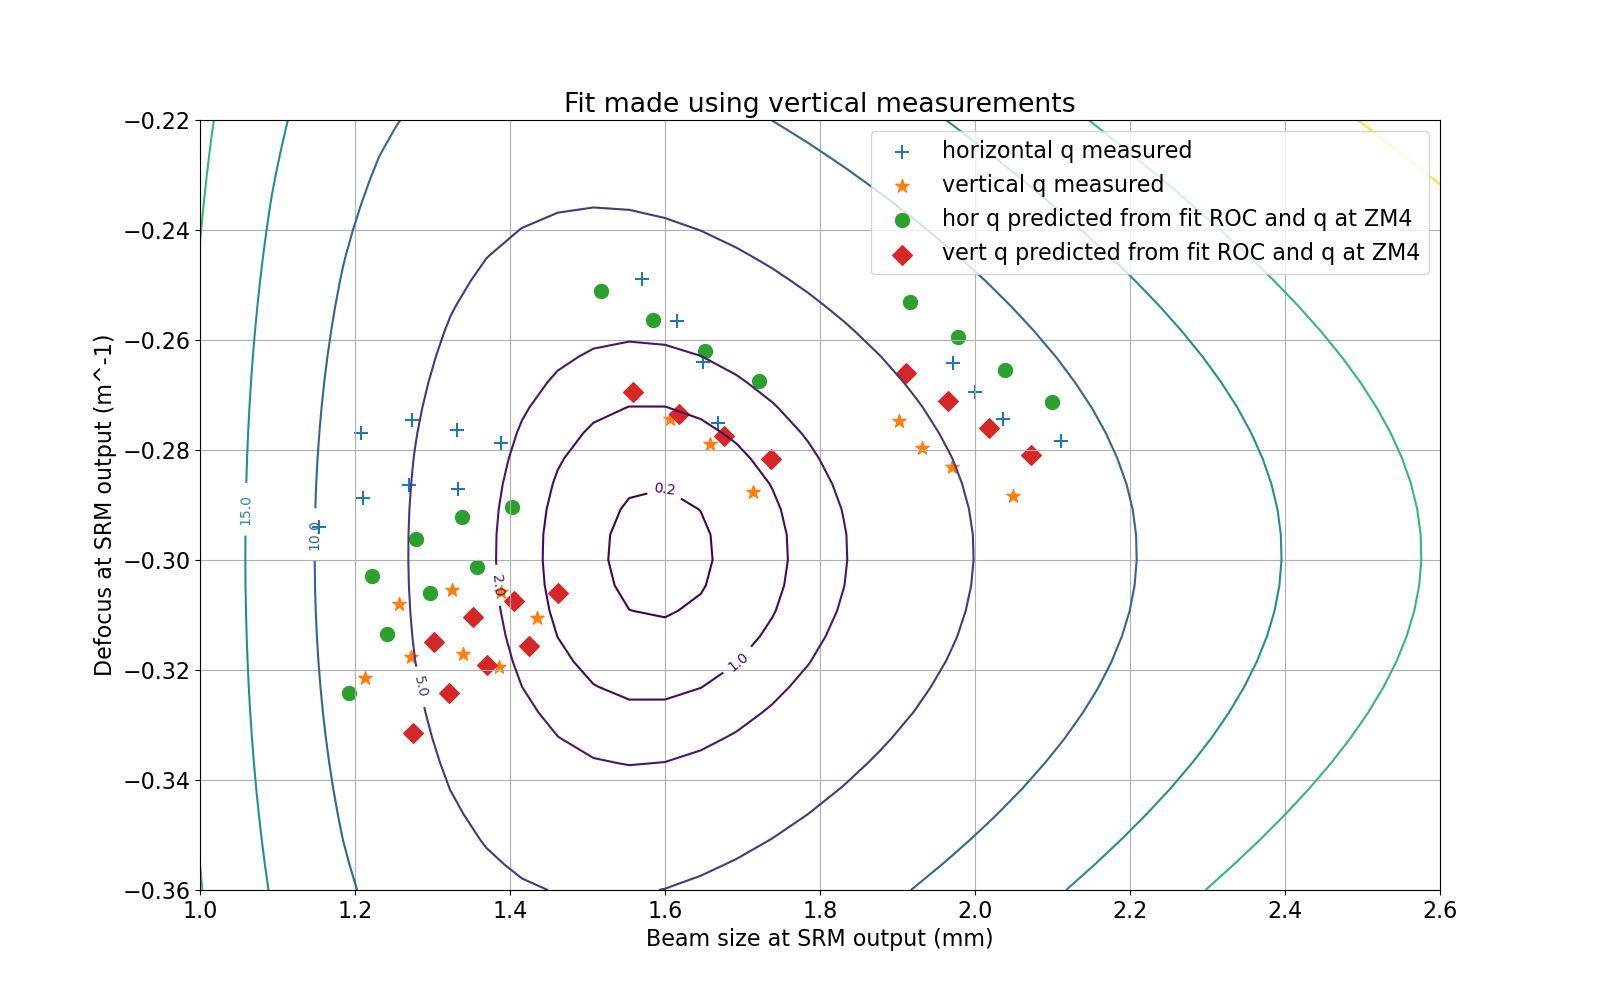
Using these fit ROCs and the measured q before ZM4, we can propagate to the usual Sw plot on the AR side of SRM, using either vertical or horizontal data gives us an sw plot that looks a lot closer to the measured data than the guesses above. I think this means that we can use this kind of fit data to determine what ROC we need to move us to a particular place in Sw space in the future, at least at the level of 0.5% mode matching.
| ZM4 (strain guage voltage) | 2 | 4 | 6 | 8 |
| ROC fit with vertical data[m] | -8.687 | -7.699 | -6.923 | -6.280 |
| ROC fit with horiztonal data [m] | -7.621 | -6.886 | -6.313 | -5.798 |
| ZM5 (strain guage voltage) | -4.5 | -2 | 0 | 2 |
| ROC fit with vertical data [m] | 3.600 | 3.889 | 4.266 | 4.351 |
| ROC fit with horizontal data [m] | 3.544 | 3.852 | 4.190 | 4.273 |
The script to make these fots and plots can be found here
I was curious to see what Sheila's improved fits imply for our hunt for the source of astigmatism in HAM 7. Below I've tabluated some calculations for the astigmatism, which I define as the difference in focusing power between the horizontal (X) and vertical (Y) directions for ZM4/5
For ZM4
| ZM4 SG | 2 | 4 | 6 | 8 |
|---|---|---|---|---|
| Rx (m) | -7.621 | -6.886 | -6.313 | -5.798 |
| Ry (m) | -8.687 | -7.699 | -6.923 | -6.280 |
| Dx - Dy (mD) | -32.2 | -30.7 | -27.9 | -26.5 |
| Dx/CosT - Dy*CosT (mD) | -50.5 | -51.1 | -50.4 | -51.1 |
Here T is the angle of incidence (15.5 degrees for ZM4). We see that the the large AOI has a noticible impact on ZM4
For ZM5
| ZM5 SG | -4.5 | -2 | 0 | 2 |
|---|---|---|---|---|
| Rx (m) | 3.544 | 3.852 | 4.190 | 4.273 |
| Ry (m) | 3.600 | 3.889 | 4.266 | 4.315 |
| Dx - Dy (mD) | 8.8 | 4.9 | 8.5 | 8.4 |
| Dx/CosT - Dy*CosT (mD) | 13.0 | 8.9 | 12.1 | 11.9 |
Here T is the angle of incidence (5 degrees for ZM5)
The physical astigmatism (Dx - Dy) of the PSAM optics appear to be typical of the characterization data at Caltech in 2021.
See this presentation from Lee McCuller: https://docs.google.com/presentation/d/12UynUfIfyXmggvRKFq-OTcJKO3U0TrhD8XnKnrJE1CA/edit?usp=sharing
And his corresponding calcuations from the raw data: https://git.ligo.org/wieldphysics/wield-ligo-mcculler/-/tree/main/src/wield/LIGO/mcculler/mirror_maps?ref_type=heads
Implications for X/Y overlap in HAM 7:
Note: I do my best here to calculate the expected impact of the various ZM mirrors on our X/Y mismatch. I'm fairly new to analyzing AWC optics, so take these calculations with a grain of salt.
From this we can calculate the astigmatism-induced mode mismatch between the x and y directions due to reflection off of ZM4 and ZM5. This can be done using Equation 23 in the following technical document: https://dcc.ligo.org/LIGO-T1900144
I believe that one wants to take the square root of eqn 23, since we are interested in calculating a 1D overlap integral between X and Y of a single beam rather than a 2D overlap between two separate beams.
We use the following paramters in Eqn 23:
w = beam spot size on ZM4 or ZM5 (roughly 1 mm and 2 mm respectively)
D = difference in defocus between X and Y for either ZM4 or ZM5 (Just the last line of the two tables above)
I find roughly that |k00|2 = 0.997 for both ZM4 and ZM5. The impact is small and, because the astigmatism appears to have the opposite sign for each optic, the effect of ZM4 and ZM5 will probably cancel one another to some degree (this should be straightforward to calculate, I just haven't done it here). This suggests that the impact on our X/Y overlap due to the astigmatism on ZM4 and ZM5 is likely not a significant limit to our squeezing level at present. I'll take a look at the raw q values later to see if they tell a consistant story, will hopefully confirm that these back-of the envelope calcs using this T-doc are reliable.
However, our measurements on SQZT7 suggest that we do have noticible astigmatism. ZM2 seems like a more likely culprit due to the larger beam spot size on that optic (w = 2.5 mm).
Rough estimate of the impact of ZM2:
For 10-20 mD of astigmatism from ZM2 with w =2.5 mm, the mode overlap between X and Y would lie between:
|k00|4 = 0.9916 to 0.9671
I dont think that this naive calculation where I square the result for a double-passed optic is correct in general for a retroreflected path, but my intuition is that this should be roughly right in our case because ZM2 actuates mostly on the beam defocus at FC1. I'm not that confident in my intuition, so I plan to confirm this with some finesse modeling.
This might account for the astigmatism measured on SQZT7. Further measurements before/after ZM2 would allow us to confirm this theory.