shoshana.apple@LIGO.ORG - posted 15:16, Wednesday 22 July 2026 - last comment - 13:10, Monday 27 July 2026(91179)
CRS Commissioning Updates
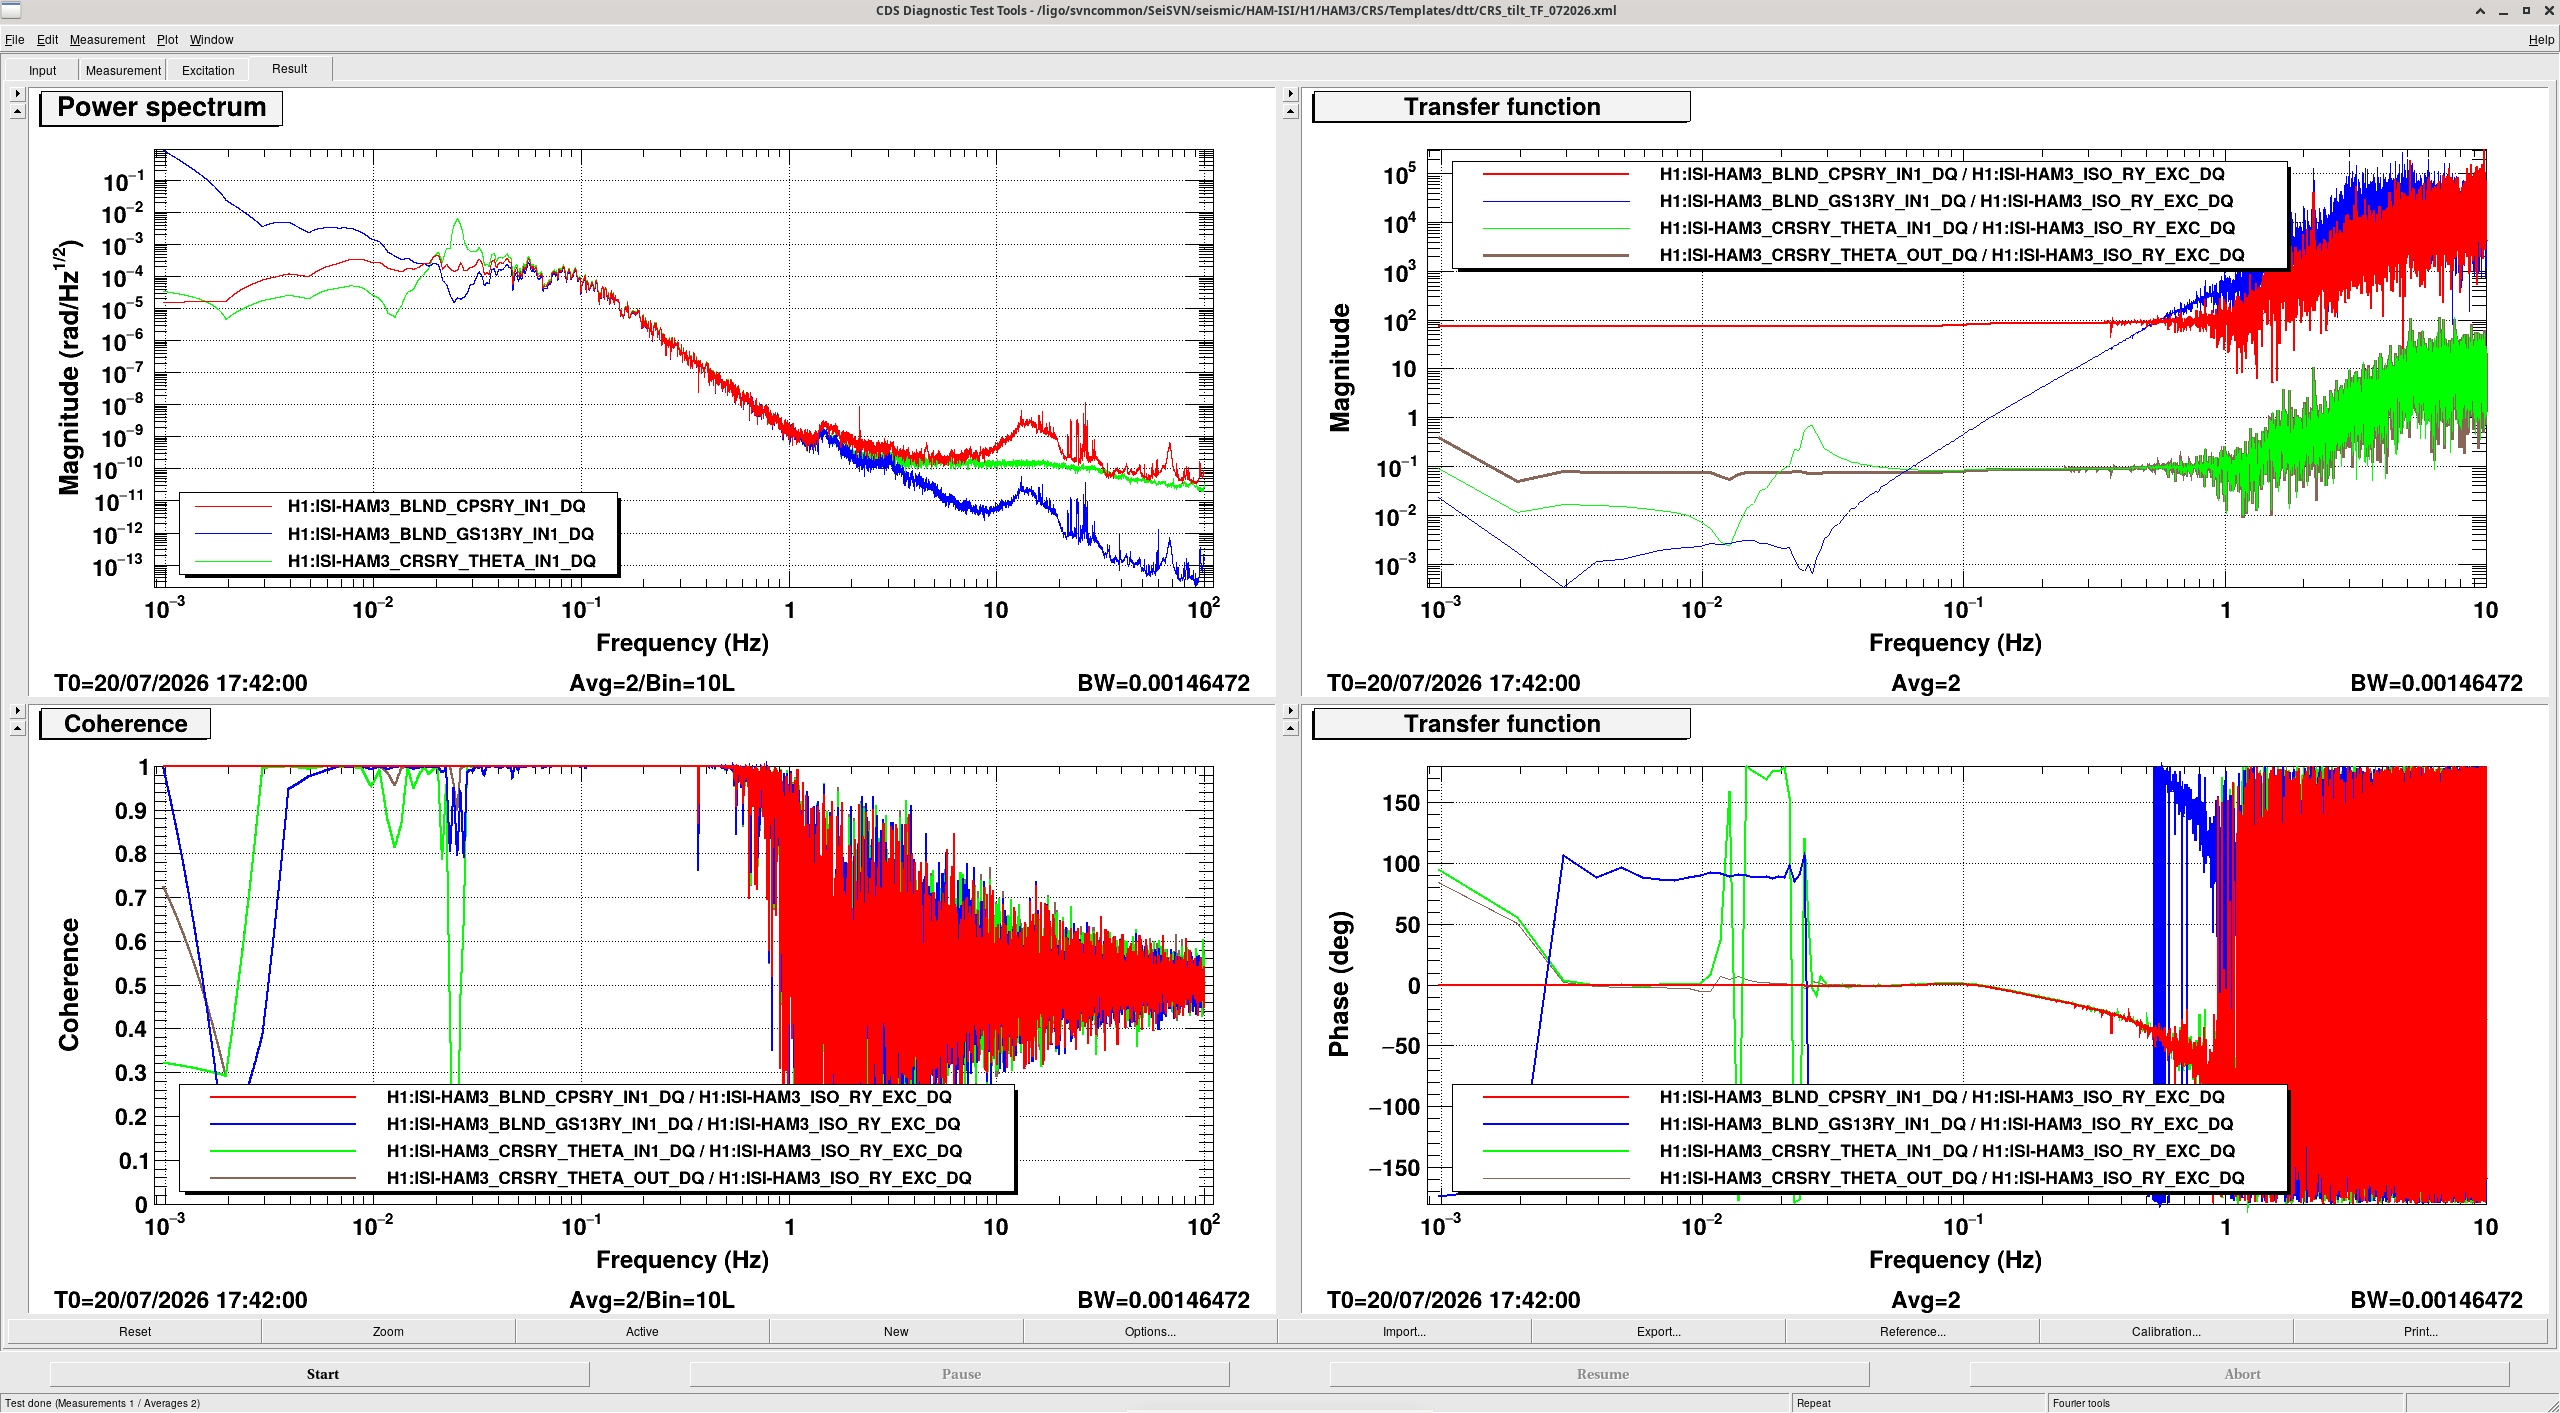
We been commissioning the CRS this week, so far we've done a tilt to tilt measurement:
- We excited RY on HAM3 for about 40 minutes starting around 1468604538 (2026/07/20/17:42:00). The excitation template is located at /ligo/svncommon/SeiSVN/seismic/HAM-ISI/H1/HAM3/CRS/Templates/dtt/ryex2.txt, and we ended up finding that setting the gain to ~2000 works well.
- The dtt template used is CRS_tilt_TF_072026.xml and is located in /ligo/svncommon/SeiSVN/seismic/HAM-ISI/H1/HAM3/CRS/Templates/dtt/CRS_tilt_TF_072026.xml
- Because the excitation window was so short (~40 minutes), we can only get 2 averages, and I've attached a picture of the result of the measurement (picture 1). We used these measurements to calculate parameters of the response function using a Matlab script which fits the data gotten from the excitation.
- The script used to get these parameters are in /ligo/svncommon/SeiSVN/seismic/HAM-ISI/H1/HAM3/CRS/Scripts/CRS_TransferFunction.m
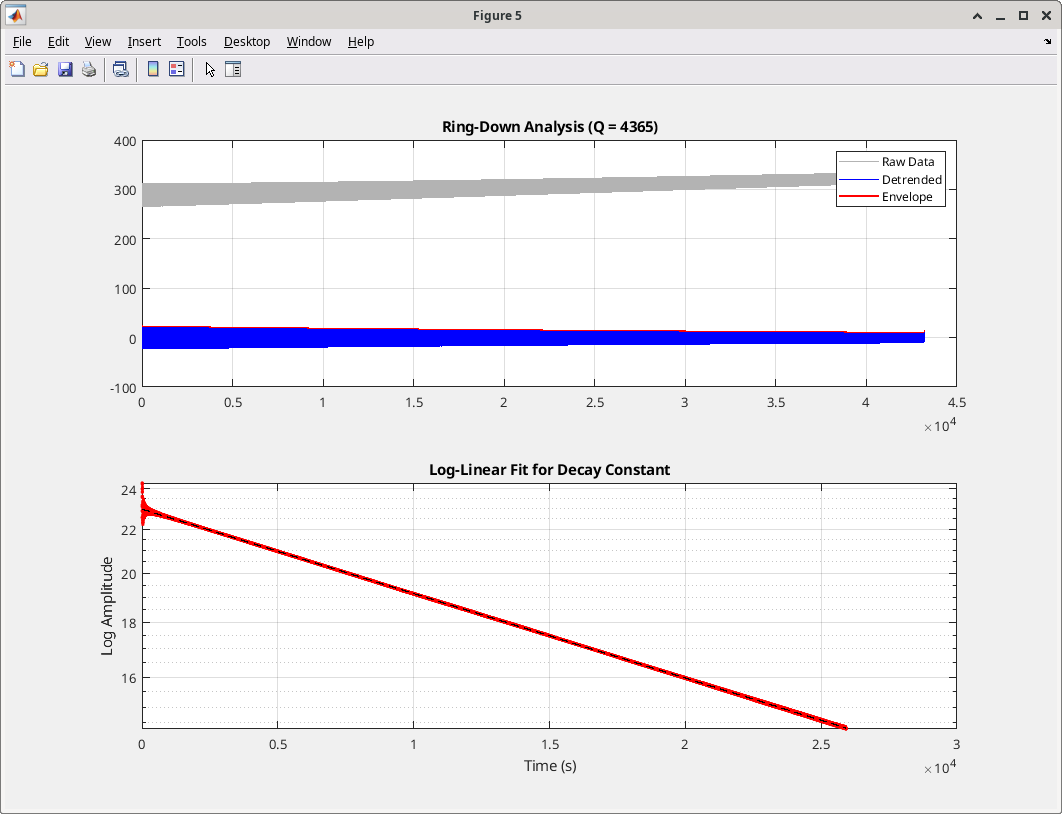
- To run the script, we got a Q measurement for the CRS in vacuum using /ligo/svncommon/SeiSVN/seismic/HAM-ISI/H1/HAM3/CRS/Scripts/ring_down.m and looked at a 12 hour period starting at 1468630128, which gave a Q measurement of 4365.
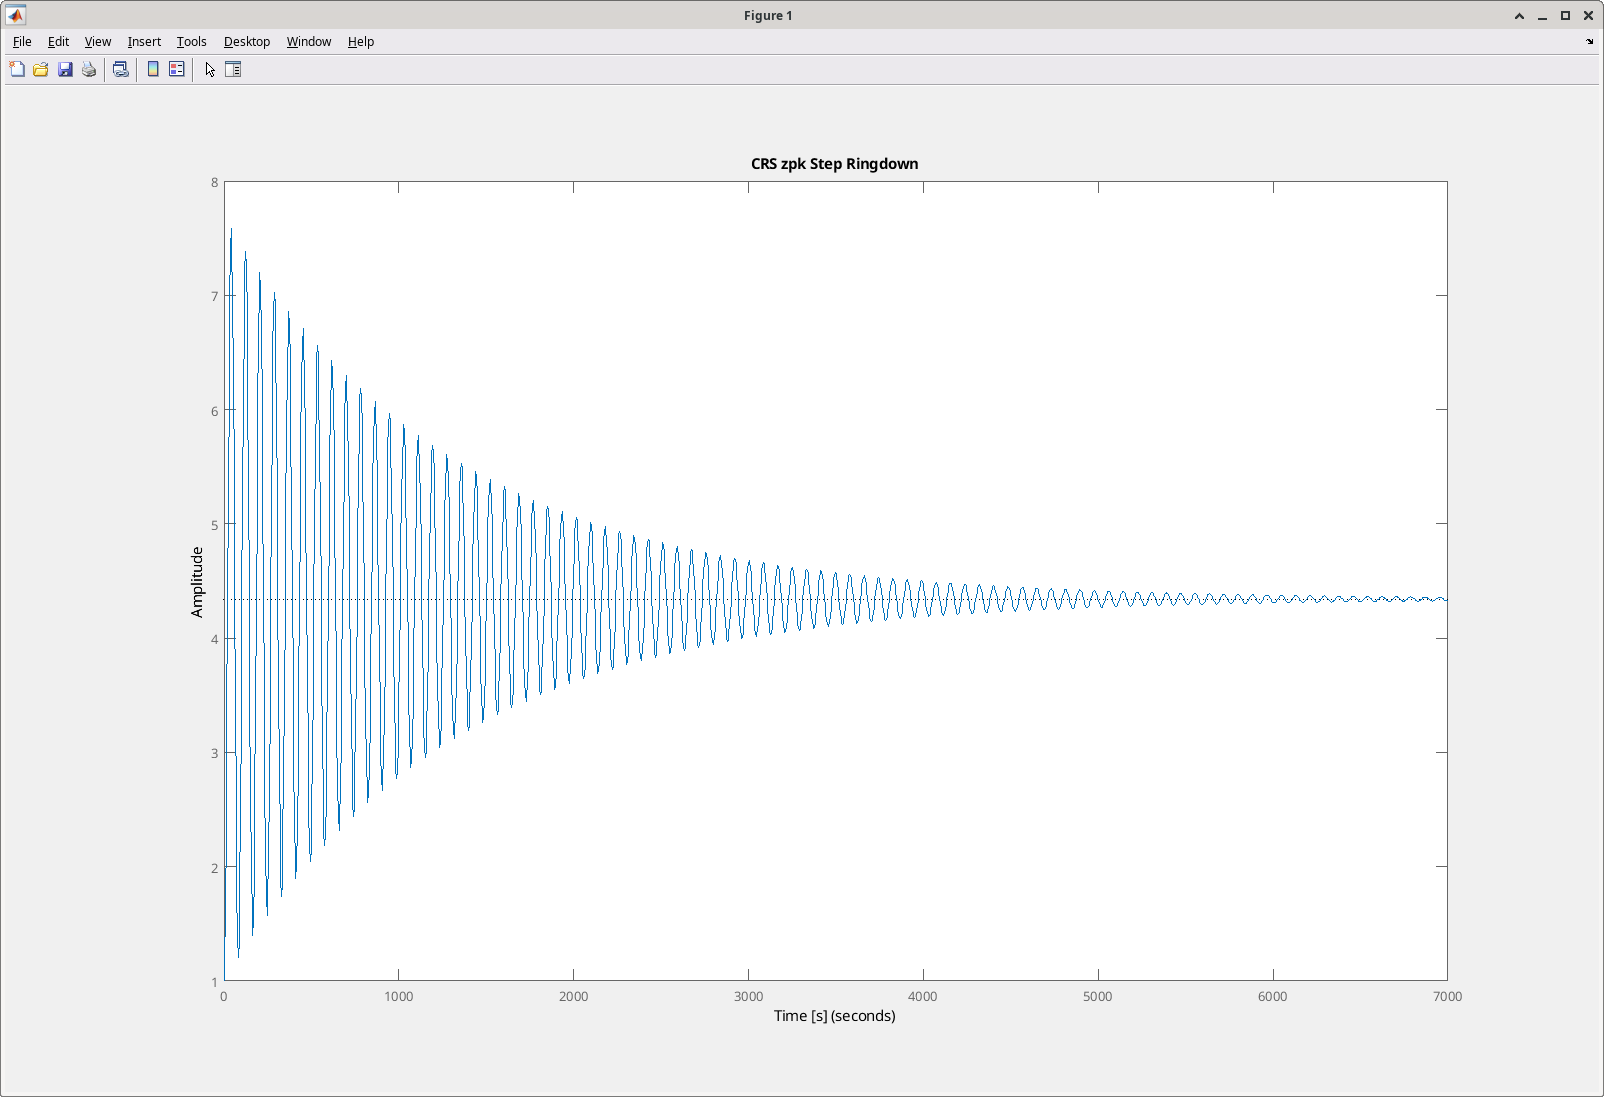
- Using the parameters from CRS_TransferFunction.m, we got the zeros and poles of the CRS response and used those to make a new SensInv filter (SensInv_Meas) for the CRS (H1ISI_HAM3_CRSRY_THETA, located in the THETA block of the CRS_OVERVIEW). We used a Q of 50 for the zpk to determine ring down times.
Summary:
- In vacuum Q of 4365 (picture 2)
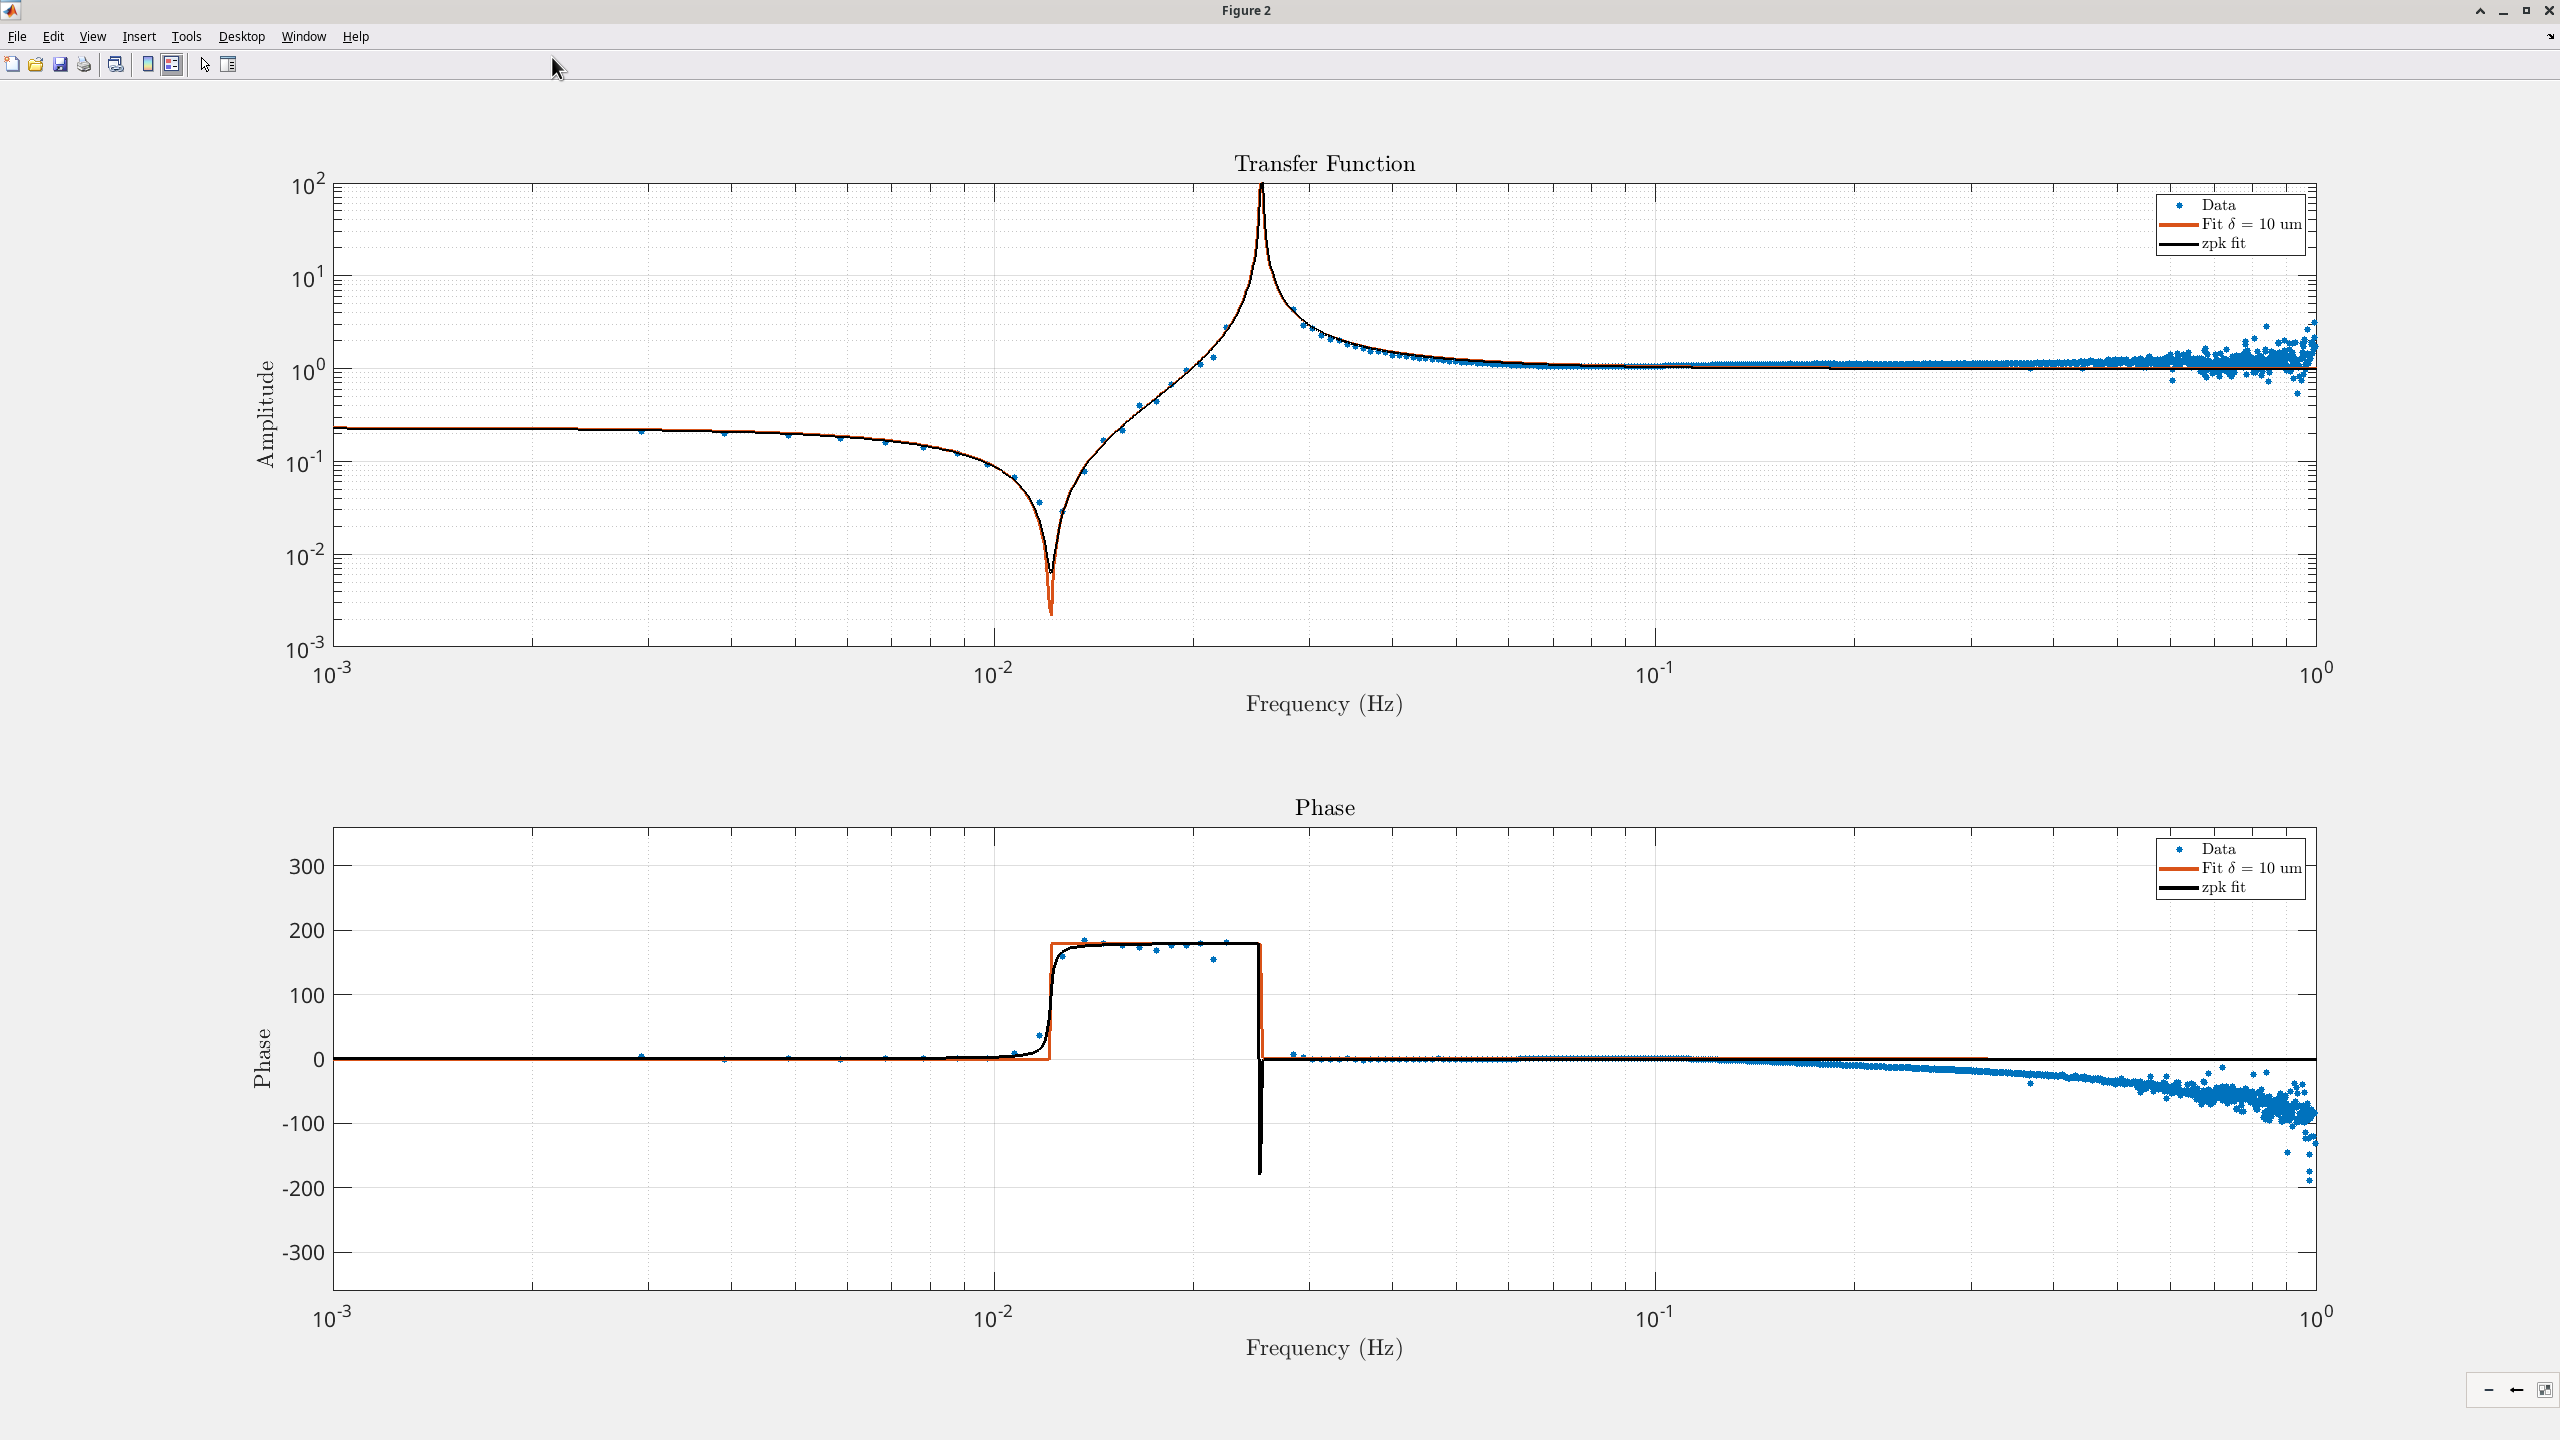
- Parameters: delta = 1.04e-5m, w0 = 0.0222Hz, wR/(2pi) = 0.0253Hz (which is what we expect), wg=0.0764
- Found response from both fitting the data and from zpk parameters (picture 3)
- Created new inverted response filter called SensInv_Meas (ring down plot in picture 4)
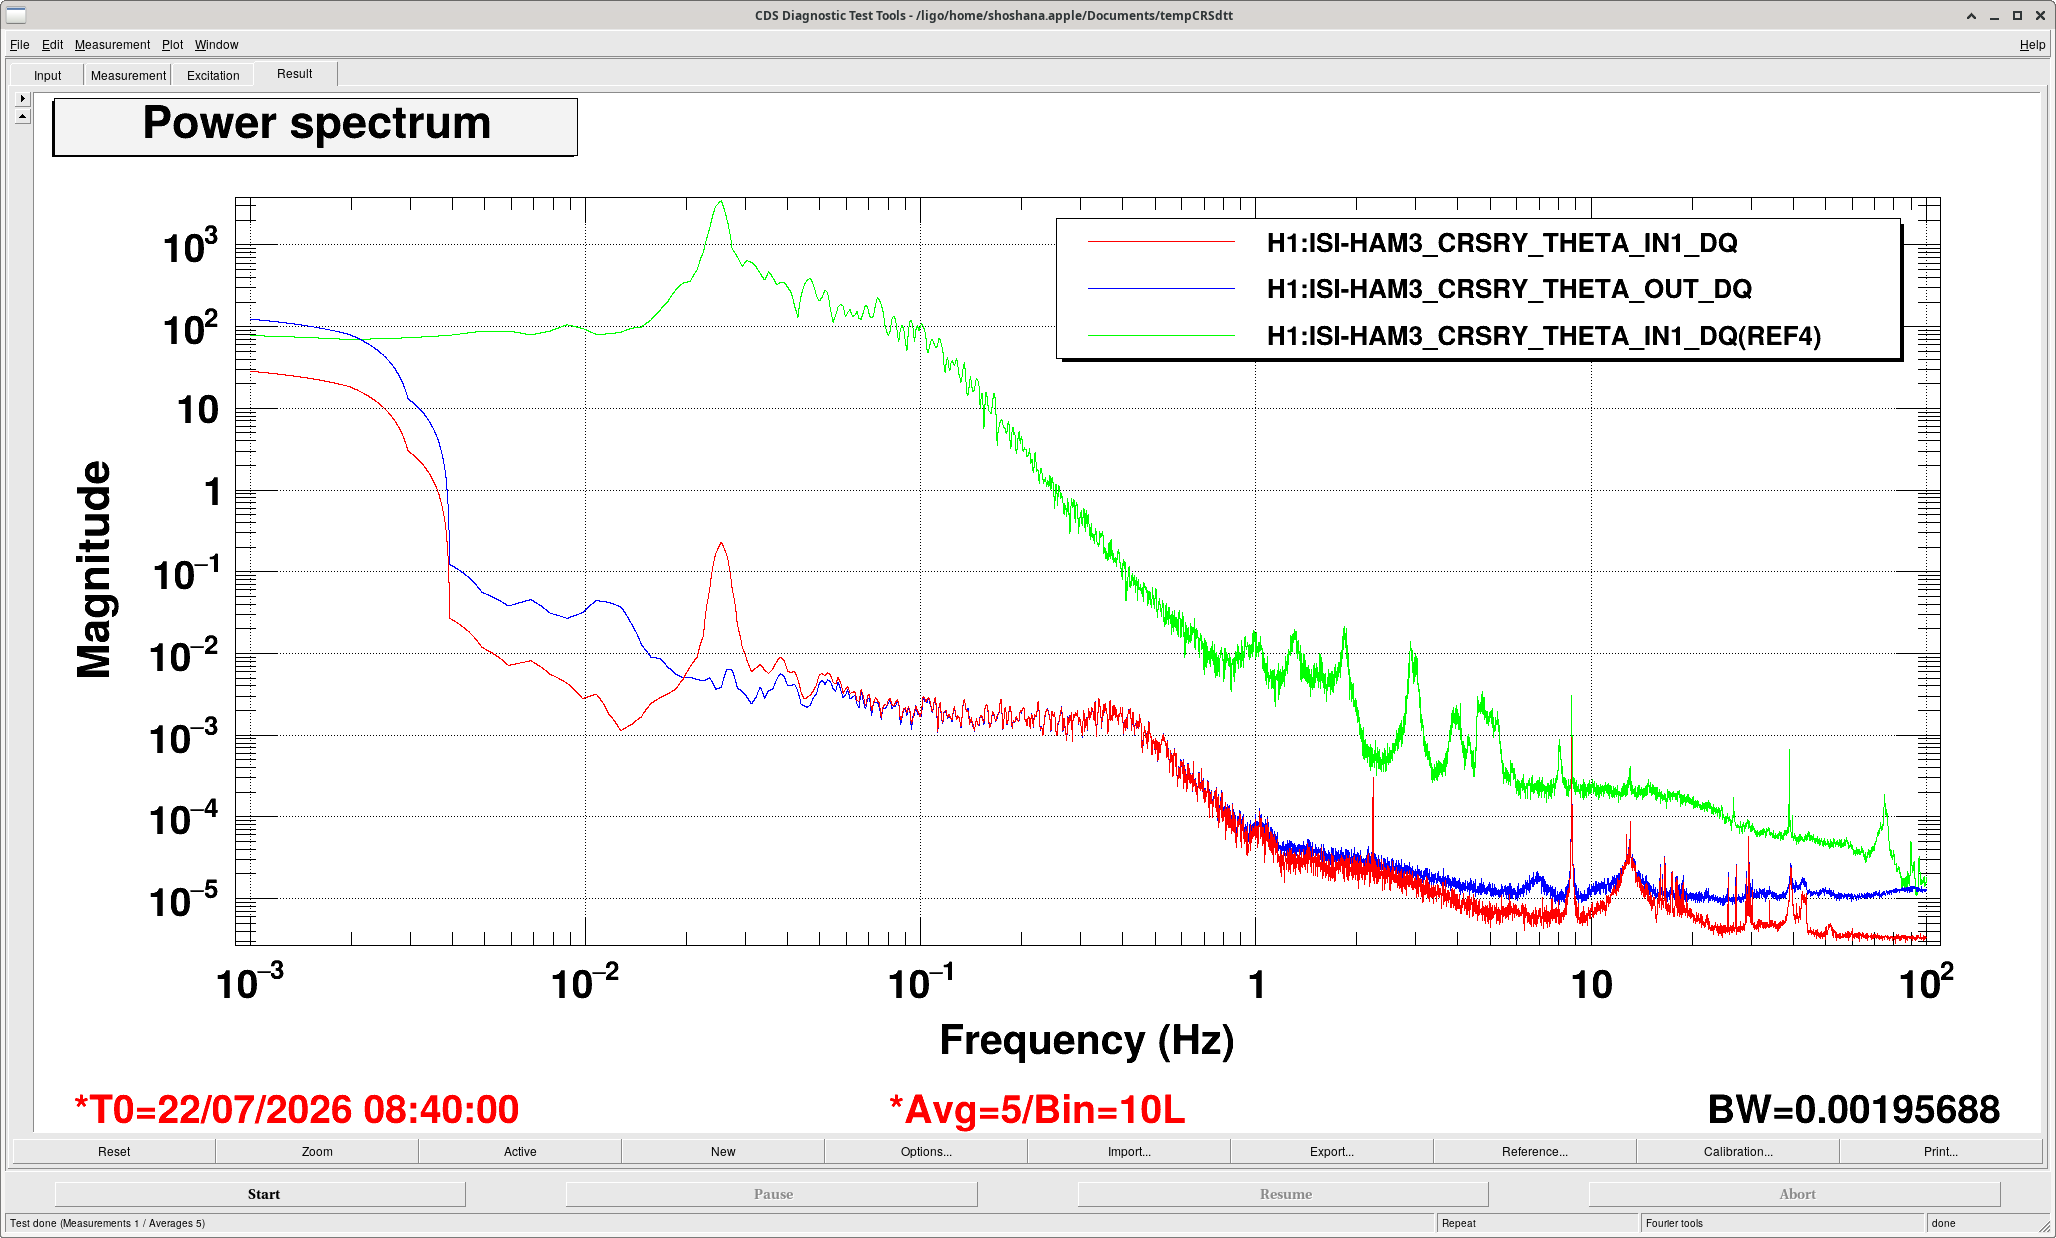
- Looking at the in air (1467529134) vs in vacuum (1468744818) performance (picture 5, with in air being green), the noise has decreased significantly
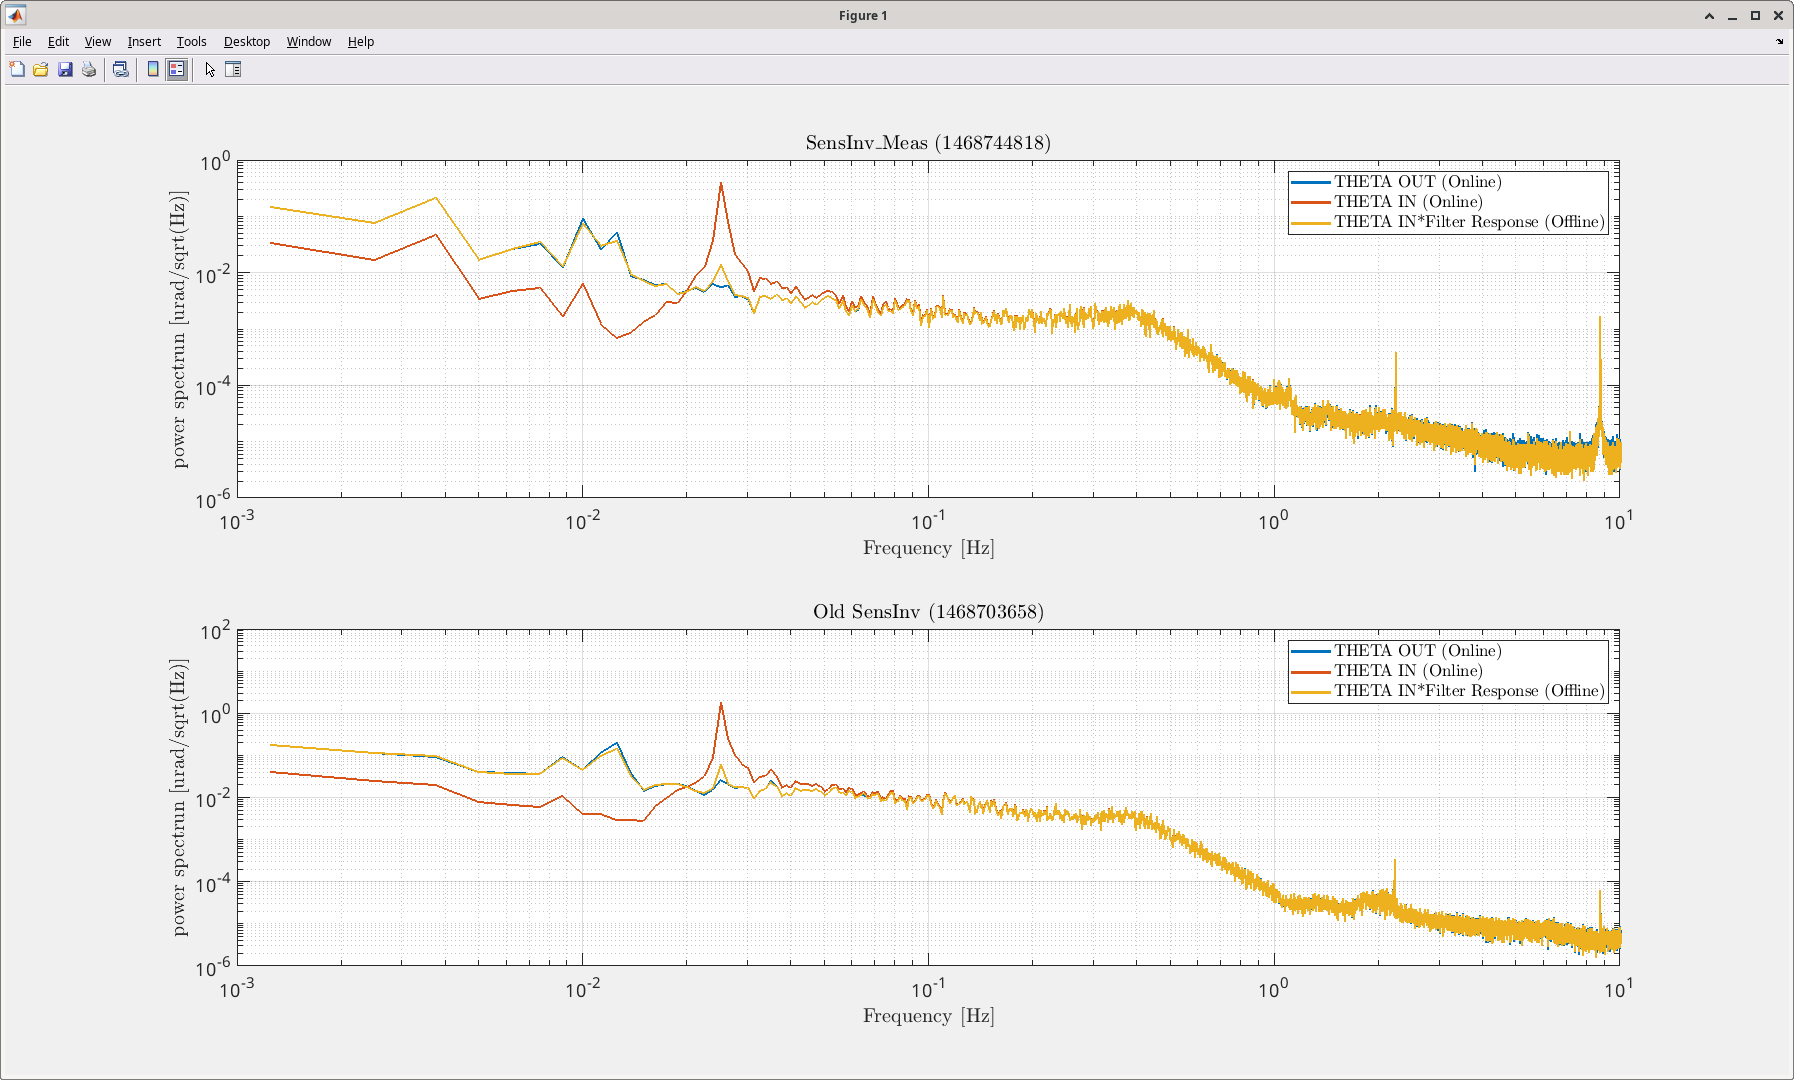
- On a slightly related note, it seems like there is an issue with dtt displaying the spectrum at higher (>1Hz) frequencies. When plotting the same channels at the same time, and applying the response inversion filter offline in Matlab, the post inversion signal (THETA_OUT) doesn't flatten out and follows the input (THETA_IN1) (picture 6)
- Arnaud also found that adjusting the windowing settings in dtt gives a better measurement (see SEI alog 2582) I've applied the change to the most recent CRS template.
Images attached to this report
Comments related to this report
Made some adjustments to the CRS_TransferFunction code which generates the SensInv filter.
- Changed zero Q 50-->30
- Fixed an issue where we weren't normalizing the CRS TF data to the CPS TF data.
- Removed a factor of 12.5 orignally used for calibration rather than normaizing to CPS
- Paramter changes: delta= 1.04e-5m-->1.05528e-05m, w0= 0.0222Hz-->0.0222222Hz, wR/(2pi) = 0.0253Hz--> 0.0254Hz, wg=0.0764Hz-->0.0.0771
- Put new filter in the 2nd spot in the bank, called SensInv_Meas
Filter is saved in : /ligo/svncommon/SeiSVN/seismic/HAM-ISI/H1/HAM3/CRS/Filters/ CRS_SensInv_Filter.mat