Ryan S, Camilla, Sheila
Measurements from yesterday and today show that we have improved the SQZ to OMC mode matching, after a long effort by many people.
- We see a larger part of the available psams range where we have mode matching better than 2%.
- The astigmatism may be slightly improved because of the change in the beam position on ZM2 (91259 and 91197), and we no longer see that our best mode matching is at worse astigmatism points.
- Similarly, our best mode matching psams values are now near the lower M2 values, still 1.2, rather than the worst M2 as it was in O4.
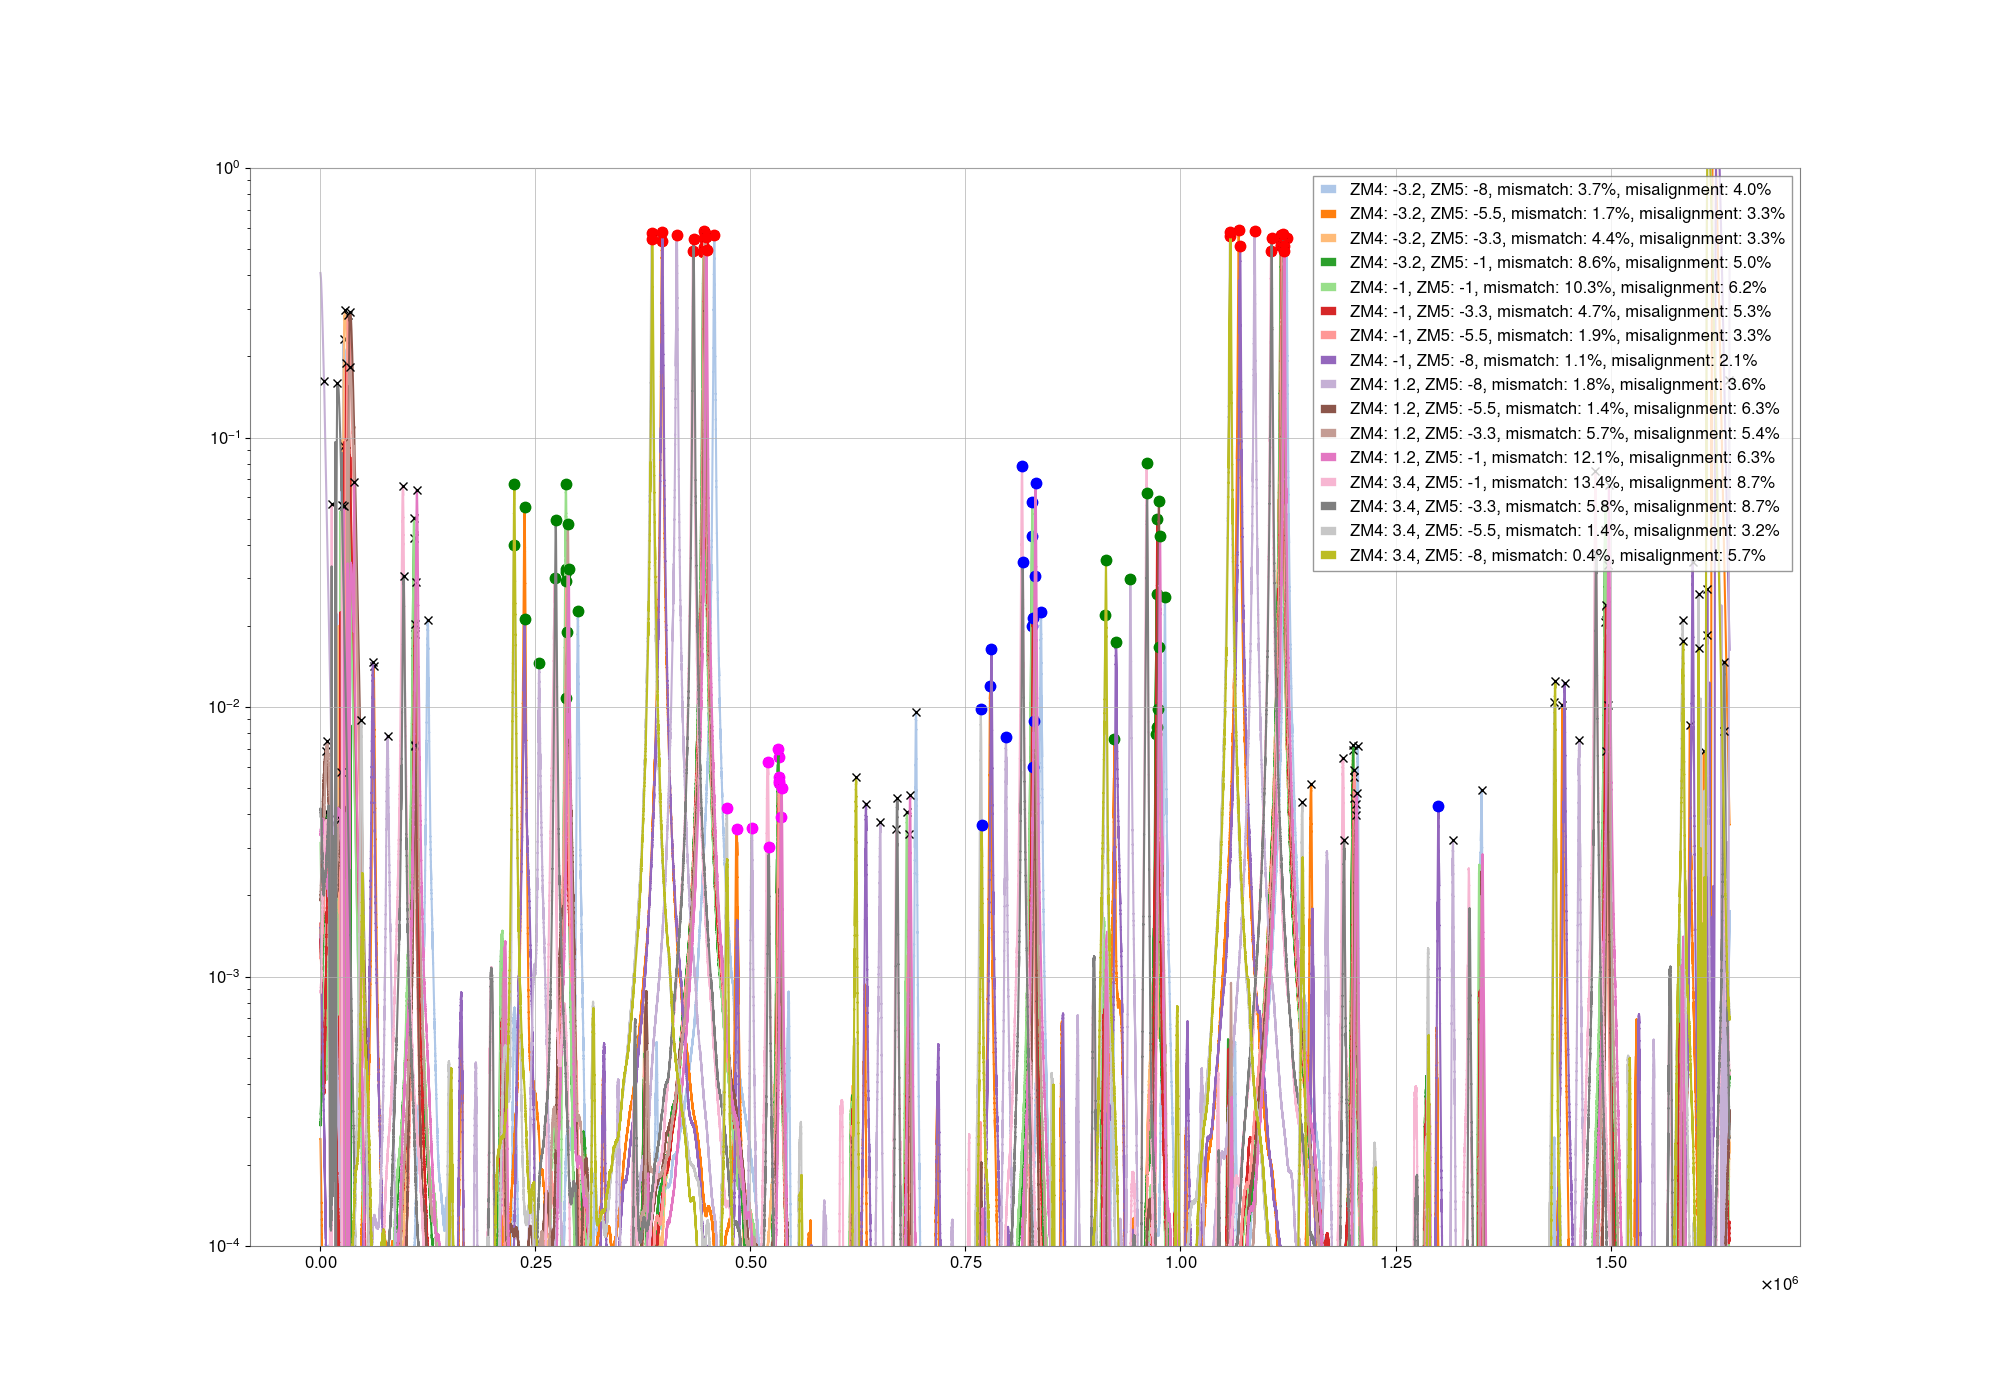
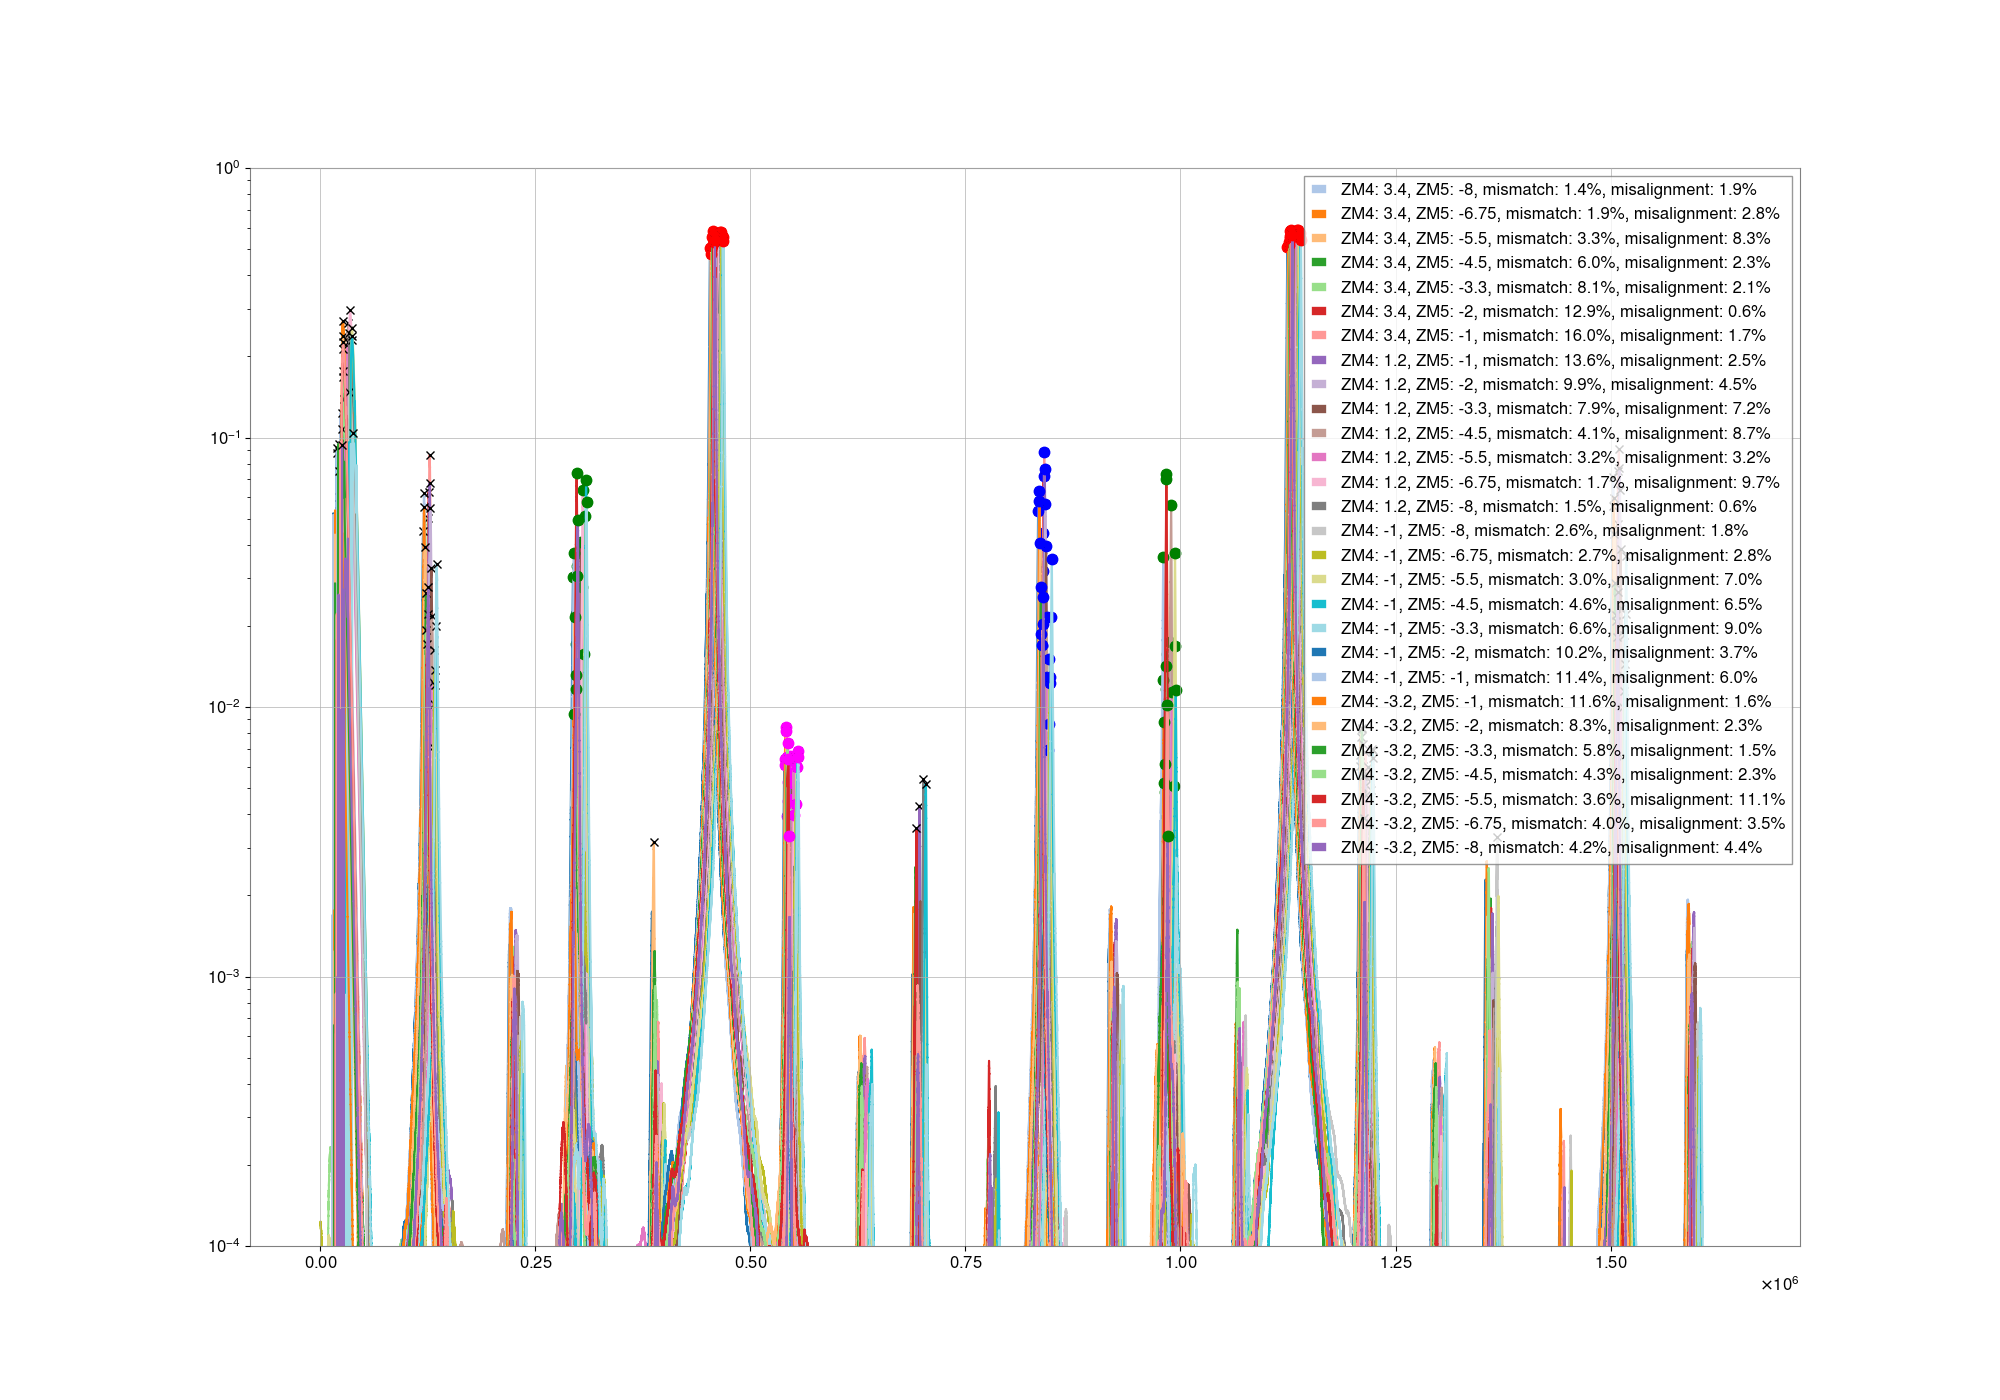
The first two plots here show the results of sqz two OMC scans, the first is with the grid described in 91371, the second is a second scan that Camilla did this morning with the same grid as the M^2 measurements in that alog. GPS times for these scans, and the mode matching and misalignments estimated from them, can be found in files in the sqzutils git repo here.
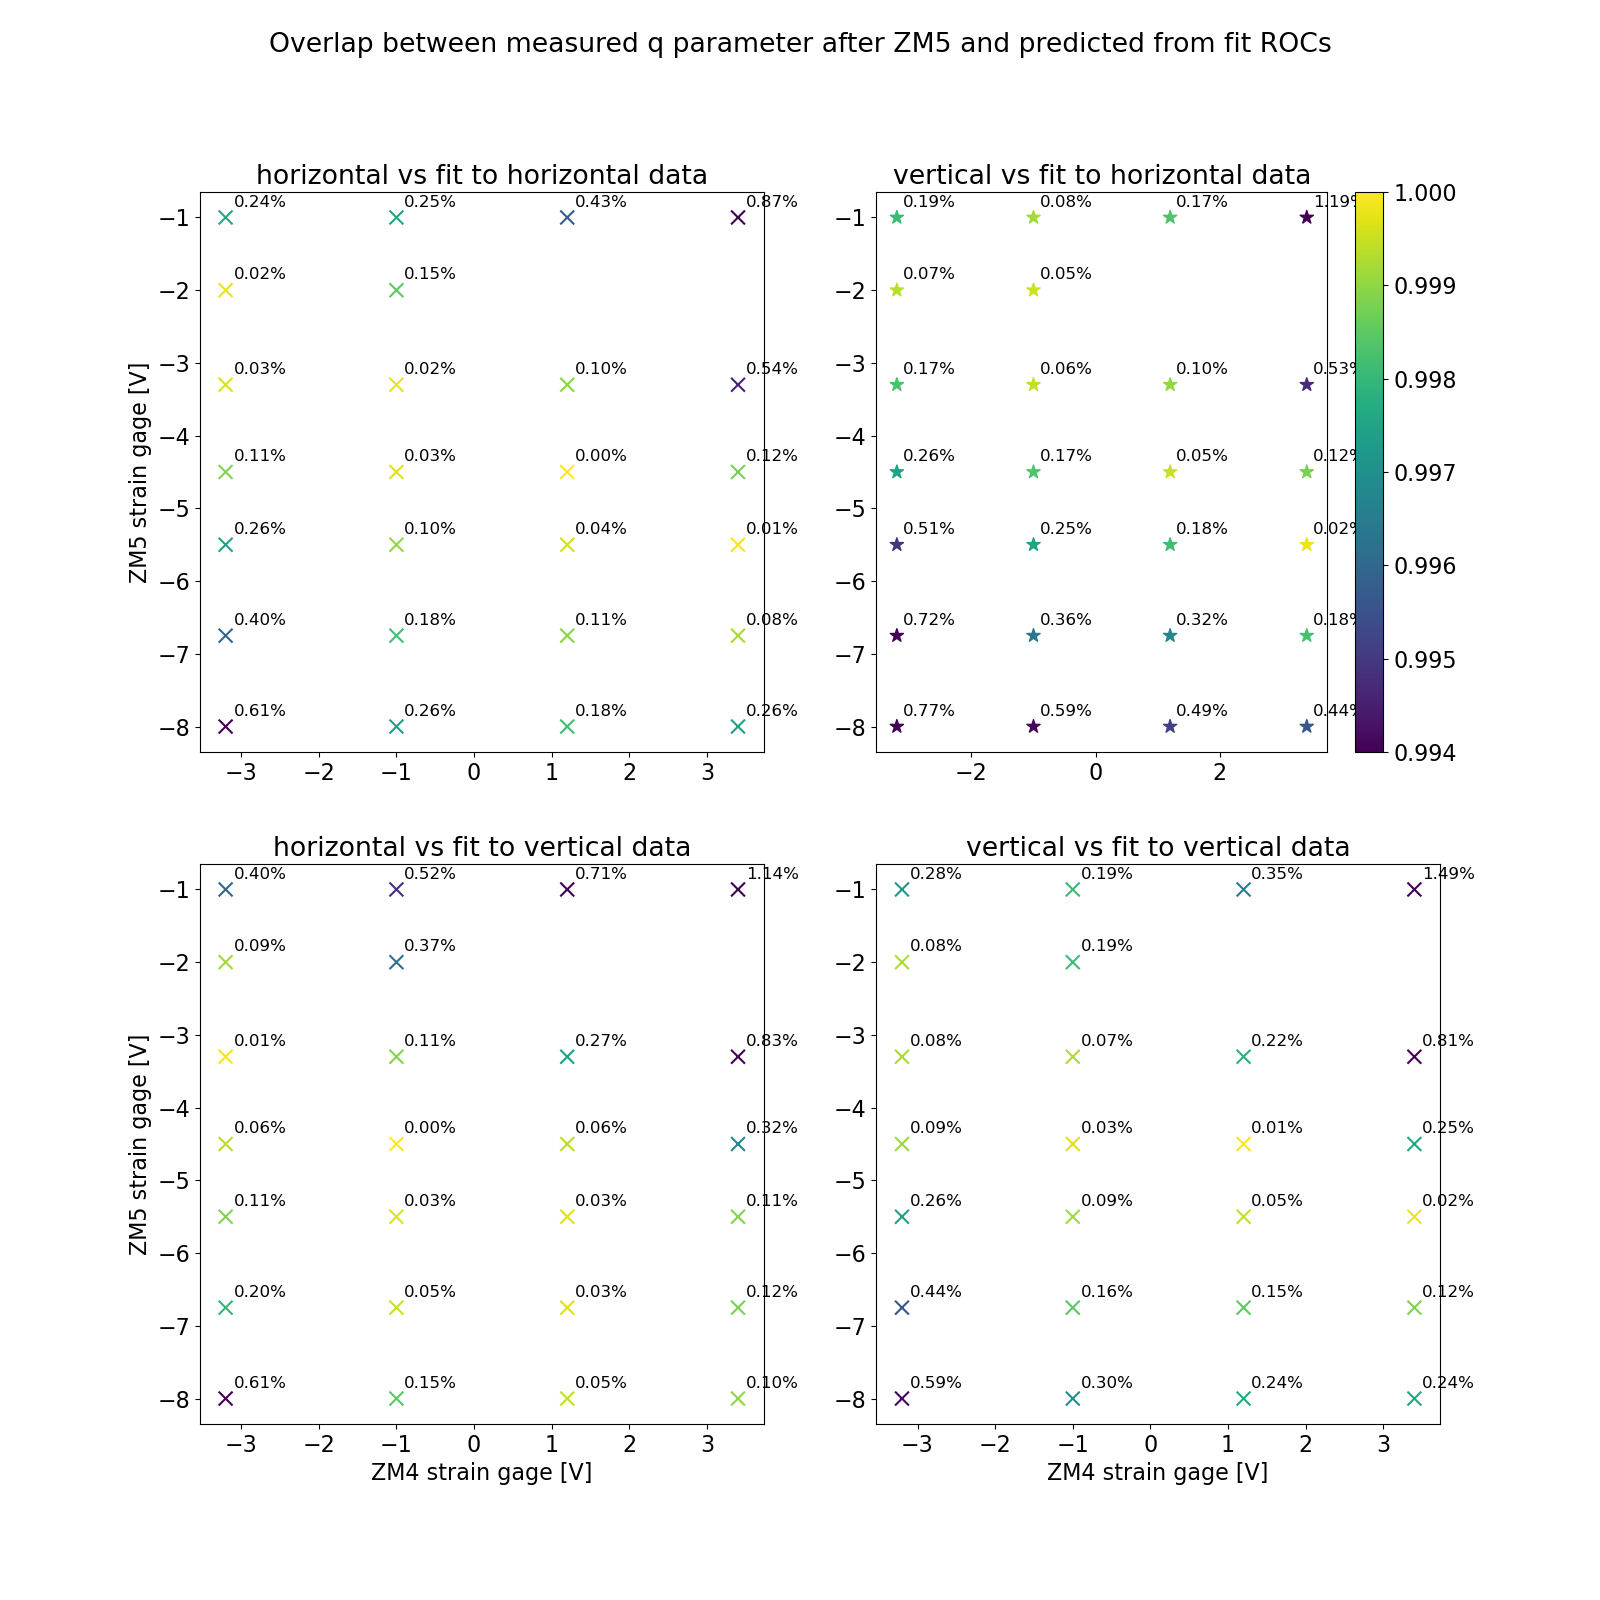
The M2 profiler data that Ryan Short and Camilla took yesterday is attached in the zip file here. A set of scatter plots summarizing all this data is here, which can be compared to attachments to 90902 showing the same measurements taken before the pre-loading changes (and psams repairs). The strain guage ranges are now different, but in both alogs the plots show close to the full range of the psams PZT. The range of M^2 values is similar to before (1.39-1.18) and still shows a dependence on ZM5 psam, which has the larger spot size. The overlaps between vertical and horizontal q parameters seem more uniform over the psams range now, with values of 0.5-0.6% for all the psams values where our mode matching is best.
In the lower right is the results from the OMC scans, since we took two scans with different grids there are some points that have two measurements, with the annotation showing the two different results. The misalignment mode height is shown in parenthesis for each of these, perhaps some of the variation in the results could come from the misalignment. We are hoping that with HAM7 under vacuum we will have an easier time setting the alignment of the sqz beam to the OMC, and it will fluctuate less, so that we can get better alignments and hopefully more consistent mode matching results.
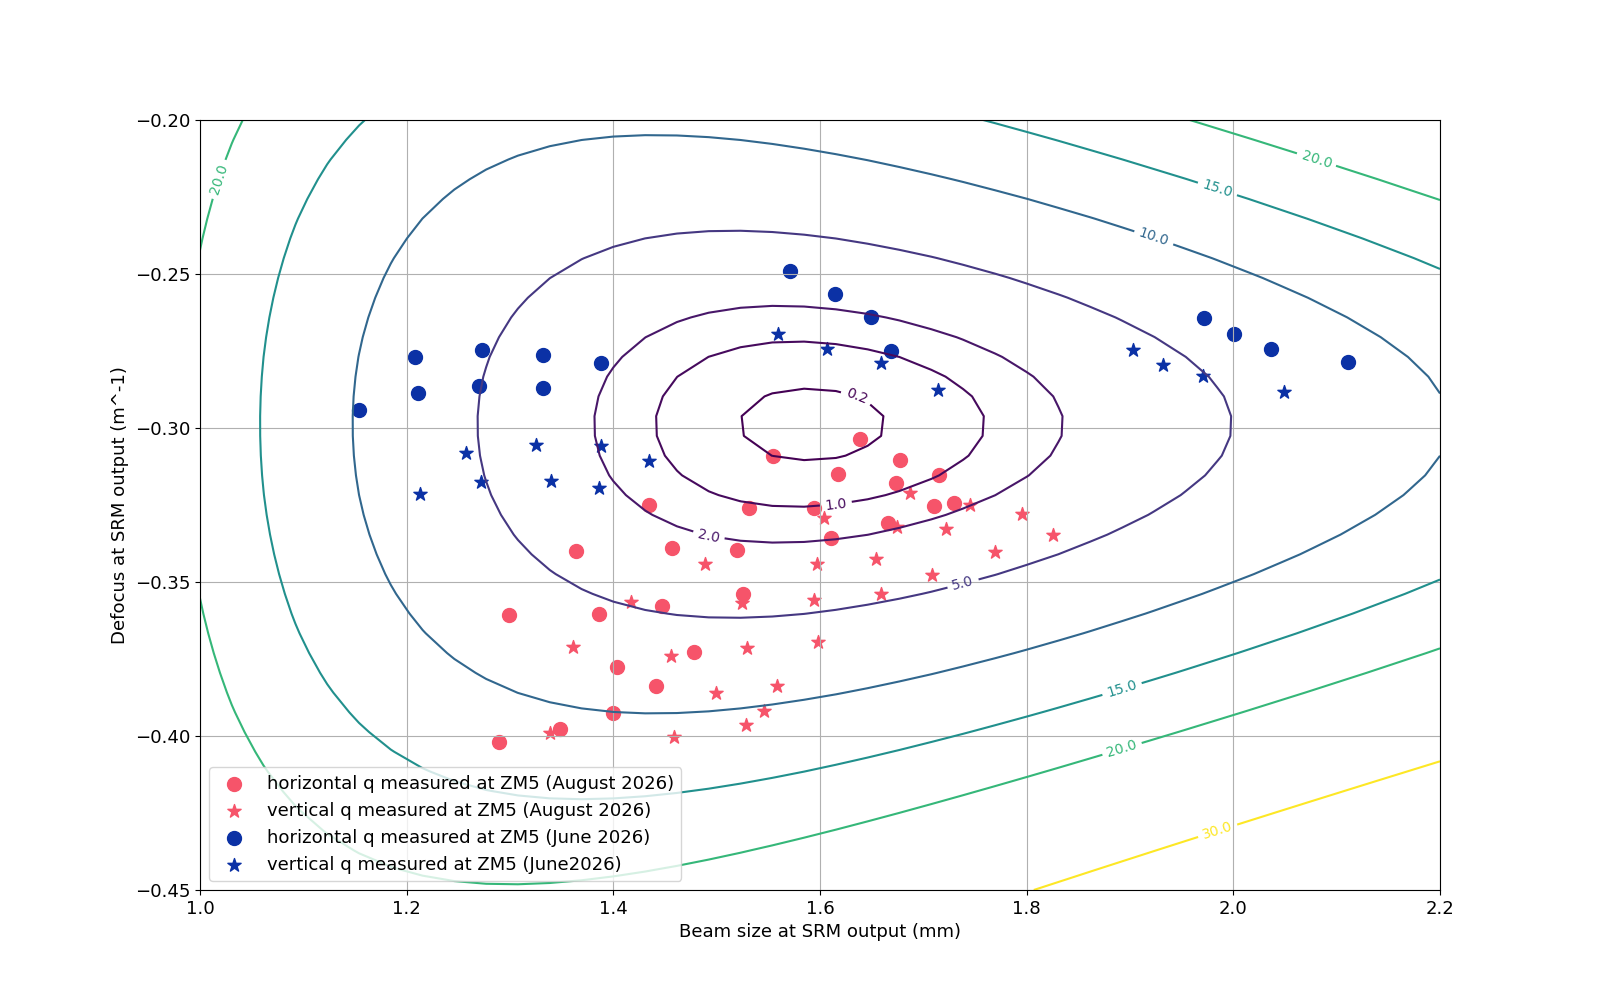
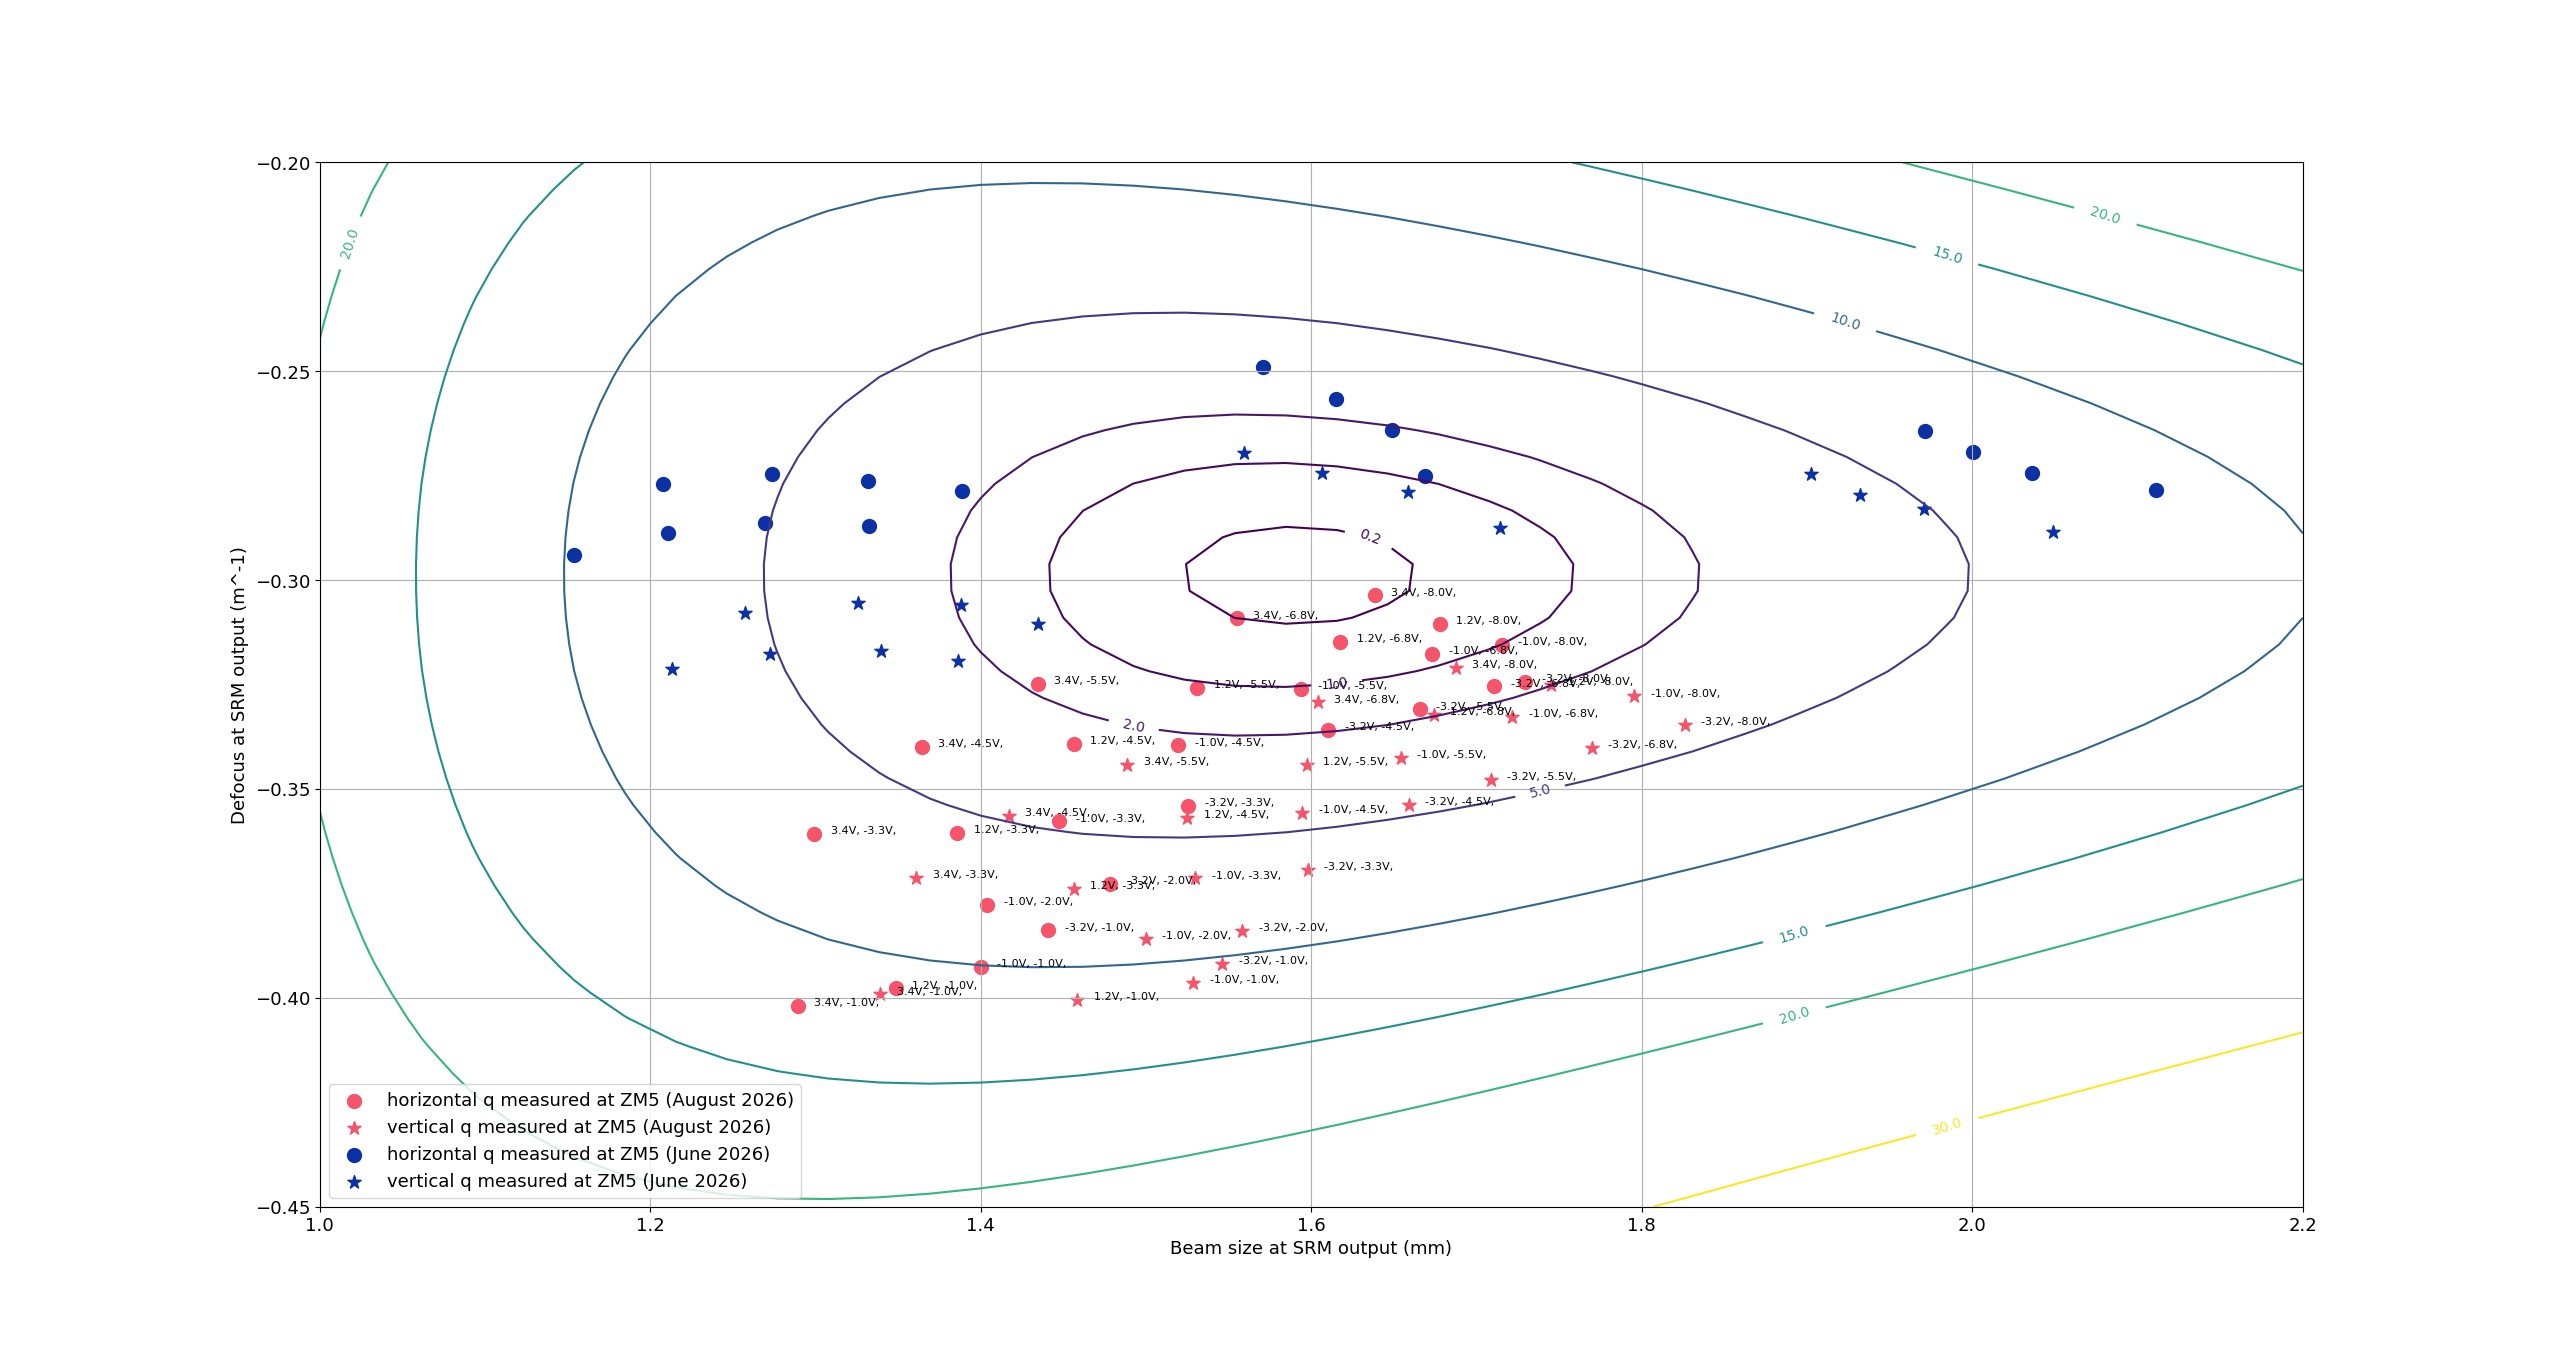
This plot shows the measured q parameters now on an Sw plot at SRM, compared to the measured q parameters before the pre-load change. The contours of OMC mismatch here are from the finesse model, between the datasets taken before and after the pre-loading we now have a lot of measured q parameters and measured mode mismatches that we can use to verify or adjust this part of the finesse model. Our intention with the pre-load change was not to completly move our mode matching area, but to still be able to access the ROCs that we used in O4 (90919). It does look like we missed this, and have overshot compared to what we intended to do.
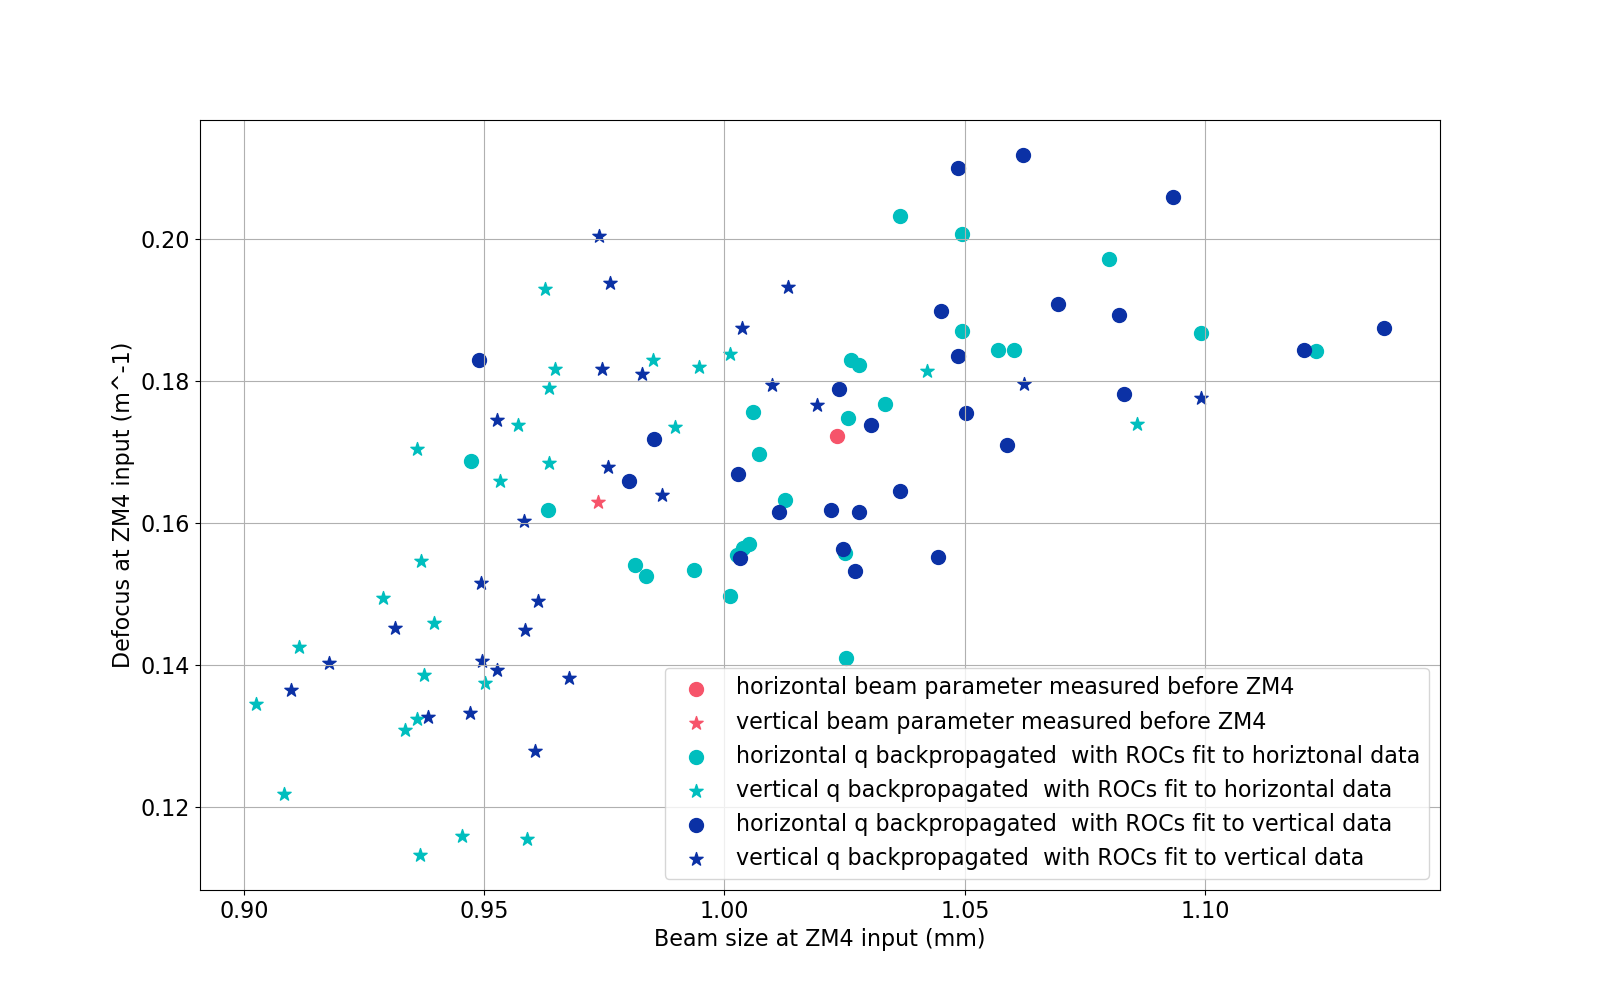
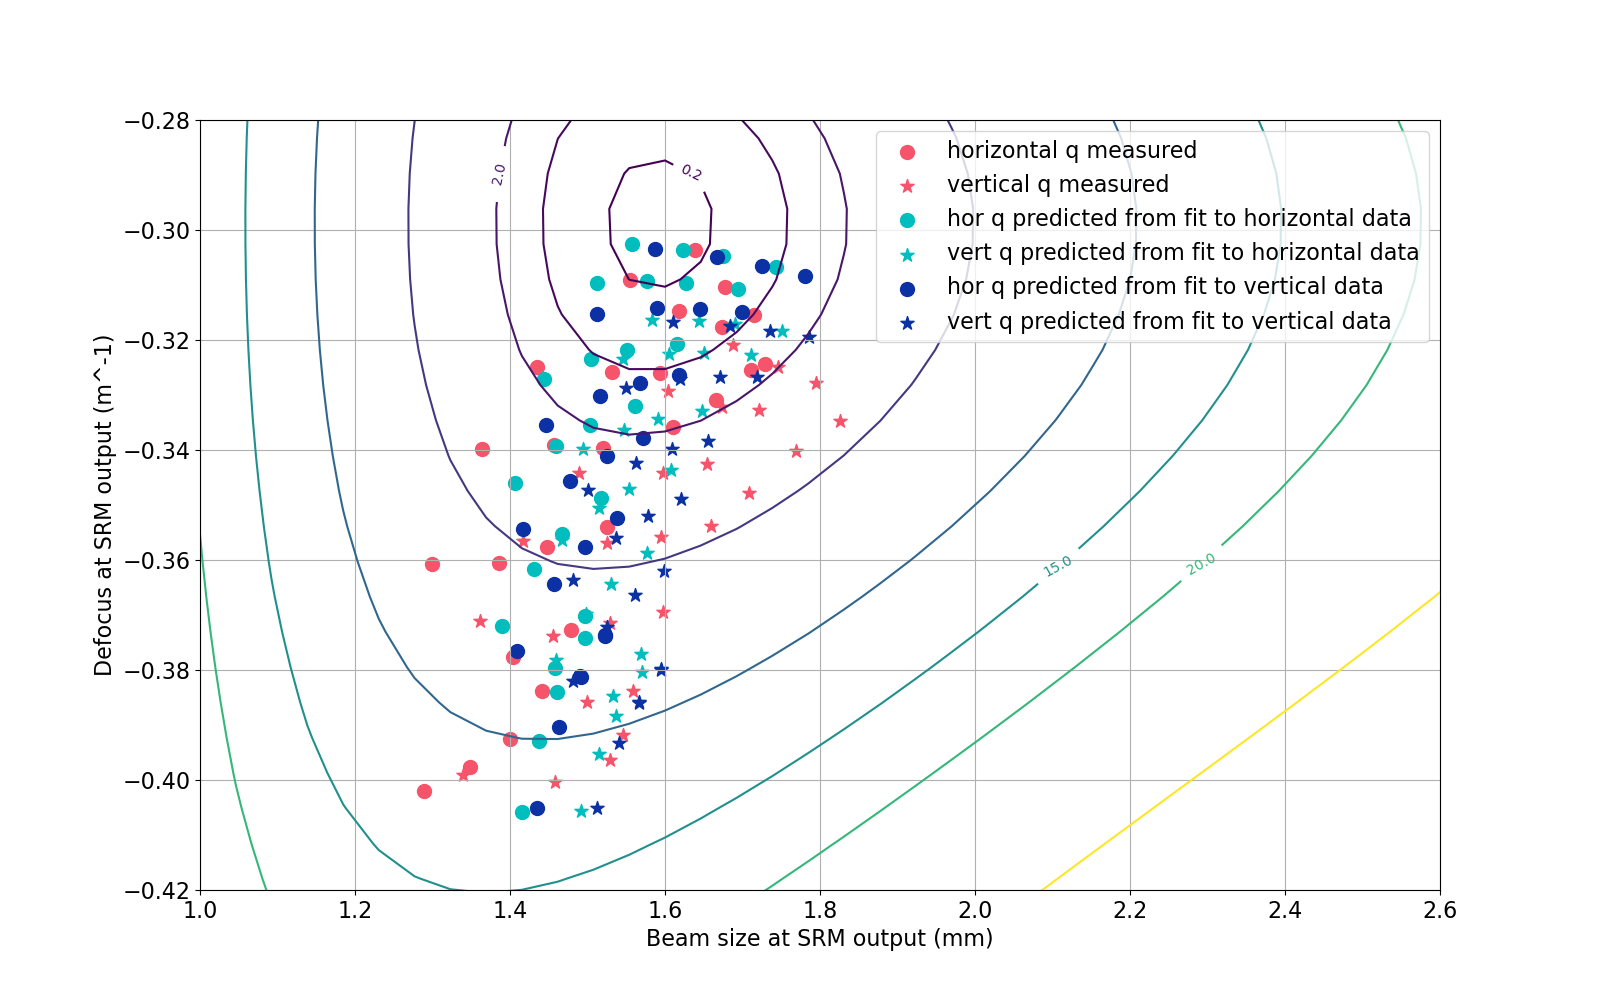
I reproduced the fitting of ROCs as described in 91013. This plot shows the measured qs propagated back to before ZM4, where all the horizontal and all the vertical values would ideally be the same. This plot shows the measured qs propagated to SRM, along with the qs measured before ZM4 propagated to SRM with the fits to ZM4 and ZM5 ROC. This scatter plot shows the overlap between the measured qs after ZM5 and the measurement from before ZM4 propagated forward with the fit ROCs. Similar to last time I did this fitting, the fitting is limited by something that is not astigmatism, and the fit to horizontal data can do about as good of a job explaining the vertical data as horizontal data, and vice versa. We need to double check if these fits are compatible with expectations based on the applied torques, and I would like to make one fit for horiztonal and vertical data.
| ZM4 strain guage [V] | -3.2 | -1 | 1.2 | 3.4 |
| ROC fit to horizontal data [m] | -31.3 | -22.3 | -18.2 | -14.6 |
| ROC fit to vertical data [m] | -41.5 | -29 | -21.9 | -16.2 |
| physical astigmatism (Dh-Dv) [mD] | -15 | -21 | -19 | -14 |
| total astigmatism Dh/cos(AOI) - Dv*cos(AOI) | -17 | -22 | -20 | -16 |
| ZM5 strain guage | -8 | -6.75 | -5.5 | -4.5 | -3.3 | -2 | -1 |
| ROC fit to horizontal data [m] | 4.40 | 4.50 | 4.68 | 4.86 | 5.09 | 5.38 | 5.44 |
| ROC fit to vertical data [m] | 4.41 | 4.57 | 4.79 | 4.98 | 5.19 | 5.51 | 5.51 |
| physical astigmatism (Dh-Dv) [mD] | 1 | 7 | 10 | 10 | 7 | 8 | 5 |
| total astigmatism Dh/cos(AOI) - Dv*cos(AOI) | 2 | 8 | 10 | 10 | 8 | 9 | 5 |
The script used to make these fits is available here and the first several plots in this alog were made using this script: here
Editing to add a busy version of the Sw plot with the strain guage readings annotated, ZM4 is listed first, then ZM5.


Following on from 90859.
- We have ZM4 SN1 installed now.
- Original data before we changed the preloading (E2100289) had the ROC range -19.3m to -9.0m. With at 0V applied -104mD optical power, with 200V applied -221mD.
- In alog 75677 we increased the preload from 46 in lb to 75 in lb. This is an estimated ROC range of -11.5 to -6.9 meters for strain gauge 1.0 to 8.3V.
-
In this vent we reduced the preload from 75 in-lbs to 65in-lbs in 90951. This should be decreased to -174mD + 2.4mD/in lb * 10 in lbs = -150mD mD with 0 V on the PZT, -267mD with 200V on the PZT. This is an estimated ROC range of -13.3m to -7.5m with 0V and 200V on the PZT.
-
This disagrees with Sheila's fitted numbers above, her numbers suggest our pre-loading is now at around -30 in-lbs. (-31m ROC = -65mD. -174mD -65mD = 109mD change / 2.4mD/in lb = 45in lb change. 75in lbs - 45 in lbs = 30 in-lbs).
-
In 91416 we checked on this pre-loading and it was somewhere between 40 and 50 in lbs.
-
We have ZM5 SN4 installed now.
- Original data before we changed the preloading (E2100297) had the ROC range 3.0m to 3.9m. With at 0V applied 667mD optical power, with 200V applied 508mD.
- In alog 75709 we increased the preload from 20 in lb to 47 in lbs. This is an estimated ROC range of 3.3 to 4.5 meters for strain gauge -5.0 to +2.6V (it's range with 0V and 200V applied).
- In this vent this PSAMs SG broke and after the fix, Camille at Caltech adjusted the preload from 47in lbs to 60in lbs and remeasrured in LIGO-E2100297. This is a measured ROC range of 3.6m to 5m meters with 0V and 200V on the PZT.
- Mostly agrees with Sheila's fitted numbers above.