
Sheila, Ryan S, Camilla
We spent the morning repeating 90783, now that ZM4 preloading has been adjusted (90951) and ZM5 has been swapped and now has a different preloading than our O4 ZM5 (91292):
- Using SQZ ASC with ZM4 and ZM5 to get ASC_A and ASC_B centered, we needed to move SRM to stop saturating ZM4/5,
- then locking OMC on 00 touching up OMC and OM3 alignment to maximize 00 peak,
- then putting these ASC-OMC offsets into H1:OMC-ASC_QPD_A/B_PIT/YAW_OFFSET so that the OMC ASC will put us in this good location.
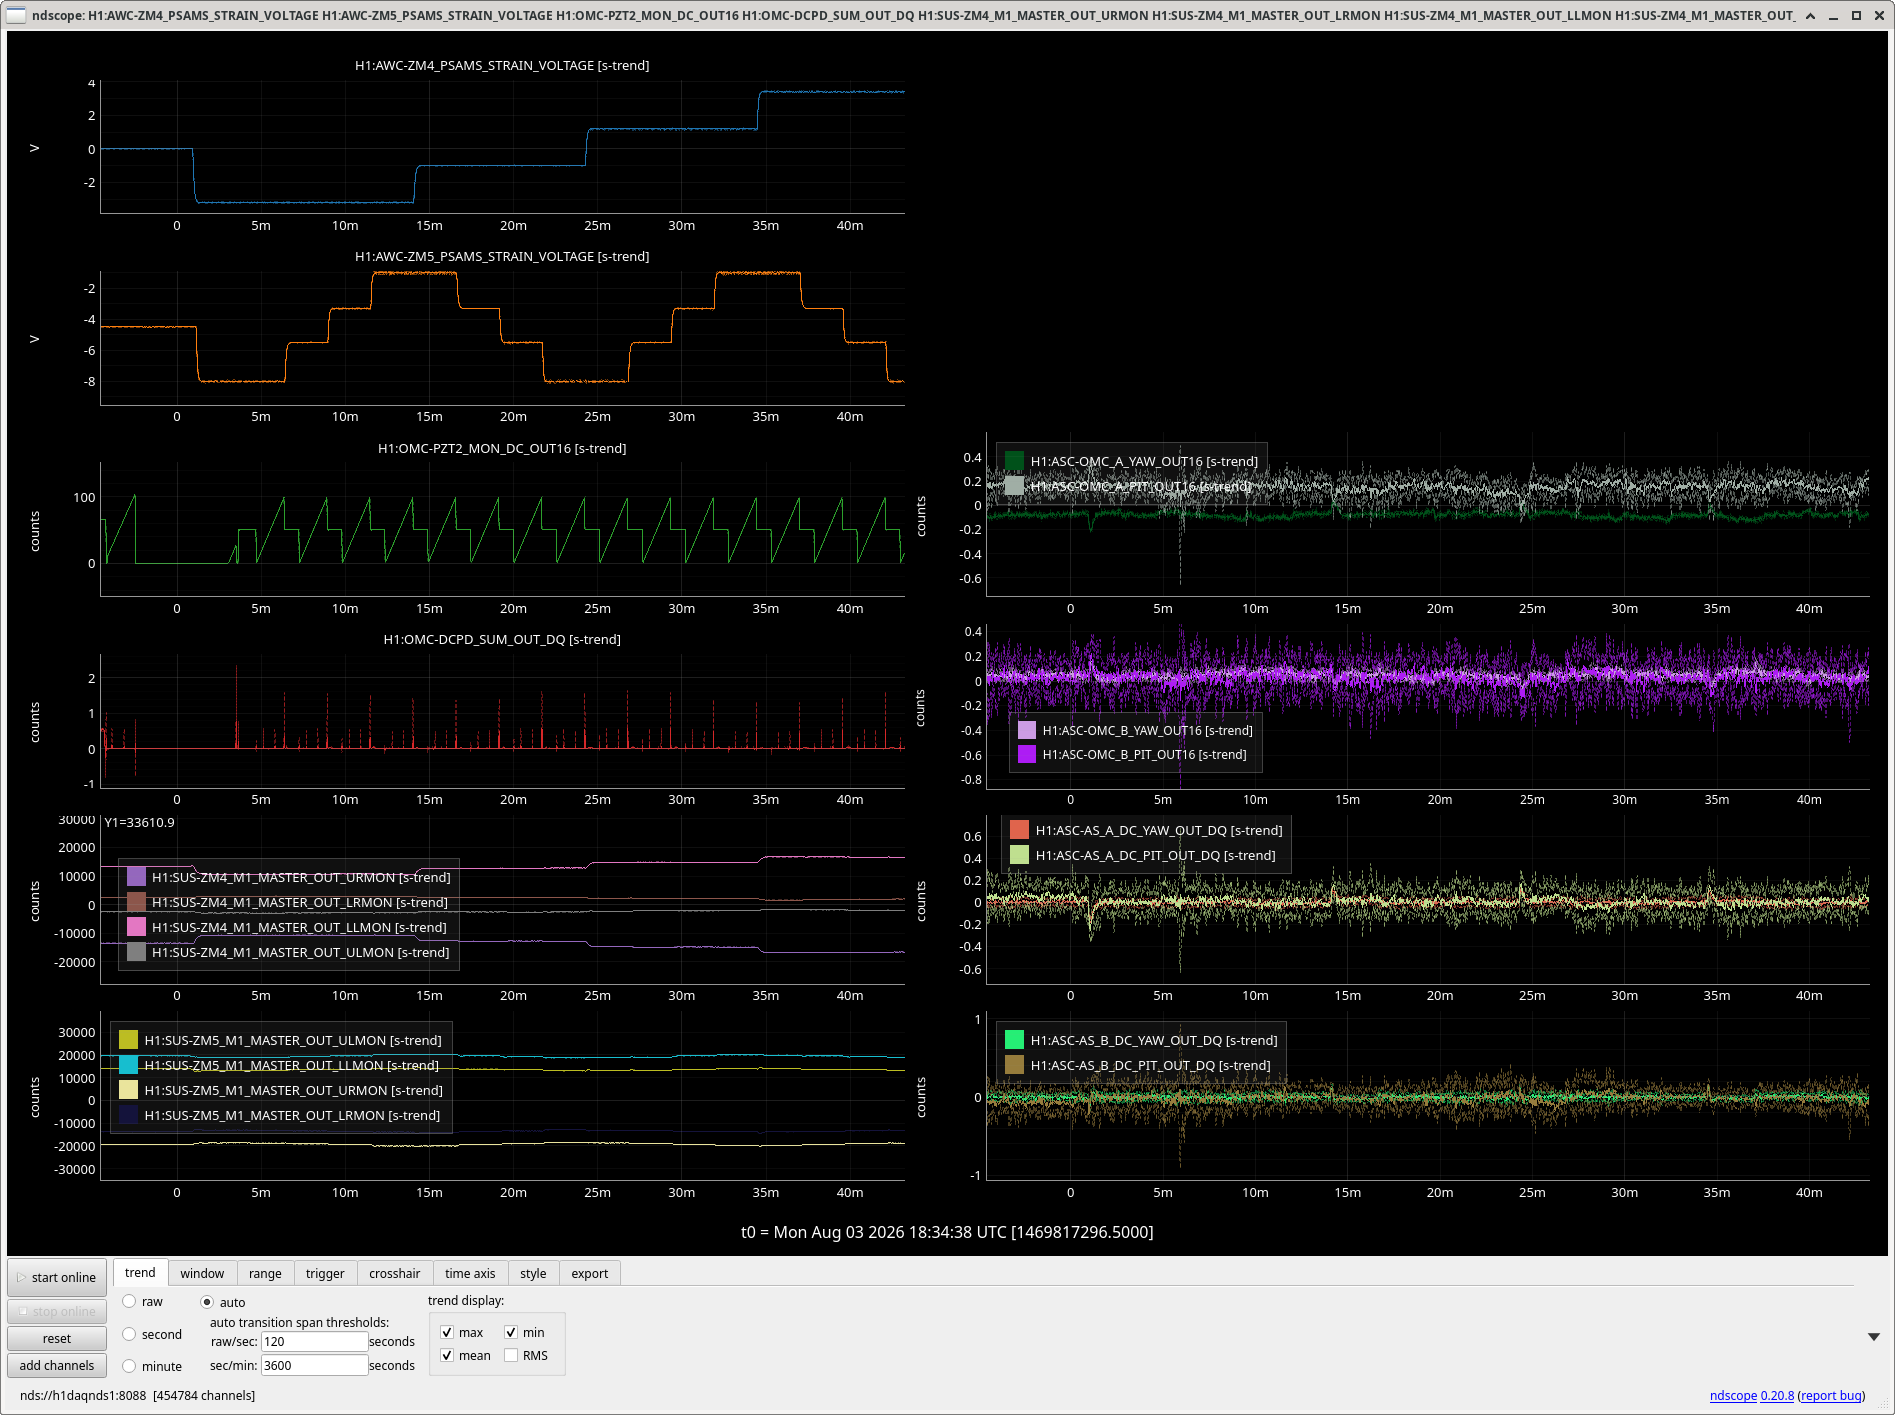
Sheila then used her script to run OMC scans at a grid (below) of PSAMS locations. These initially look great, showing sqz to omc mode mismatch is as good as 1%. with some alignment fluctuations. Ndscope of data taking attached.
Ryan then took M^2 measurements on SQZT7 of a slightly different grid:
Below I calculate the astigmatism based Ryan's grid of M^2 measurements.
I compute the 1D overlap between the x and y directions using the q values from the M^2 measurements
eta_1D = 4*zRx*zRy / ( (z0x - z0y)^2 + (zRx + zRy)^2 ) where z0 is the waist position and zR is the rayliegh length = pi * w /(M^2*lambda)
The astigmatism, which i express as 1 - eta_1D is tabulated below in %
| ZM5 \ ZM4 | -3.2 | -1 | 1.2 | 3.4 |
|---|---|---|---|---|
| -8 | 0.52 | 0.52 | 0.55 | 0.59 |
| -6.75 | 0.51 | 0.48 | 0.60 | 0.64 |
| -5.5 | 0.56 | 0.55 | 0.62 | 0.50 |
| -4.5 | 0.57 | 0.56 | 0.55 | 0.36 |
| -3.3 | 0.52 | 0.50 | 0.40 | 0.29 |
| -2 | 0.42 | 0.50 | ||
| -1 | 0.56 | 0.78 | 0.62 | 0.15 |
The dependance is pretty weak over much of the grid, but things get a bit squirly in the lower right corner near the positive end of the range for both PSAMS. We're not as sensitive to the strain gauge setting as ZM2 (91185), but there's clearly a noticible dependence.
