david.barker@LIGO.ORG - posted 11:09, Friday 07 August 2026 (91445)
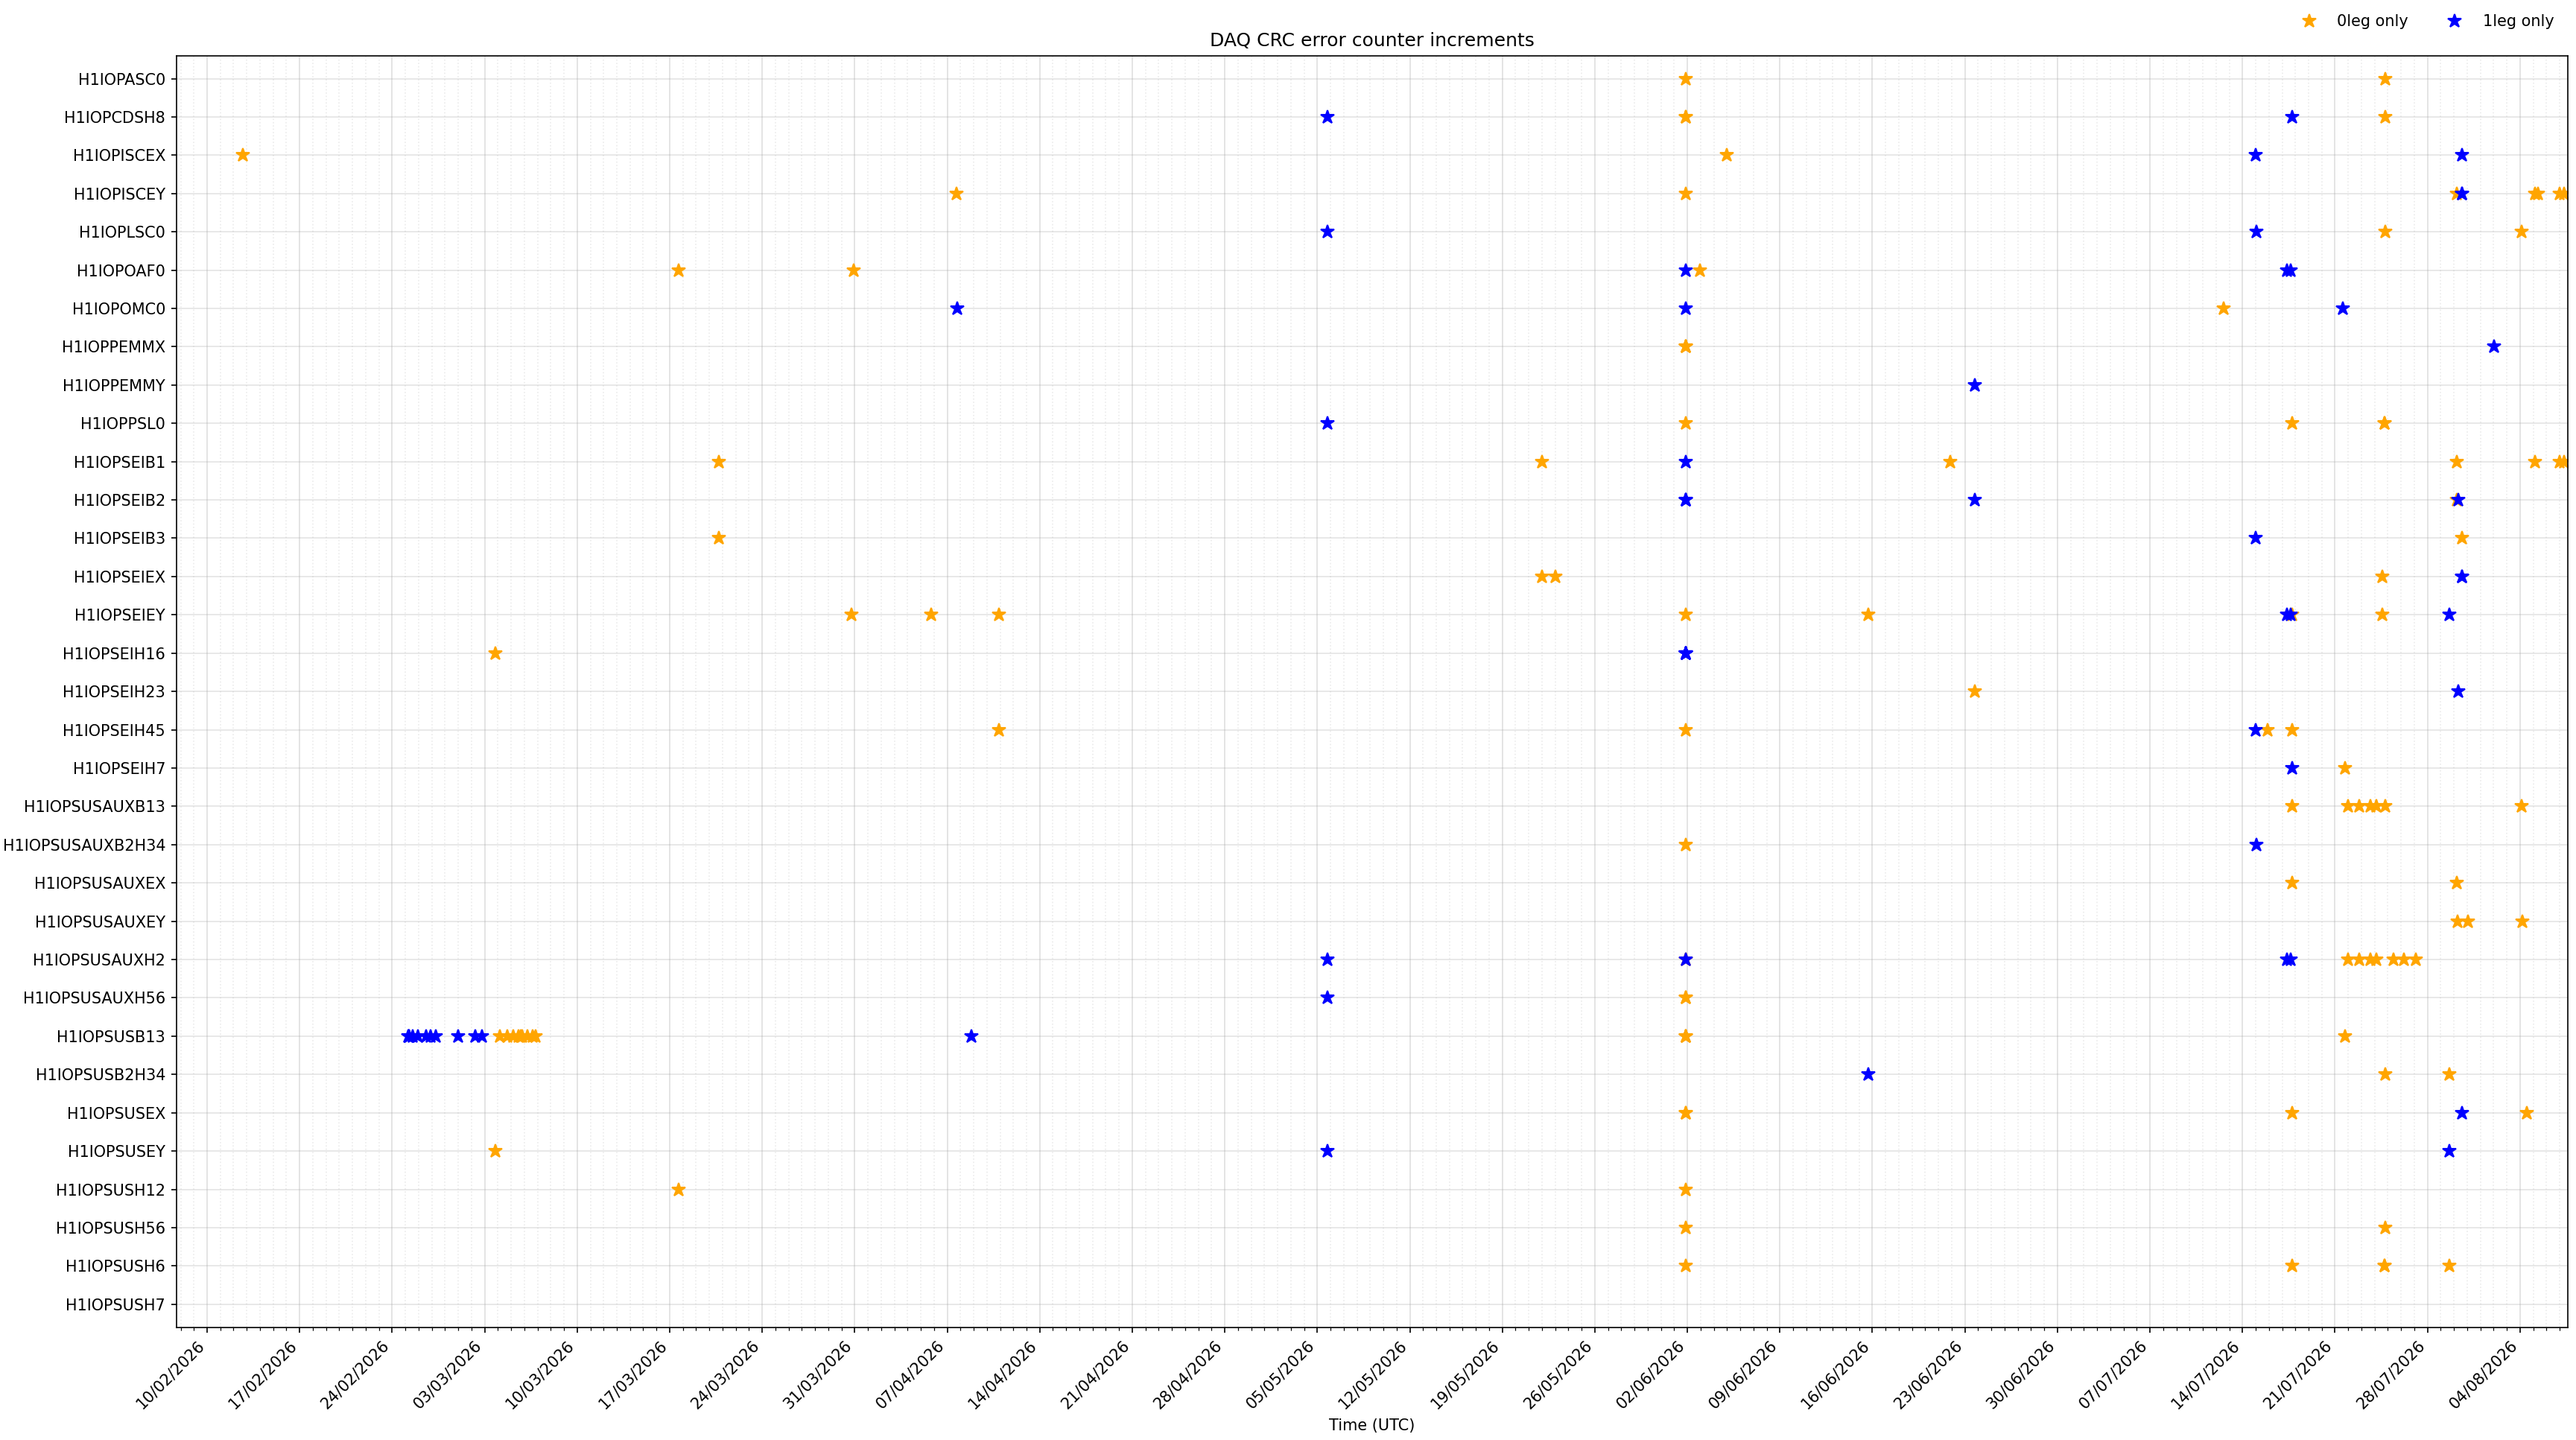
DAQ CRC error trend over past 6 months
Dave, Erik, Claude
Claude AI wrote a python script to plot the H1 DAQ CRC rates for the past 6 months for all frontend and both DAQ legs (see attached). This plot only shows when an individual DAQ leg recorded a CRC error from the front end. The times there were CRCs on both legs were usually due to model restarts and not spontaneous errors, so these have been removed from the plot.
The vertial lines align with Tuesdays and possible maintenance activities.
General first thoughts are: over the long term the CRCs are fairly randomly distributed over front ends and DAQ legs; in the past week they have been concentrated on the 0leg and the two frontends iscey, seib1.
Images attached to this report