Jennie Wright, Masayuki Nakano, Khanh Vu
Masayuki’s Math
We previously made an attempt to balance the JAC’s reflected beam on the WFS quadrants. However, Masayuki realized that this might not be a fair measurement because the voltage is defined as Voltage = Gain x Power, and the gain can be different for each segment.
To obtain a quantity that can be compared between segments, we instead excite the beam. For example, we can move the beam to the upper half of the WFS (Segments 1 and 2) so that no light lands on the lower half (Segments 3 and 4). If we then drive the beam in yaw with a sine wave, the total power on Segments 1 and 2 must be conserved. Therefore, any change in power on one segment results in a corresponding negative change on the other segment.
The powers on Segments 1 and 2 can then be written as:
P1 = P1_DC + ΔP sin(wt)
P2 = P2_DC - ΔP sin(wt)
Since Voltage = Gain x Power,
V1 = G1 x (P1_DC + ΔP sin(wt))
V2 = G2 x (P2_DC - ΔP sin(wt))
At the excitation frequency, the amplitudes of the power changes on the two segments are equal and opposite. Therefore, taking the ratio of the measured AC amplitudes gives the gain ratio G1/G2.
Applying the same procedure, we can measure G1/G2, G2/G3, G3/G4, and G1/G4. However, we can also infer G1/G4 from the first three ratios:
G1/G4 = (G1/G2) x (G2/G3) x (G3/G4)
Comparing this inferred value with the directly measured G1/G4 gives us a consistency check.
Measurement Procedure
We performed this measurement by injecting an excitation into the JM1 suspension system. Before doing so, we opened the ASC loops and paused the JAC Guardian. We used the picomotors to move the beam onto different halves of the wavefront sensors.
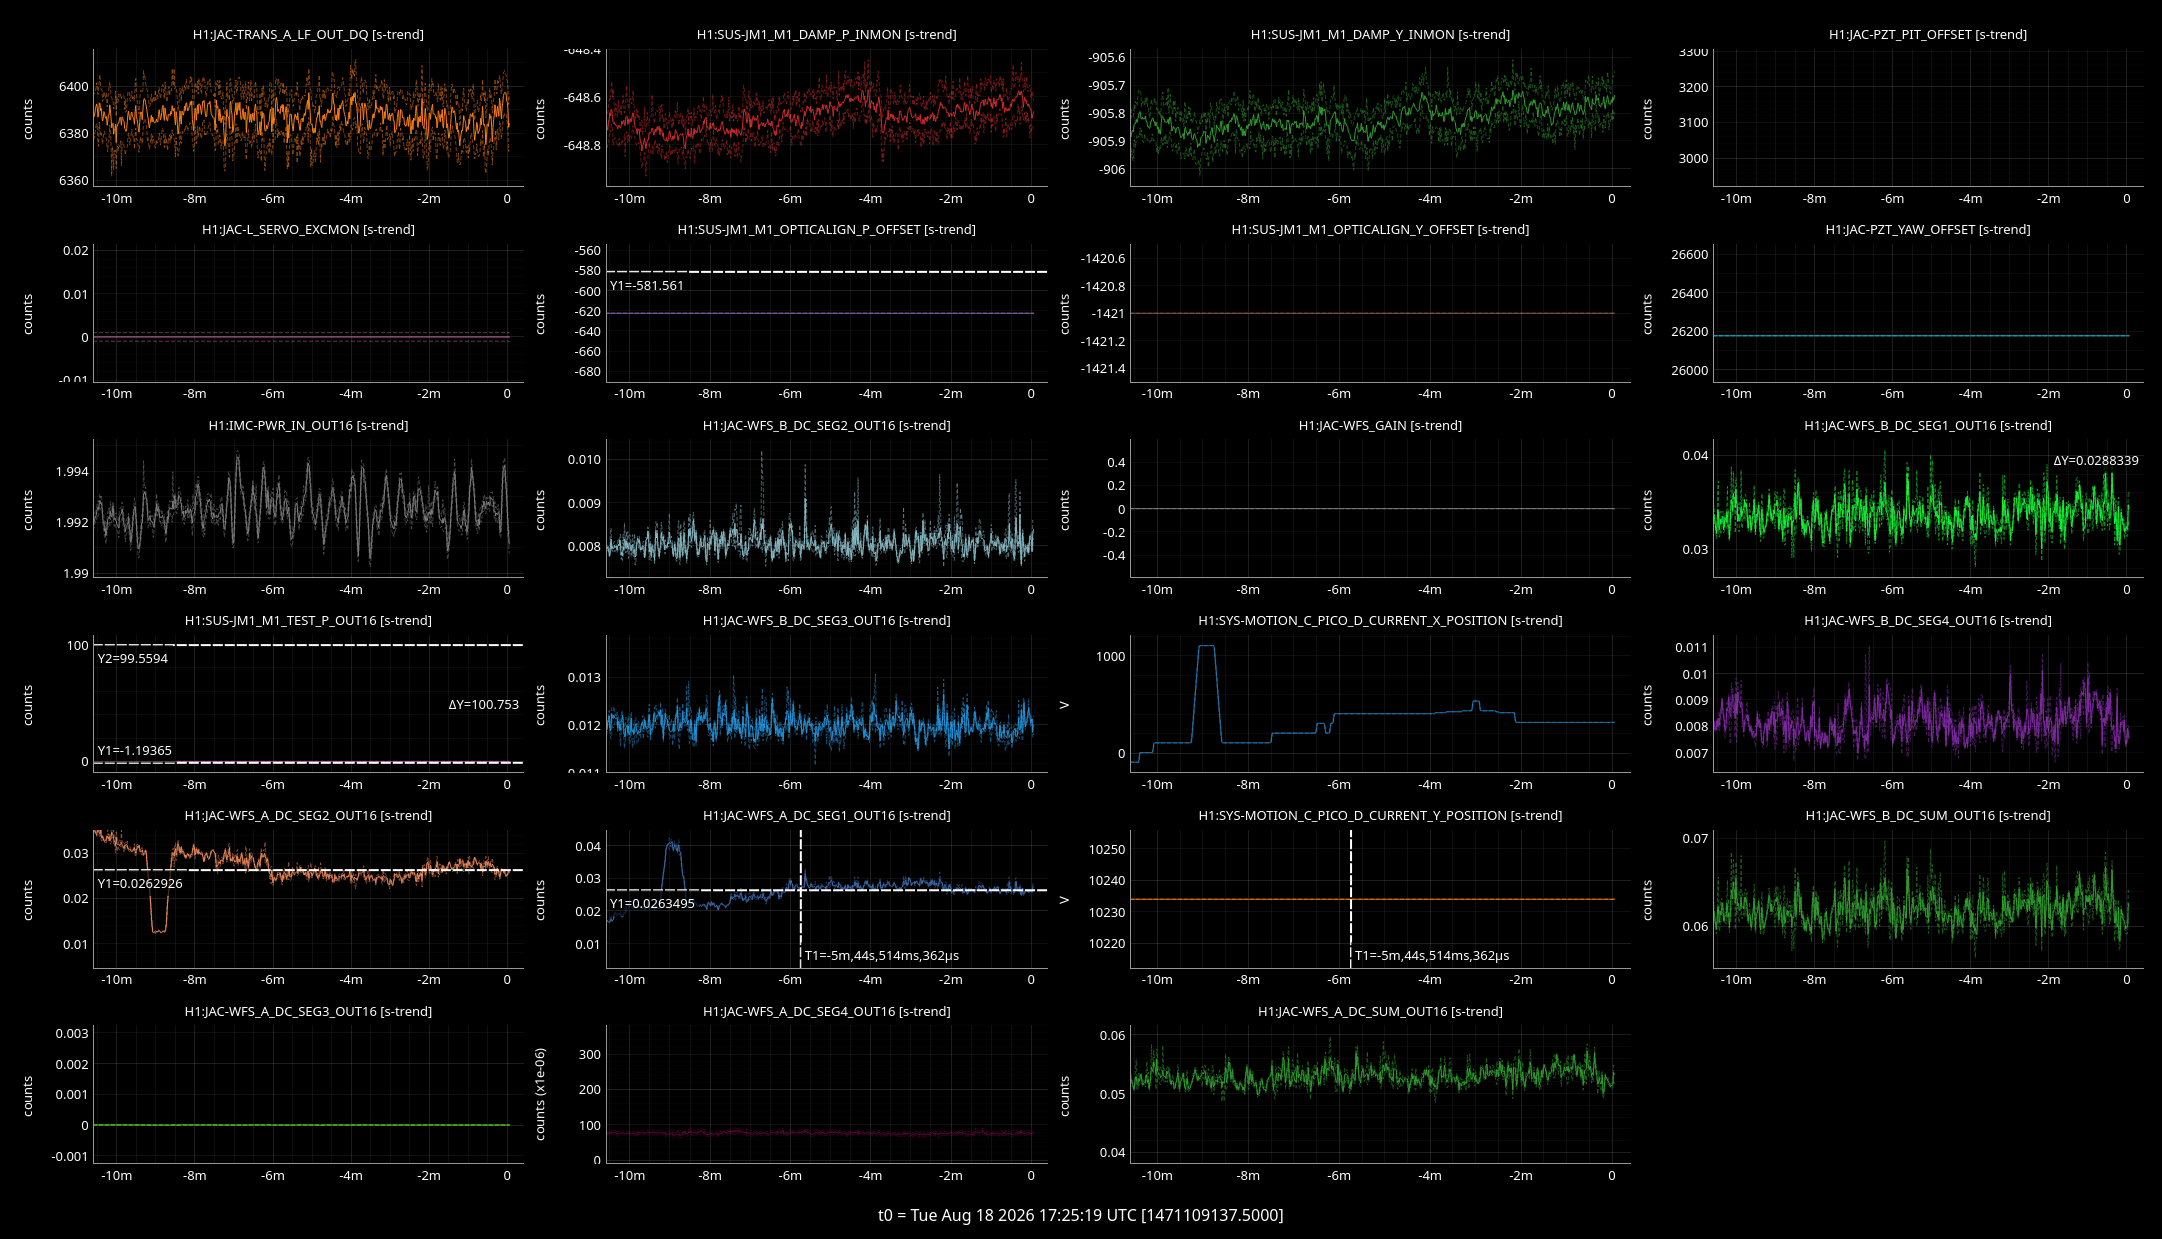
For precision, we monitored the DC signals from the individual segments. Using the same example, when positioning the beam on the upper half, we moved it until there was essentially no signal on Segments 3 and 4. We then balanced the beam in yaw so that the DC signals on Segments 1 and 2 were approximately equal. An example dtt for this step is attached below.
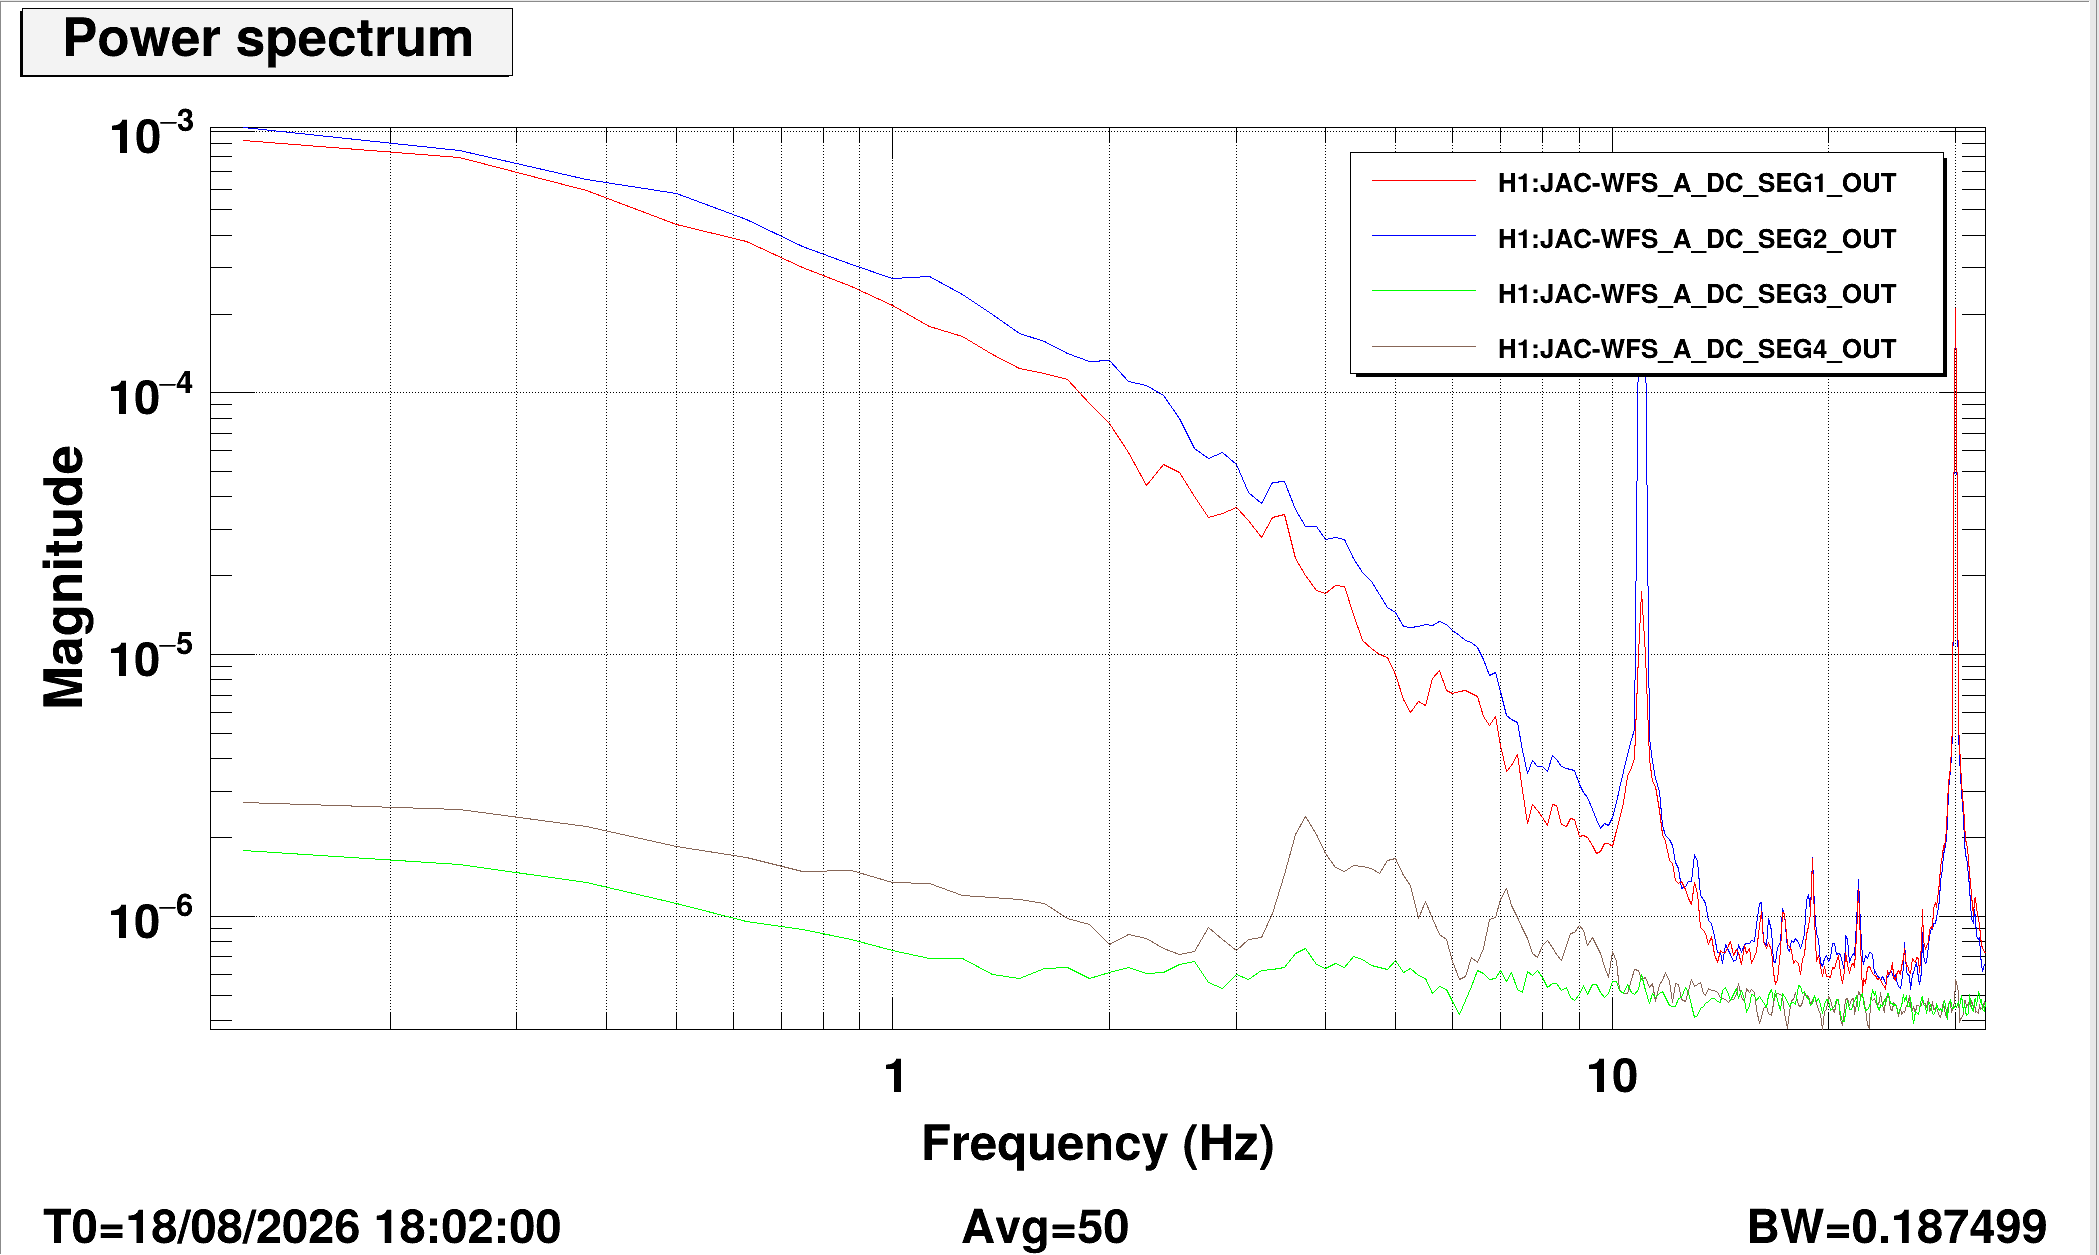
The excitation was a sine wave at 11 Hz with an amplitude of 12. For the upper and lower halves, we injected in yaw. For the left and right halves, we used pitch excitation. The power spectrum plot is also attached below.
Results
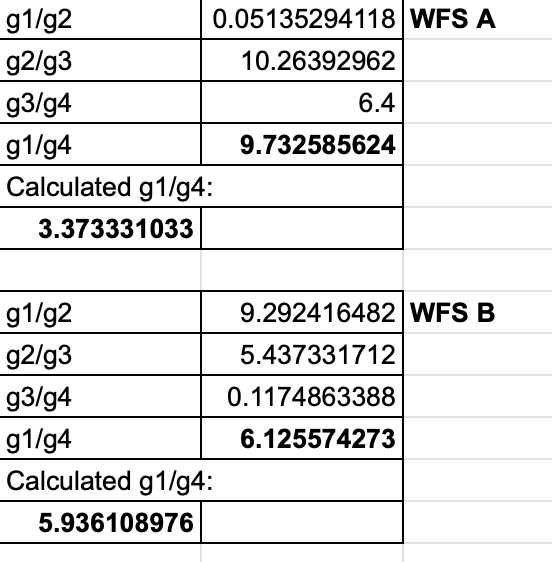
We measured the segment responses at 11 Hz and divided the corresponding amplitudes to obtain the gain ratios. The results are shown below.
For WFS A, the directly measured G1/G4 does not agree well with the value inferred from the other three ratios. For WFS B, the directly measured and inferred G1/G4 values agree considerably better.
However, the calculated results themselves do not seem physically reasonable, since they imply that the gains of different segments can differ by as much as a factor of 10.
Next Step
We suspect that this issue comes from performing the measurement while the JAC was locked. In this condition, the reflected beam contains significant higher-order-mode content, making it difficult to position and balance the beam cleanly on the WFS quadrants.
We will therefore repeat the measurement tomorrow with the JAC unlocked.