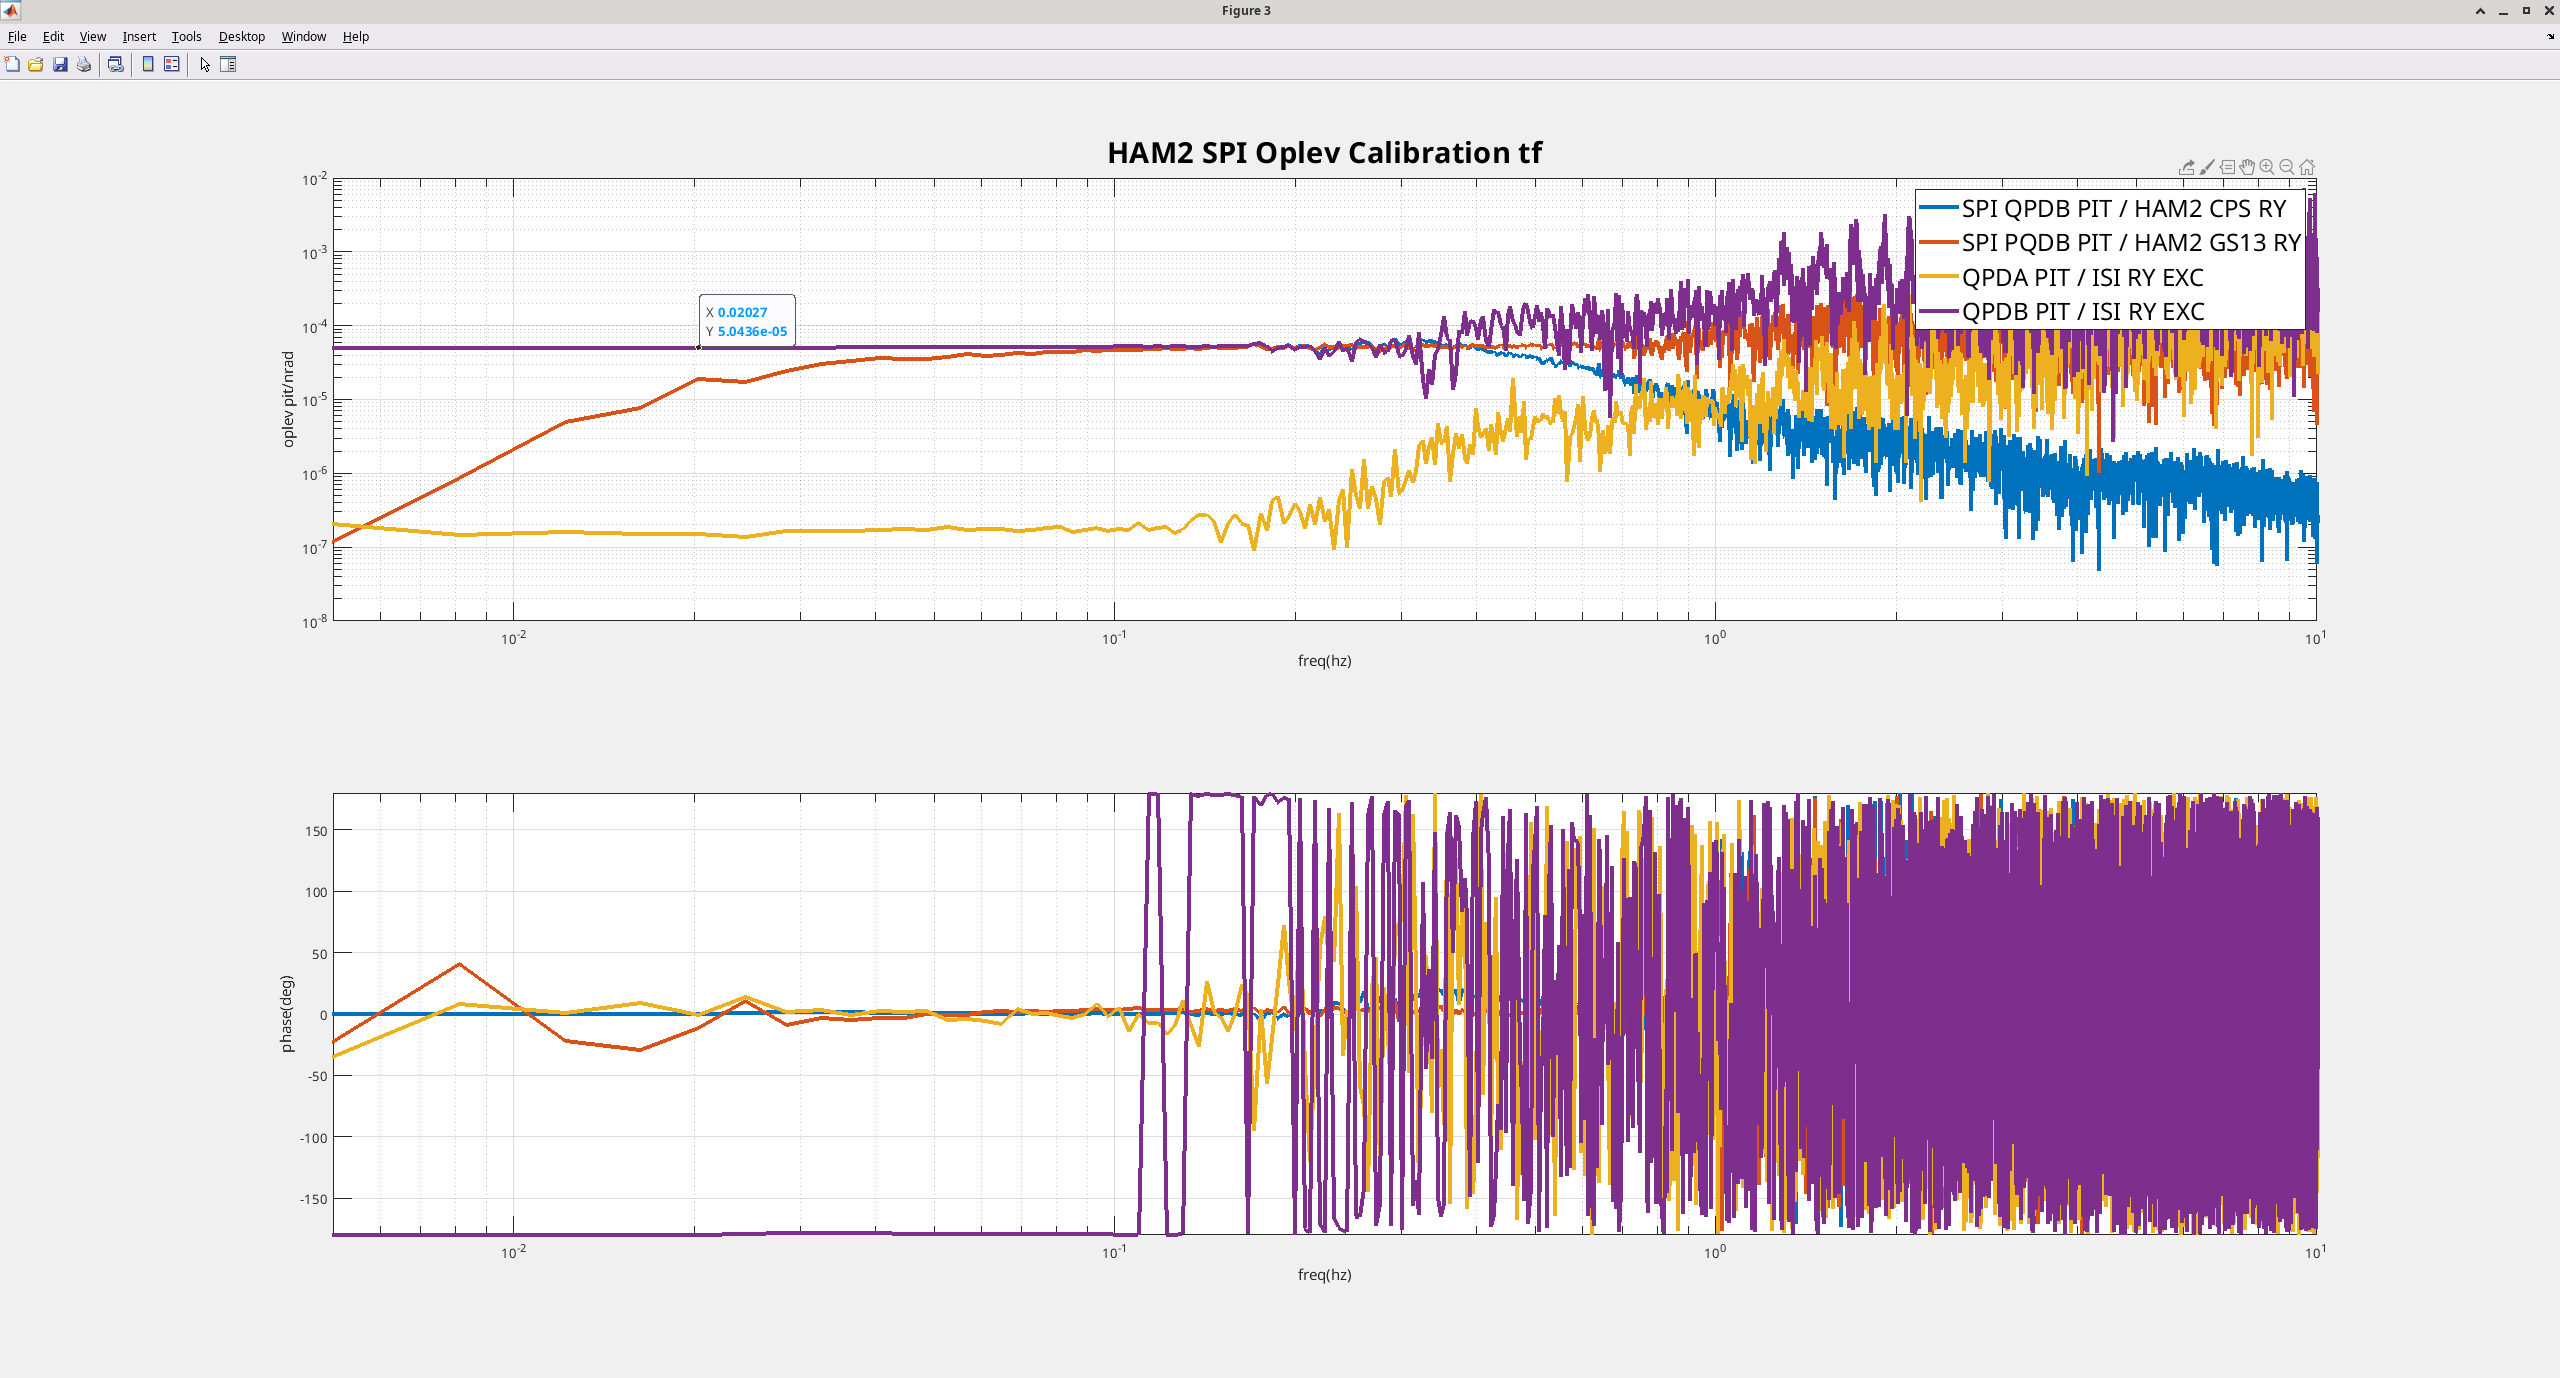
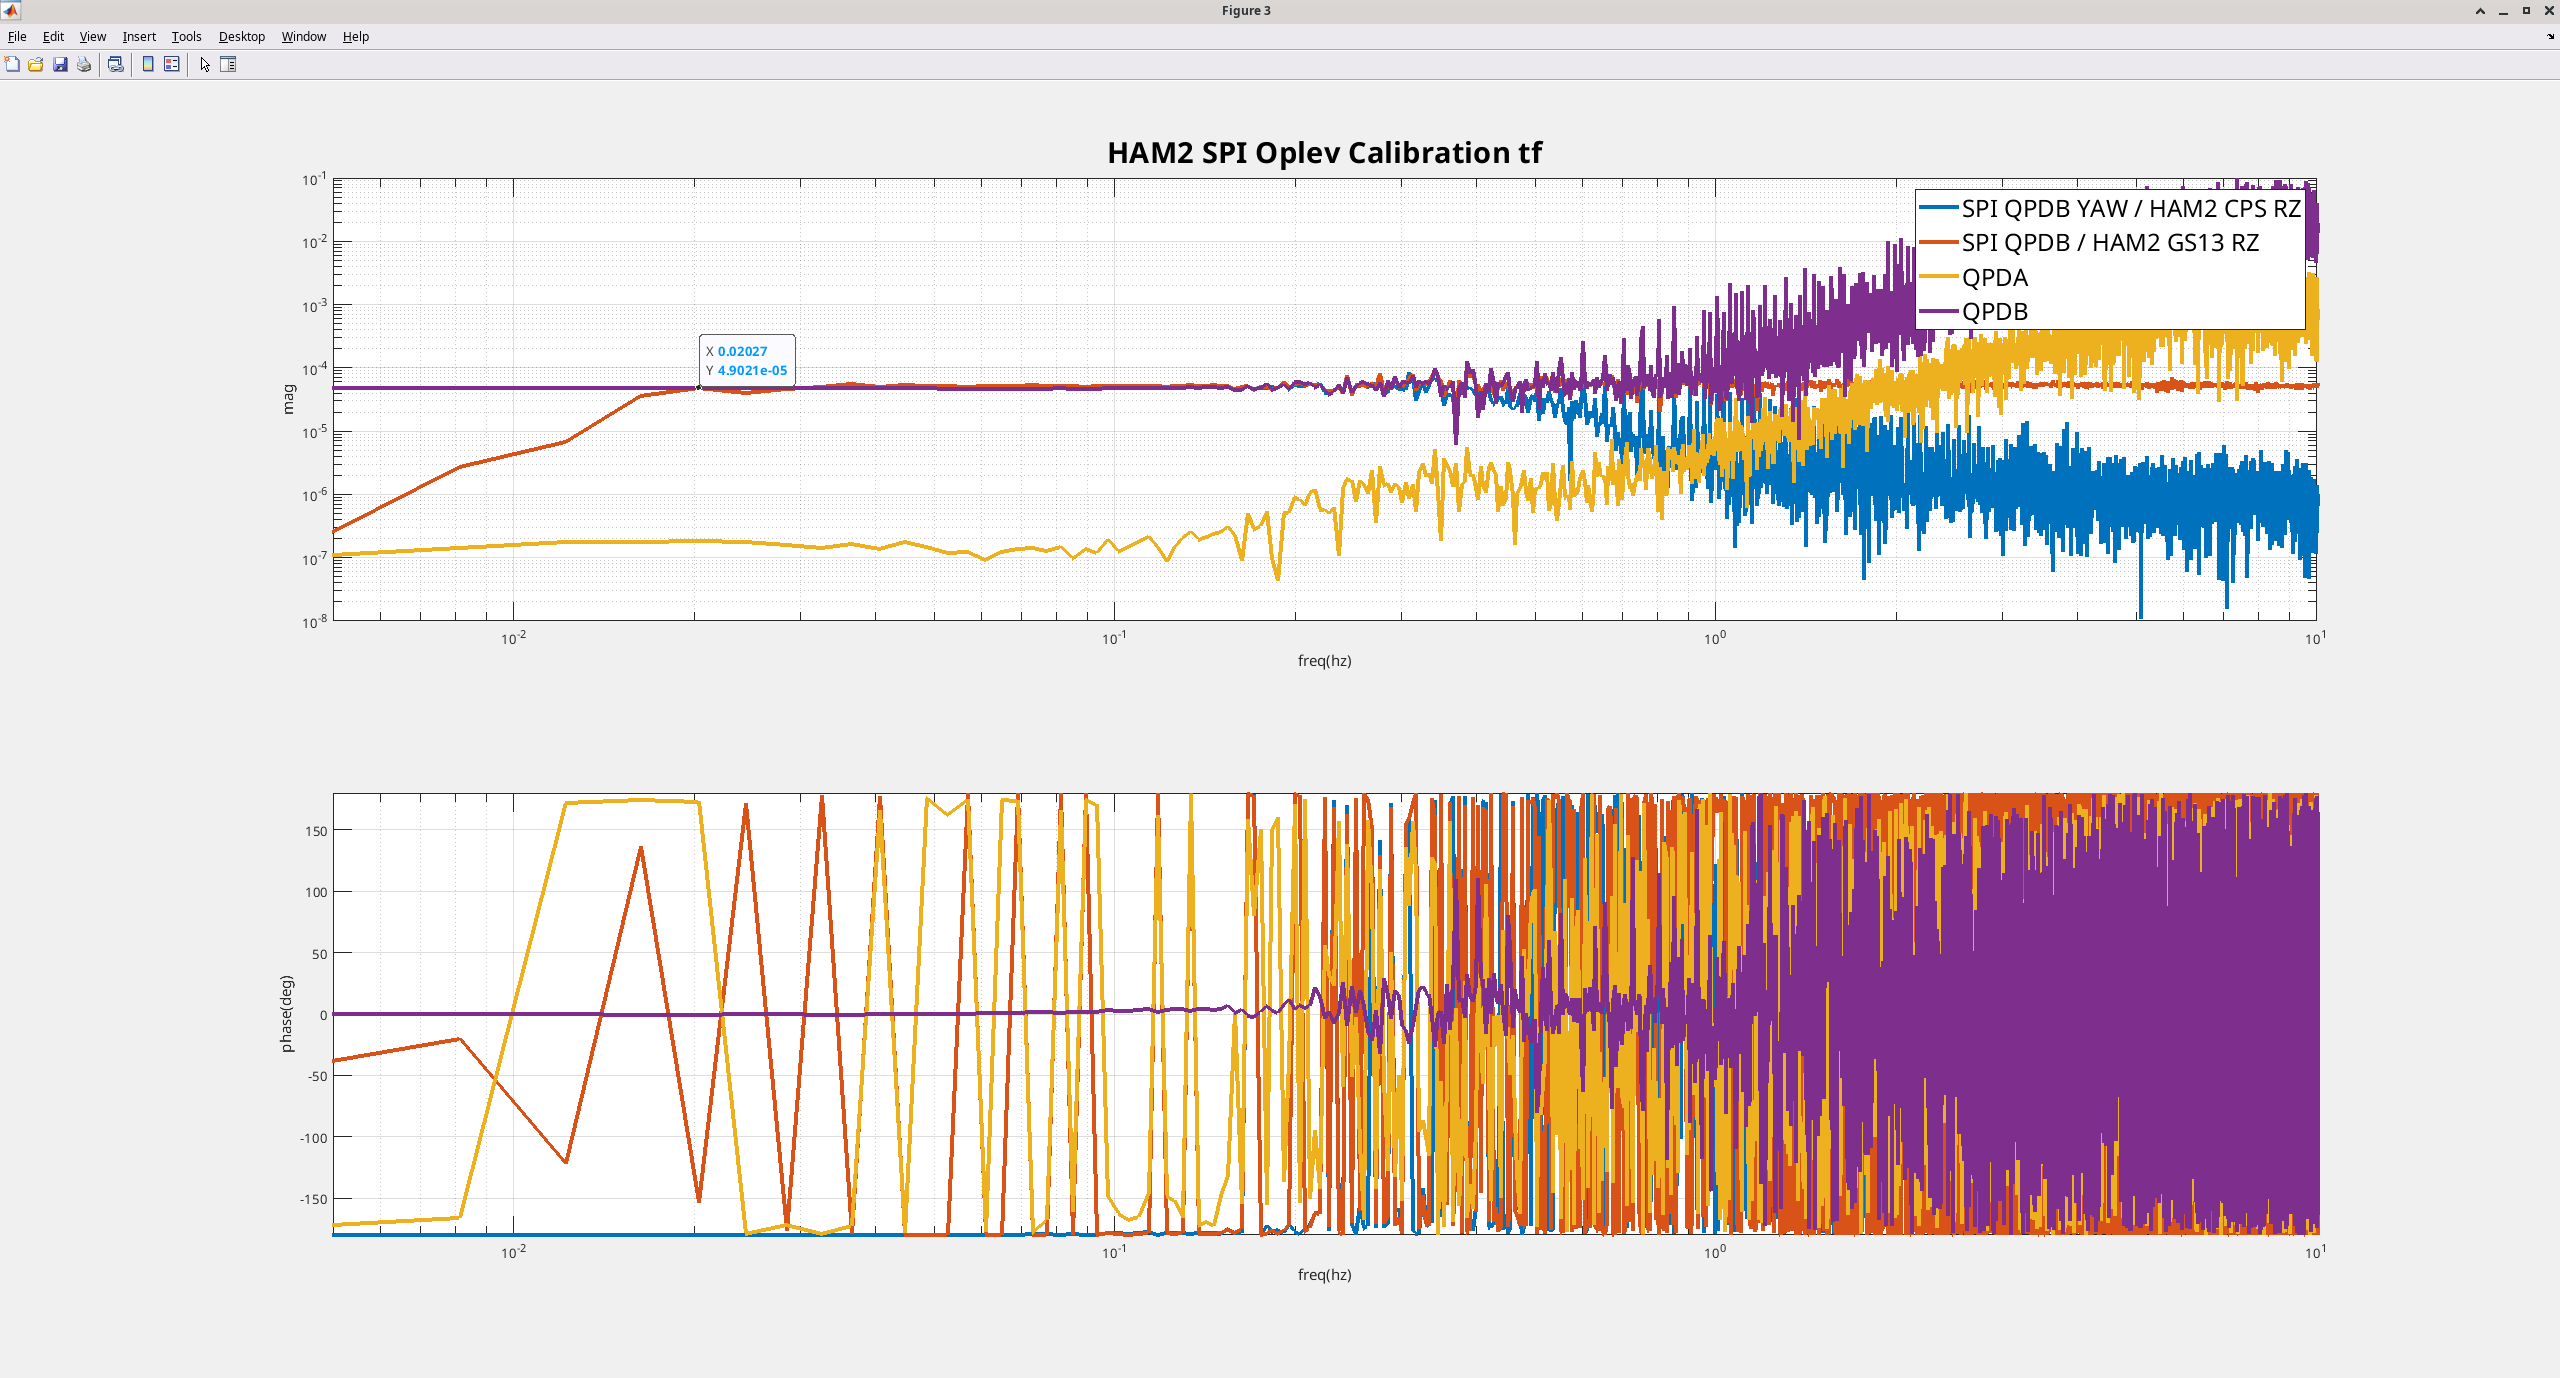
It took a couple tries last week, but I have taken HAM2&3 calibration transfer functions for SPI QPA and QPDB for pitch and yaw. I did this by using the excitation in awggui that we have used for the CRS calibration using amplitudes similar to what Huyen used recently, located at /ligo/svncommon/SeiSVN/seismic/HAM-ISI/H1/HAM3/CRS/Templates/dtt/ryexc2.txt. For RY I used an amplitude of 7e3, for RZ I used an amplitude of 10e3. Isolation loops were engaged on both ISI's and they were running nominal blends (no crs on HAM3), but sensor correction and cps diff were both off. For each measurement I've saved the excitation and relevant sensors timeseries into mat files that I am adding to SeiSVN/seismic/Common/SPI/DATA, as well as scripts for each excitation to get the data, save the timeseries structure and plot the tfs.
The four attach plots are the tfs for each excitation in the order HAM2 RY, HAM2 RZ, HAM3 RY, HAM3 RZ. For each tf, the SPI and CPS seem to agree very well over a few mhz to ~.2hz, the gs13s go a bit higher in frequency, but aren't good witnesses much below .1hz. On each plot I've indicated amplitude of the spi to cps tf at one frequency point, I think the calibration should be the inverse of these values. I don't remember the units of the QPD channels, it's not cts.
From those numbers I get:
HAM2 pitch calibration for QPDB is 19829 nrad/?
HAM2 yaw calibration for QPDB is 20400 nrad/?
HAM3 pitch calibration for QPDA is 231430 nrad/?
HAM3 yaw calibration for QPDA is 237700 nrad?
I think the HAM3 pit calibration is roughly inline with the one Arnaud calculated.
Excitations were all ~40minutes long. The timestamps for each injection are:
HAM2 RY: aug 28 2026 0:29:55 utc
HAM2 RZ: aug 28 2026 1:07:29 utc
HAM3 RY: aug 28 2026 2:00:00 utc
HAM3 RZ: aug 28 2026 2:49:14 utc