Jennie W, Sina K,
Summary: Yesterday Sina and I did the dark noise measurement for the SPI interferometer and the two SPI optical levers and added in calibration filters based on Jim's measurement of the optical lever to ISI sensor TFs. We also founbd that the dark noise for QPDA has an unexpected shape and so need to do some noise hunting to track this down.
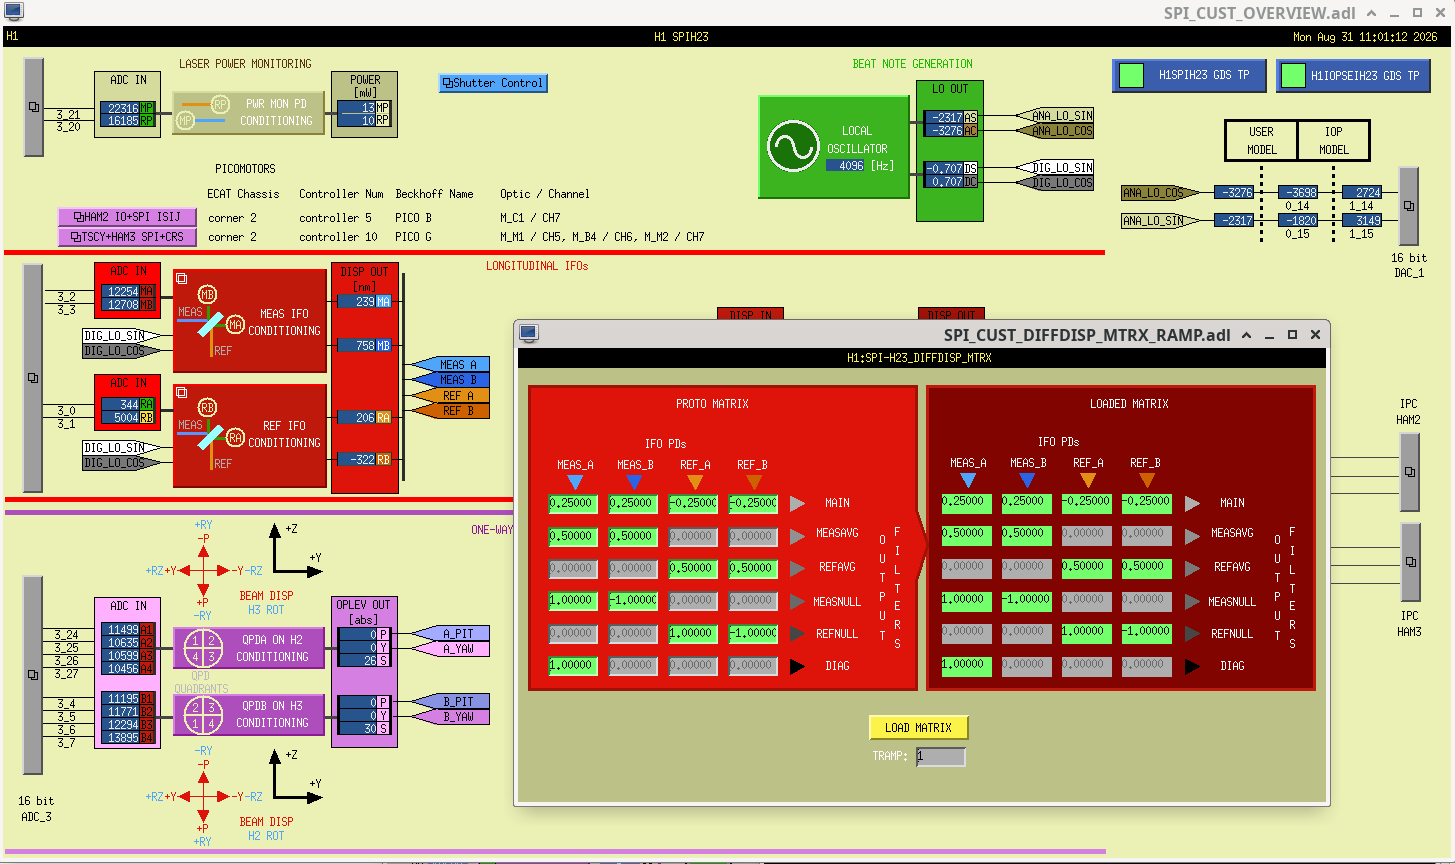
Before doing this we edited the SPI-H23_DIFFDISP matrix to include the factor of 2 that comes from the fact the IFO measures the light round trip between the two platforms and we want it to measure the displacement between them, ie. we divided the first line of coefficients by 2.
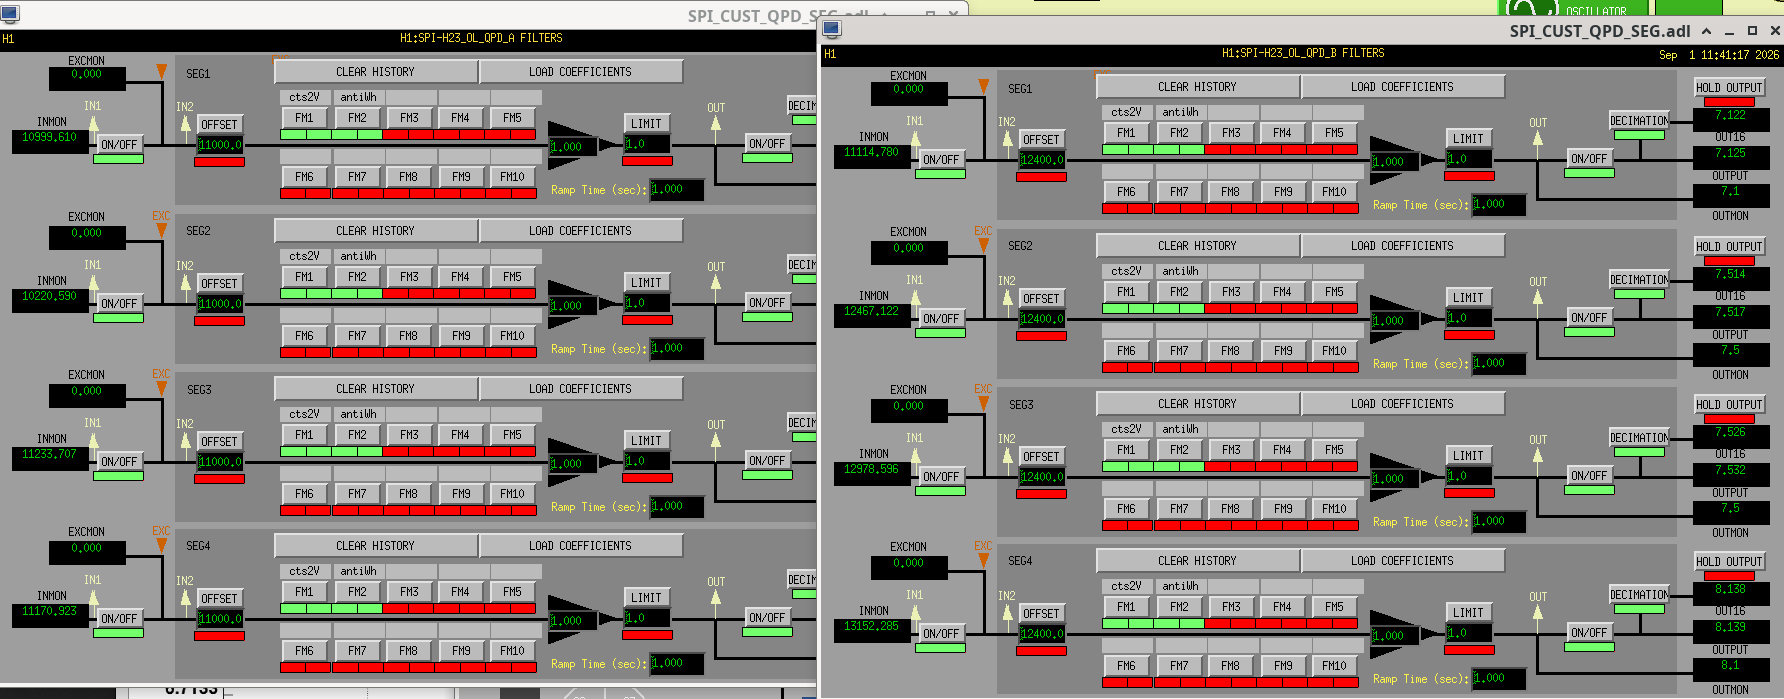
Jeff has implemented a new filter bank set for the optical levers called OPLEV CAL FILTERS on the main SPI overview. See image. The output of this filter bank is the optical lever in the qpd basis. The measured calibration will go in 'OPLEV OUT FILTERS' and the output of this filter bank will therefore be in the ISI basis.
We then followed the procedure in T2600019.
- With the laser unshuttered measure the average and amplitude of the photodiode signals on the ADCs. Then measure the average signal in the QPD quadrants. Here is the diaggui template where I measured the signals with the laser unshuttered.
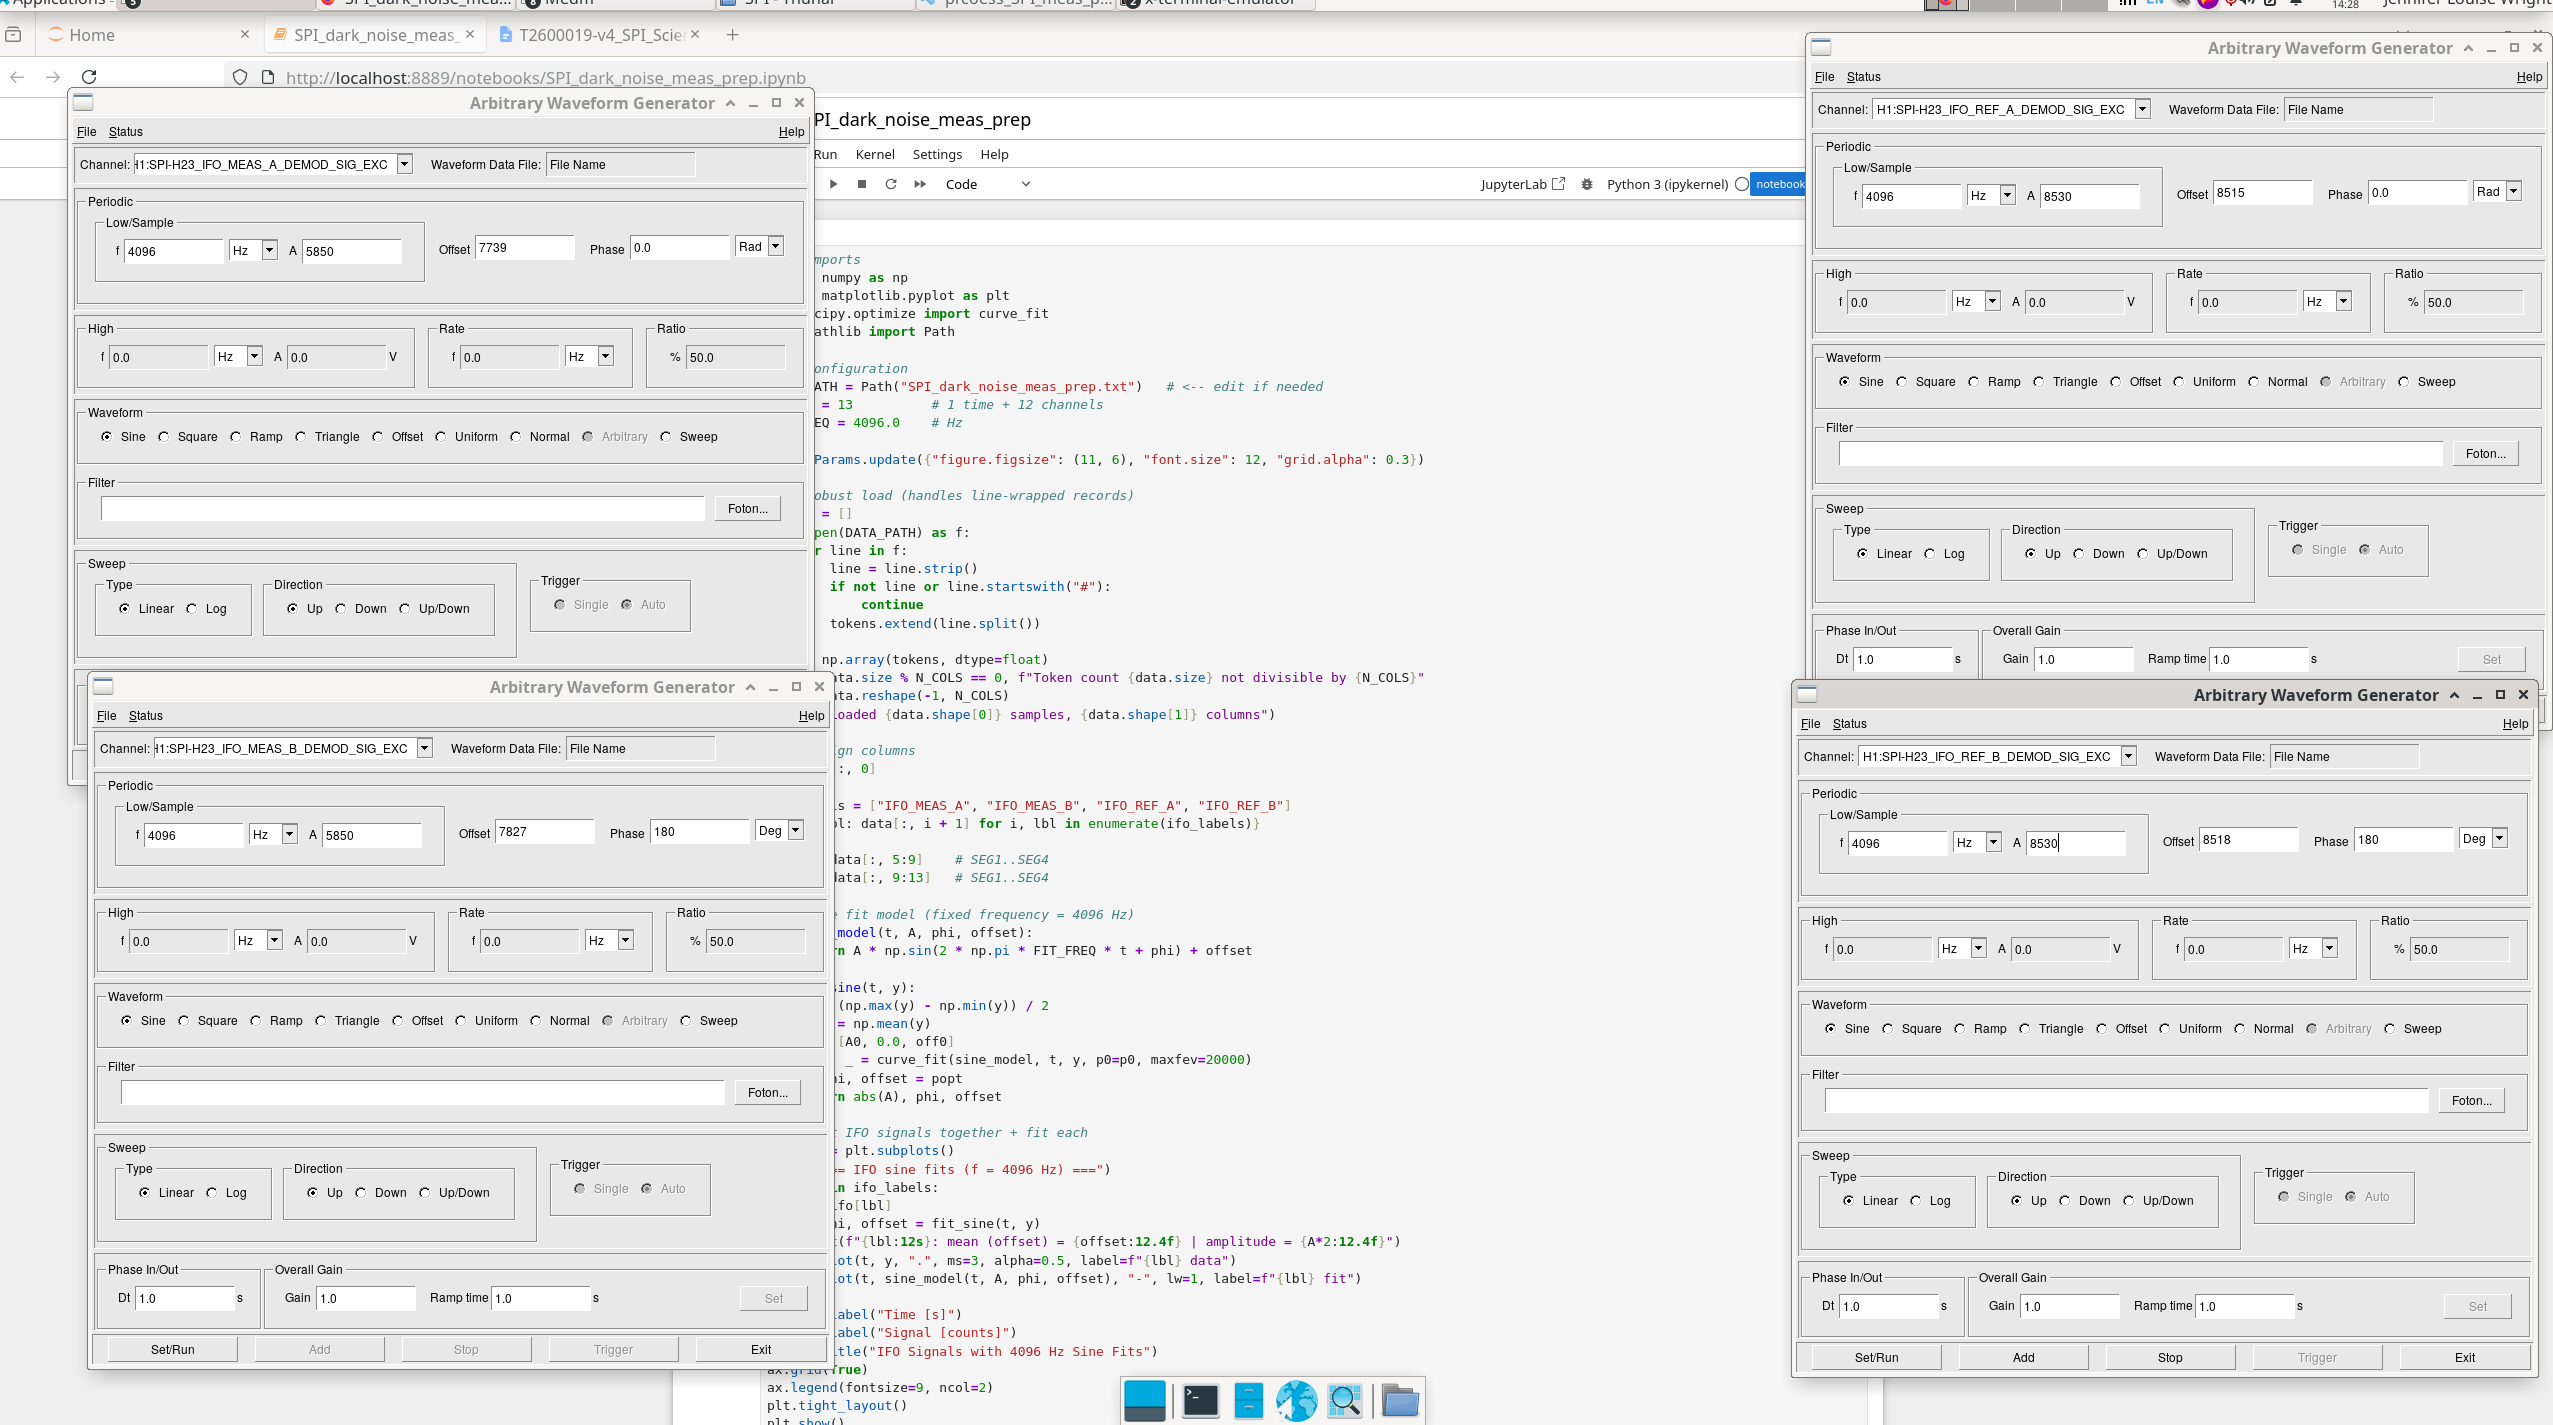
- Shutter the light and use awg to create fake signals into the SPI-H23_SIG filter banks for each PD. This should be at 4096 Hz with a 180 degrees phase offset between the A and B PD signals. We used a script to calculate the average and peak to peak values for each interferometer based on what the real data gives us.
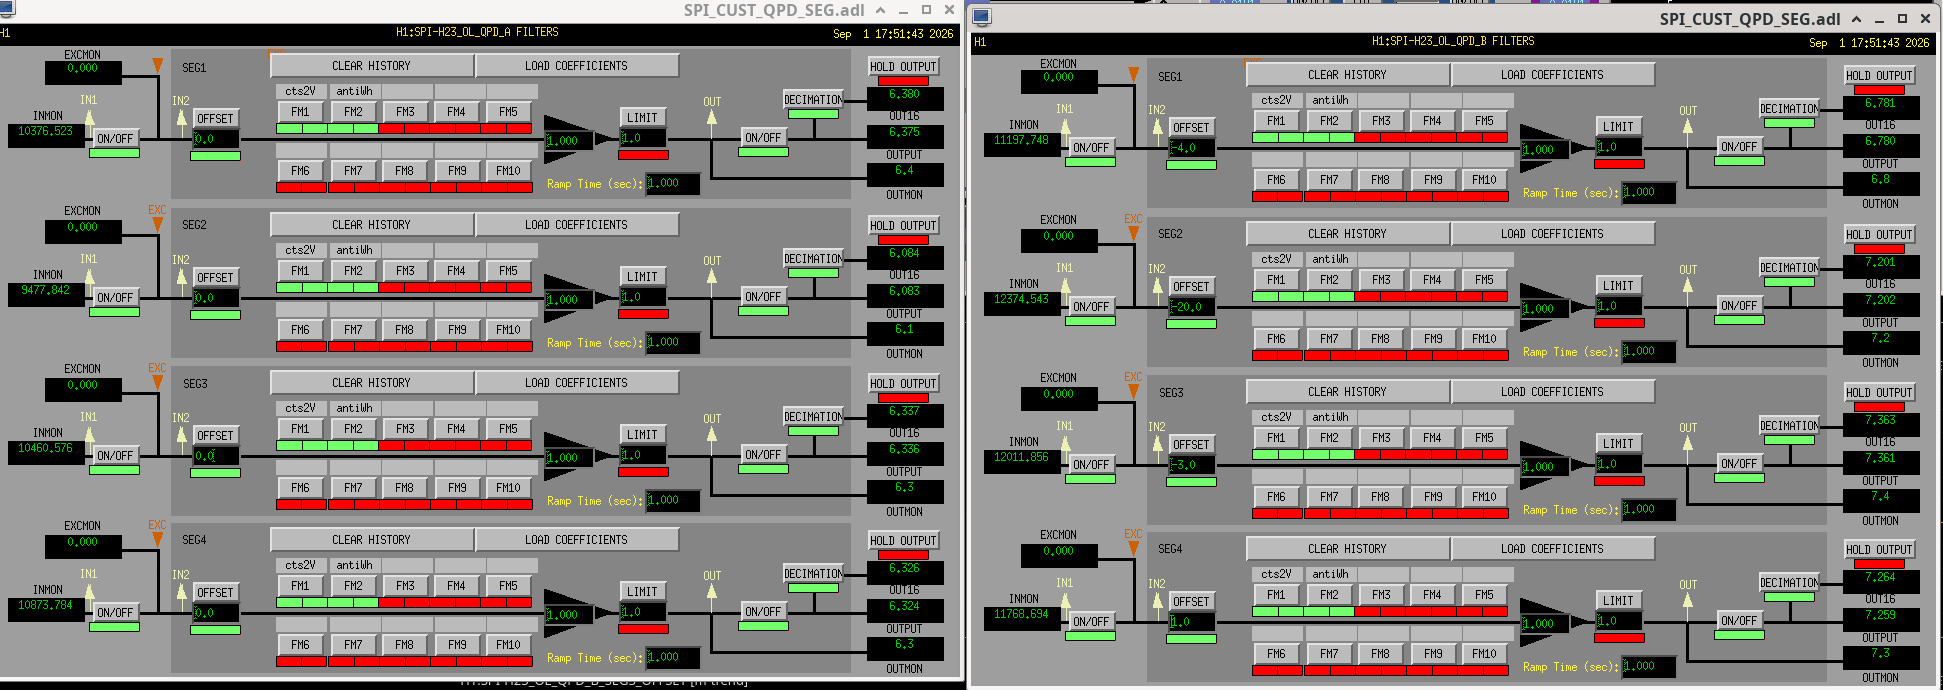
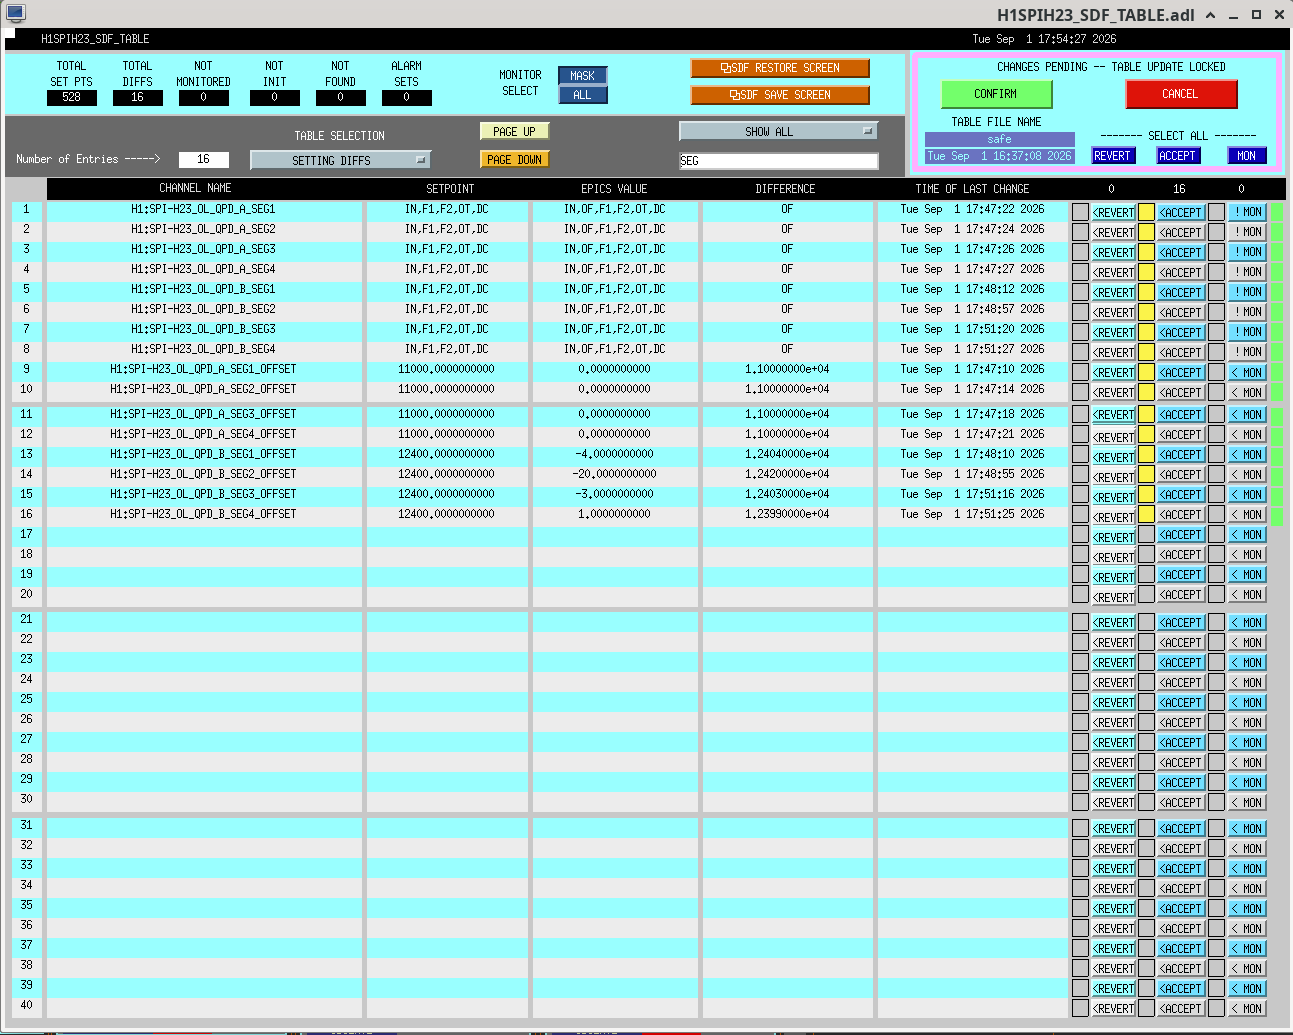
- For the QPDs use static offsets in the QPD input filter banks to give the correct average power (picture taken today so offsets turned off).
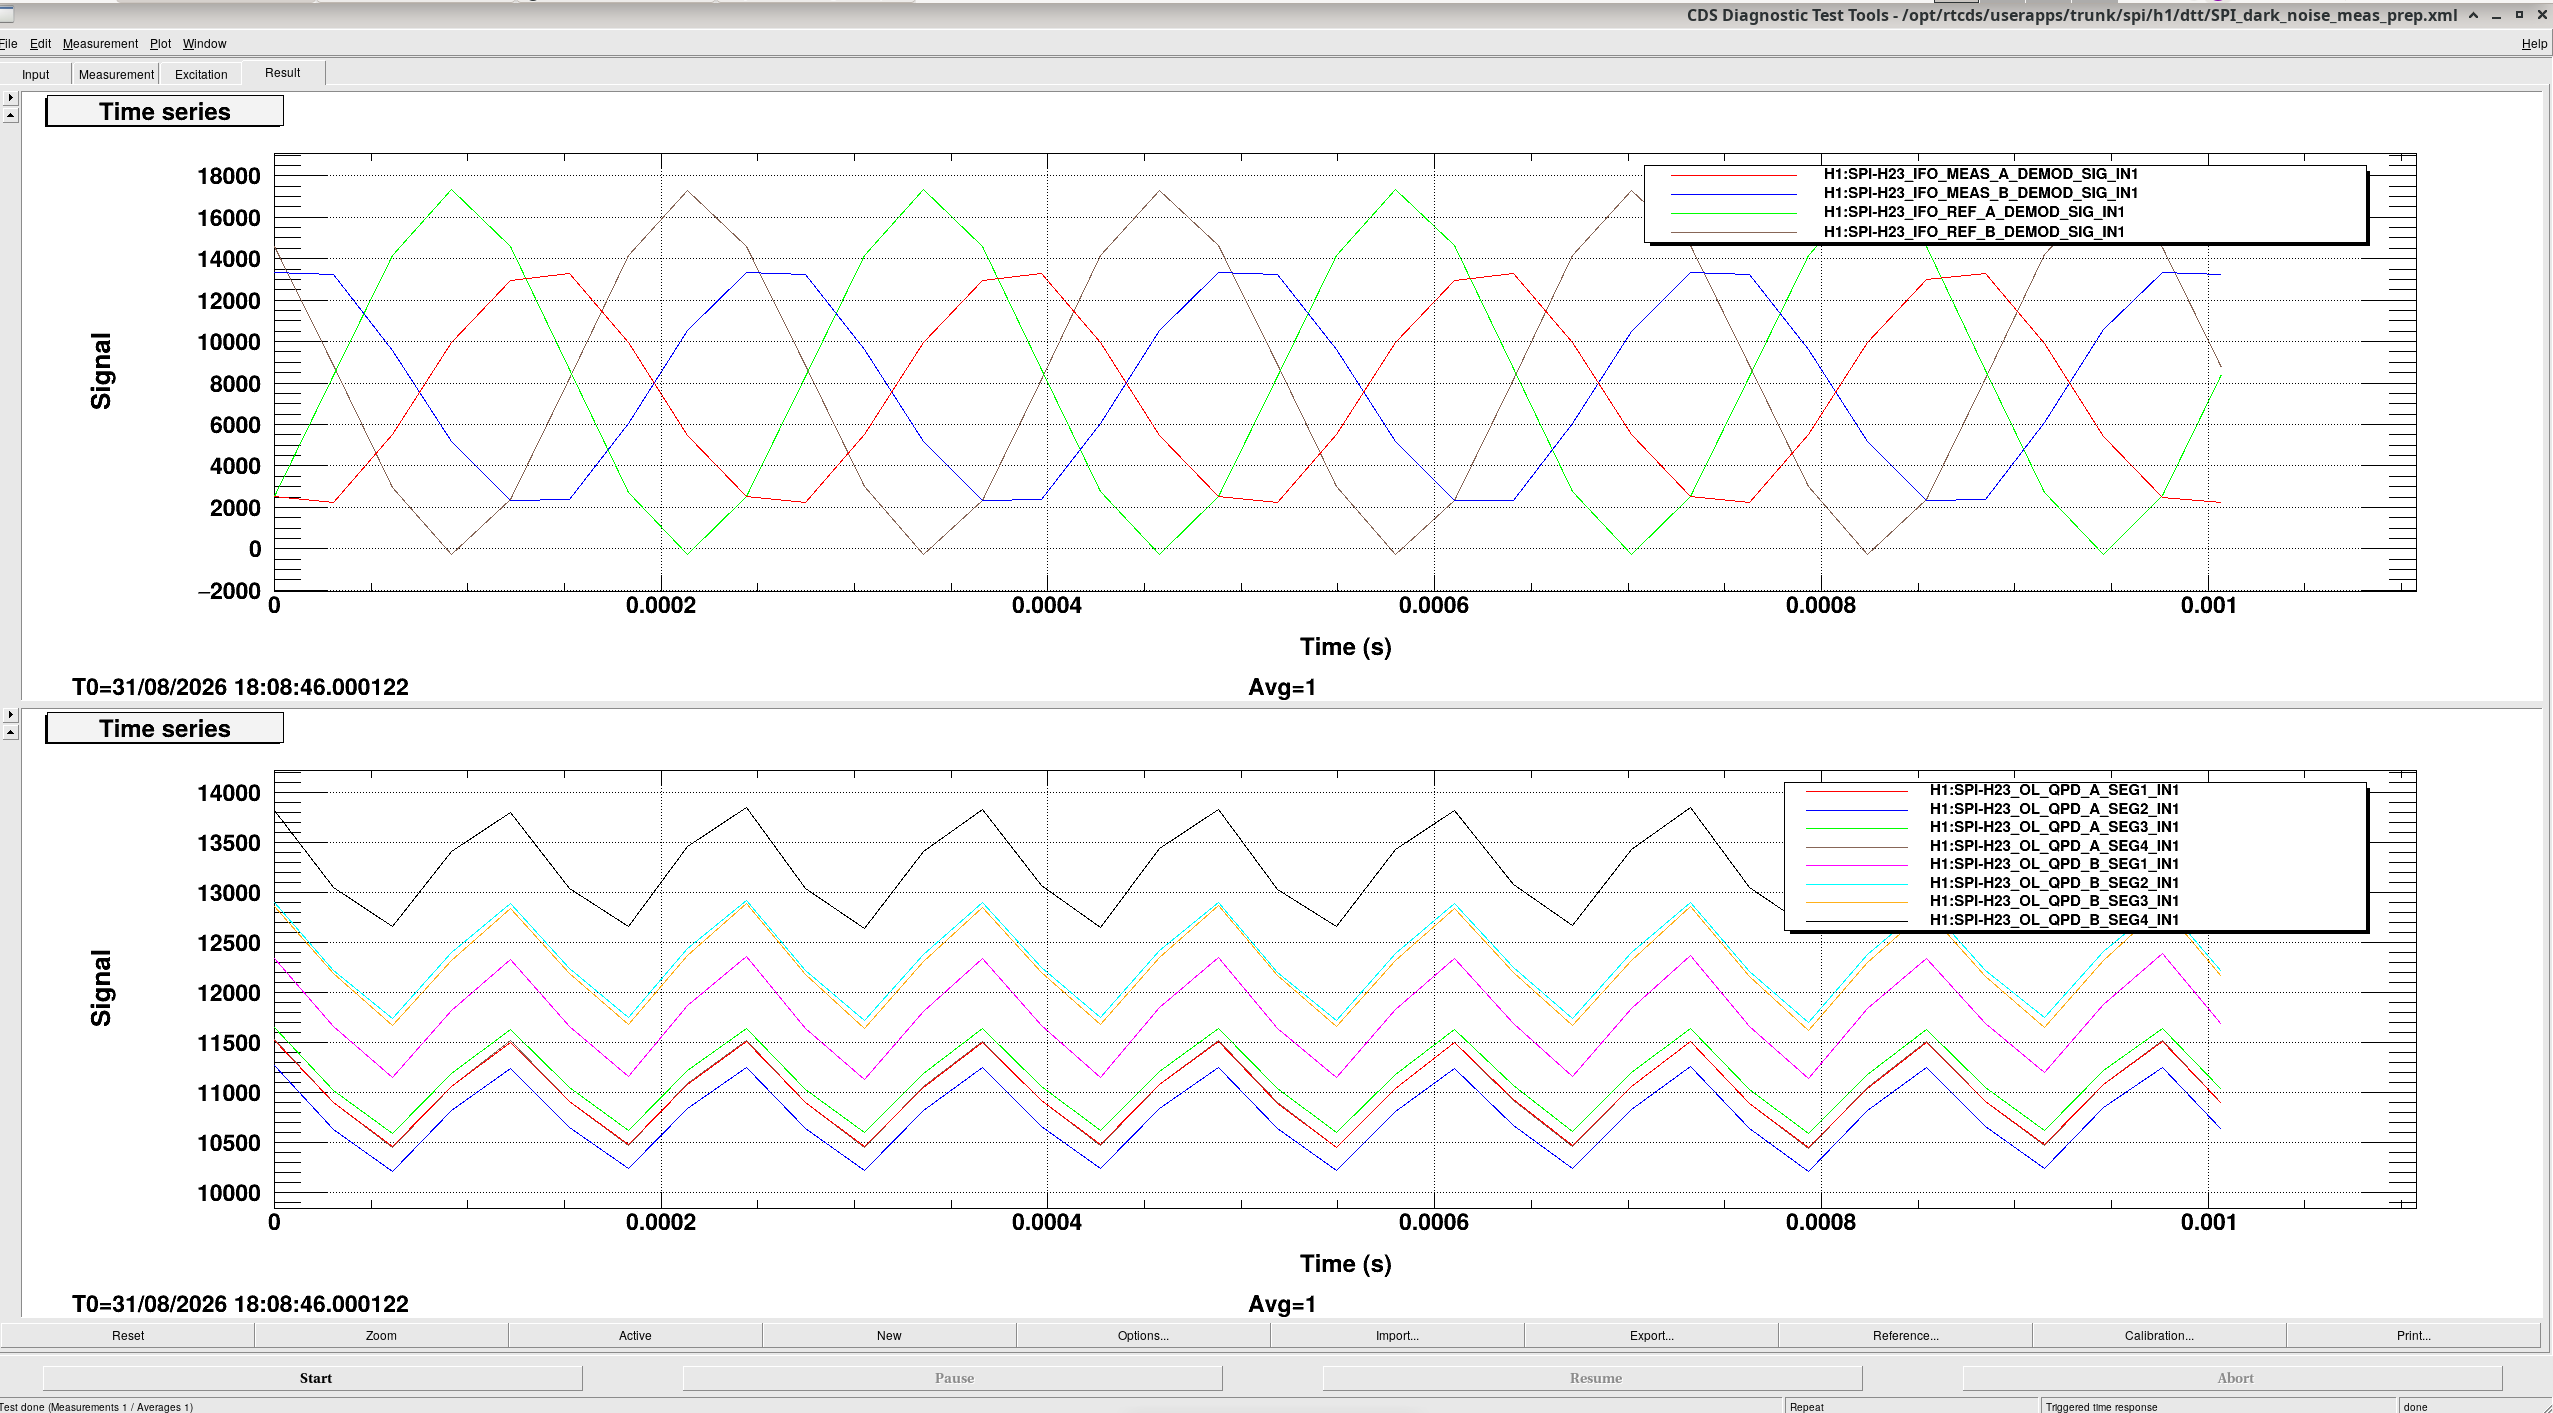
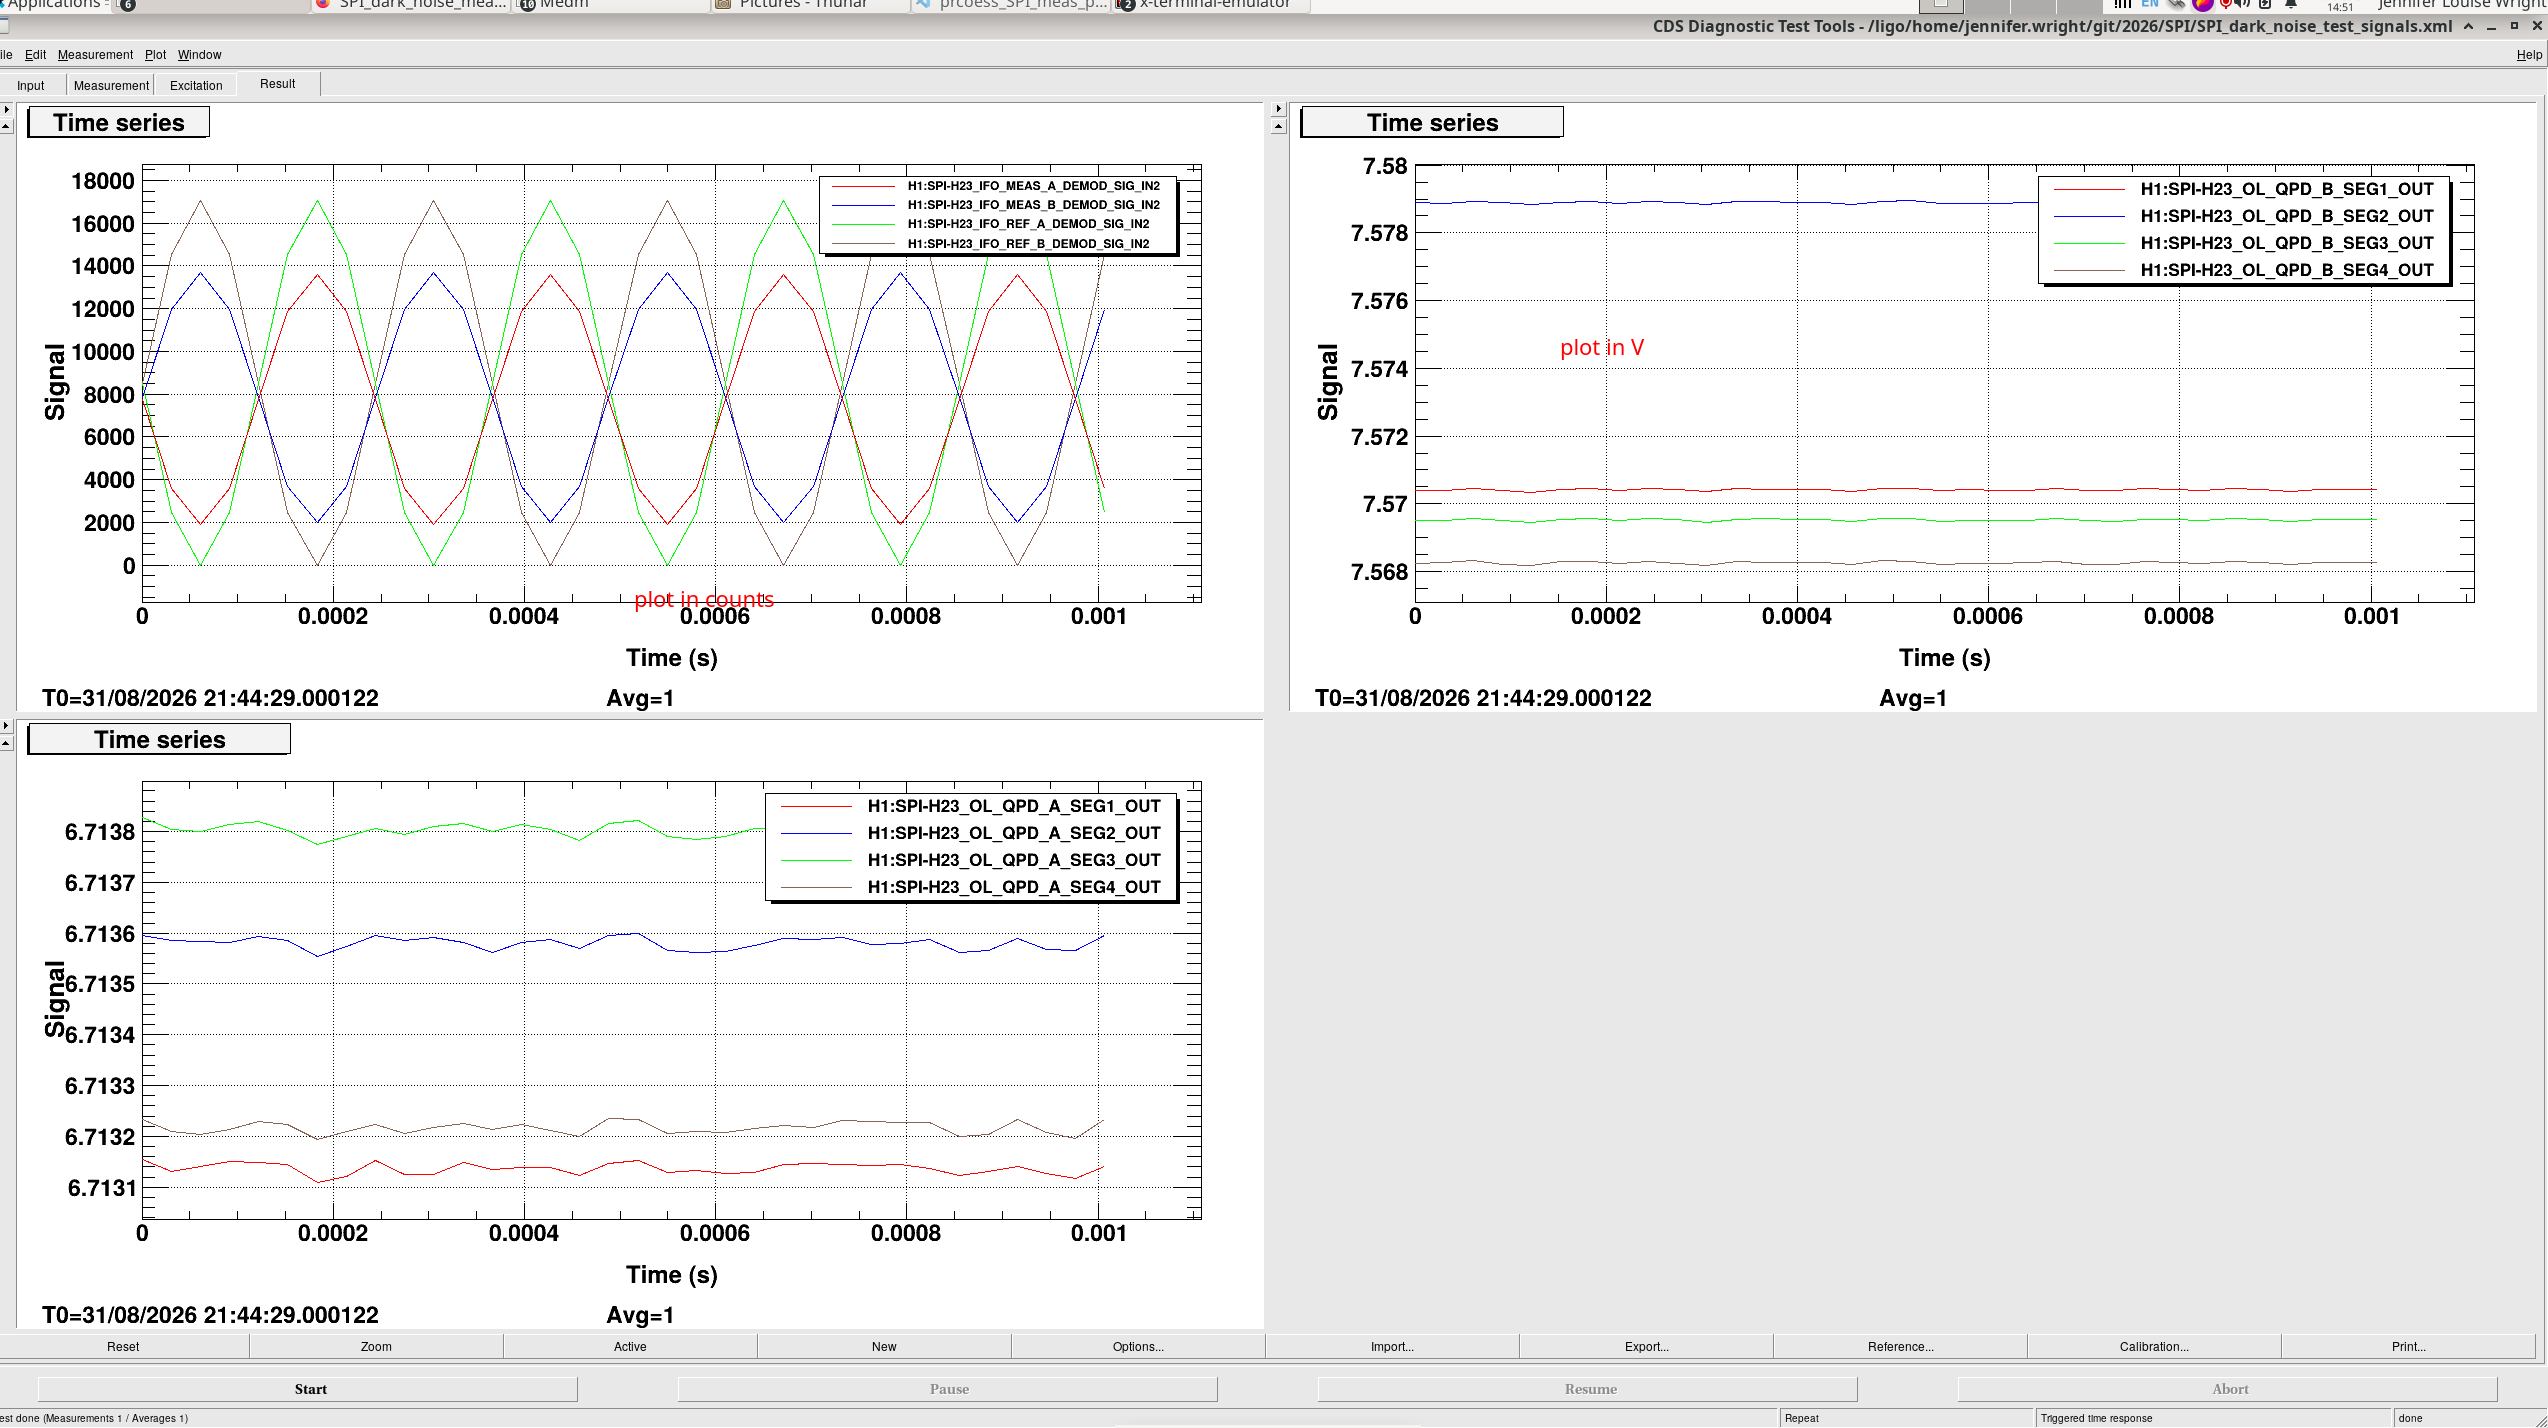
- We did a measurement to check that the values we chose gave what we expected. Note the input filters banks for the QPDs convert the signal to V so these plots are in V while the IFO plot in the top left is in counts. The average values for all the signals match our measurement with the laser unshuttered and the amplitude for the interferometer signals matches what we measured from real data.
- The amplitude spectral density of PD and QPD signals is shown here. Top left is the displacement of the interferometer with no light. It is calibrated into nm/sqrt(Hz) using the equation disp = lambda/(2pi*phase) which is implemented in the H23 IFO DISP filter bank. Bottom left is the QPD A channels in normalised units (ie. the pitch and yaw readings normalised by the total sum of the signal from each quadrant) in pink and light blue. The other four traces are taken downstream after the theoretical calibration is applied in the CAL filter bank and at the output of the OPLEV OUT filter bank. Top right plot shows the same channels for QPDB and HAM2, again showing the value for pitch and yaw of QPDA in pink and light blue and then showing the output of the CAL and OUTPUT filter blocks for QPDA and ISI J.
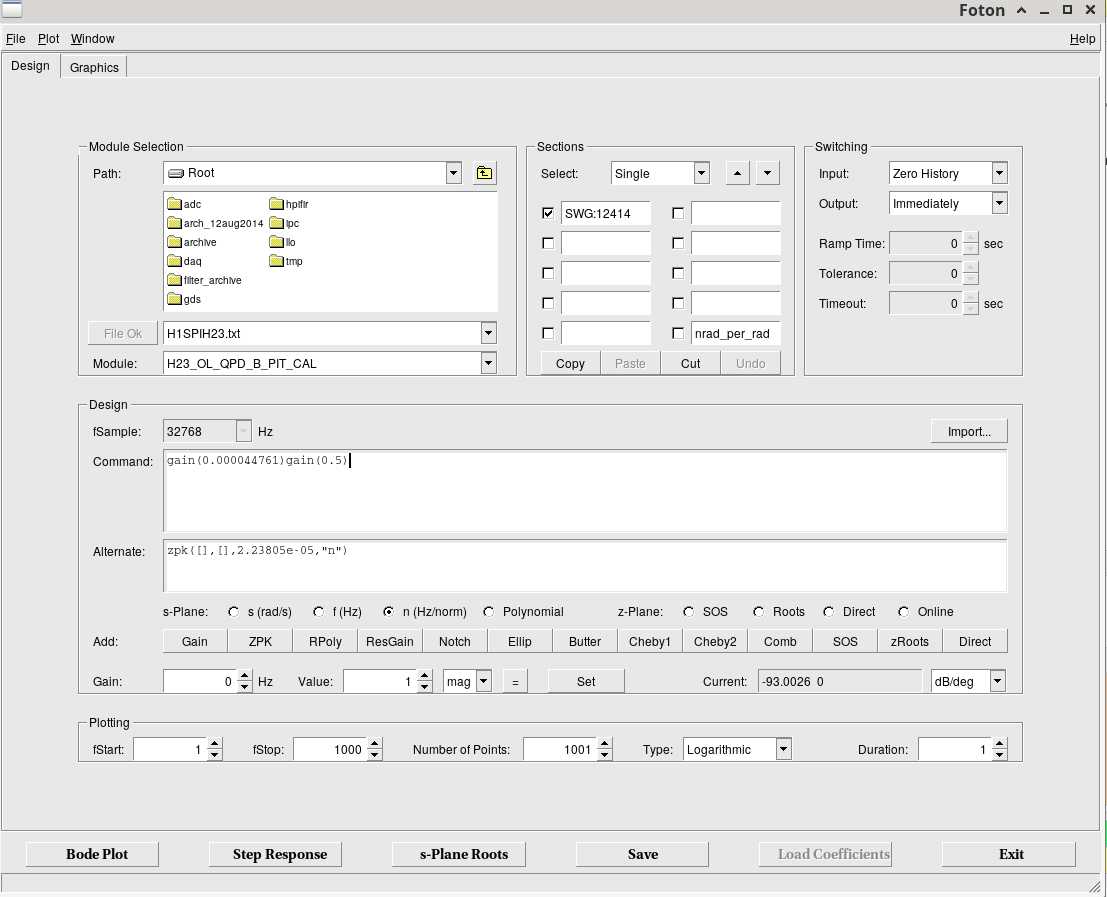
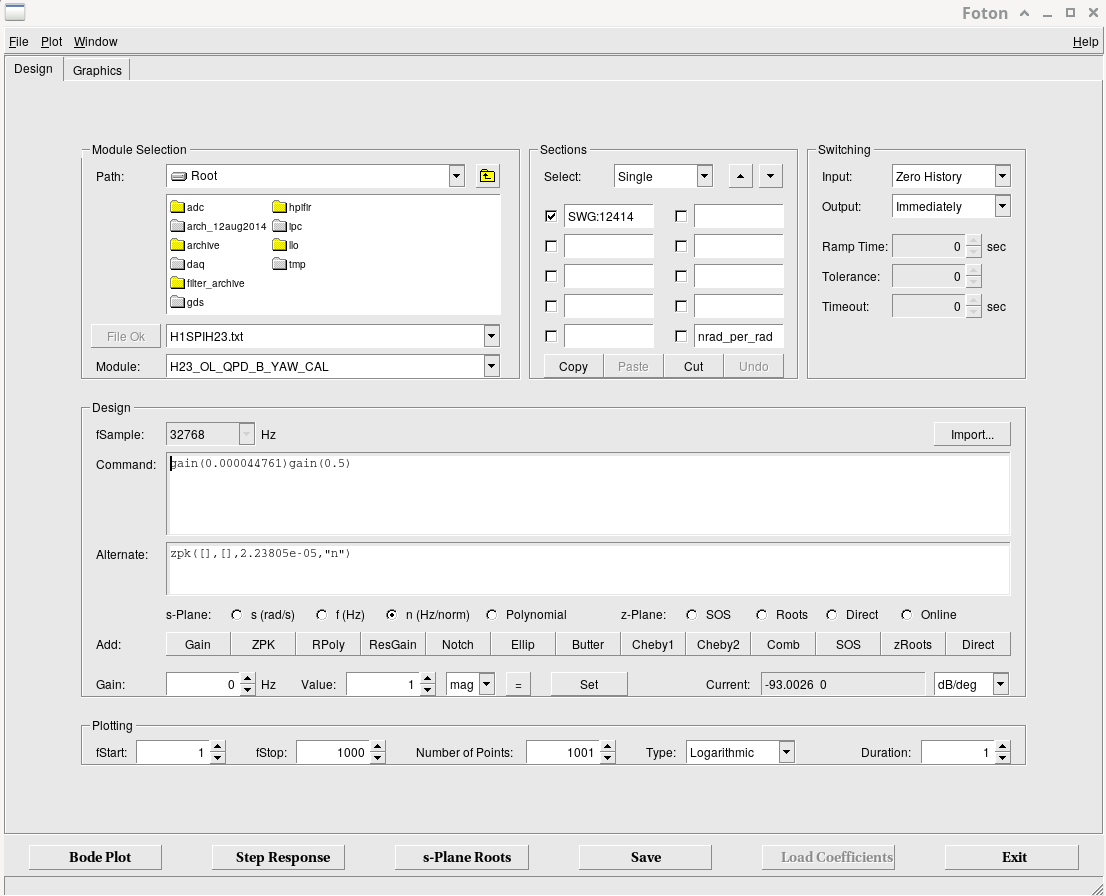
- After comparing the theory calibrations with the measured ones Jim obtained in alog # 91754, Sina realised (SWG log #12414) that the QPDB theory calibration is wrong by a factor of 2 due to the fact that its beam is a back reflection from a mirror in HAM2 and so measures twice the angle that the ISI rotates by.
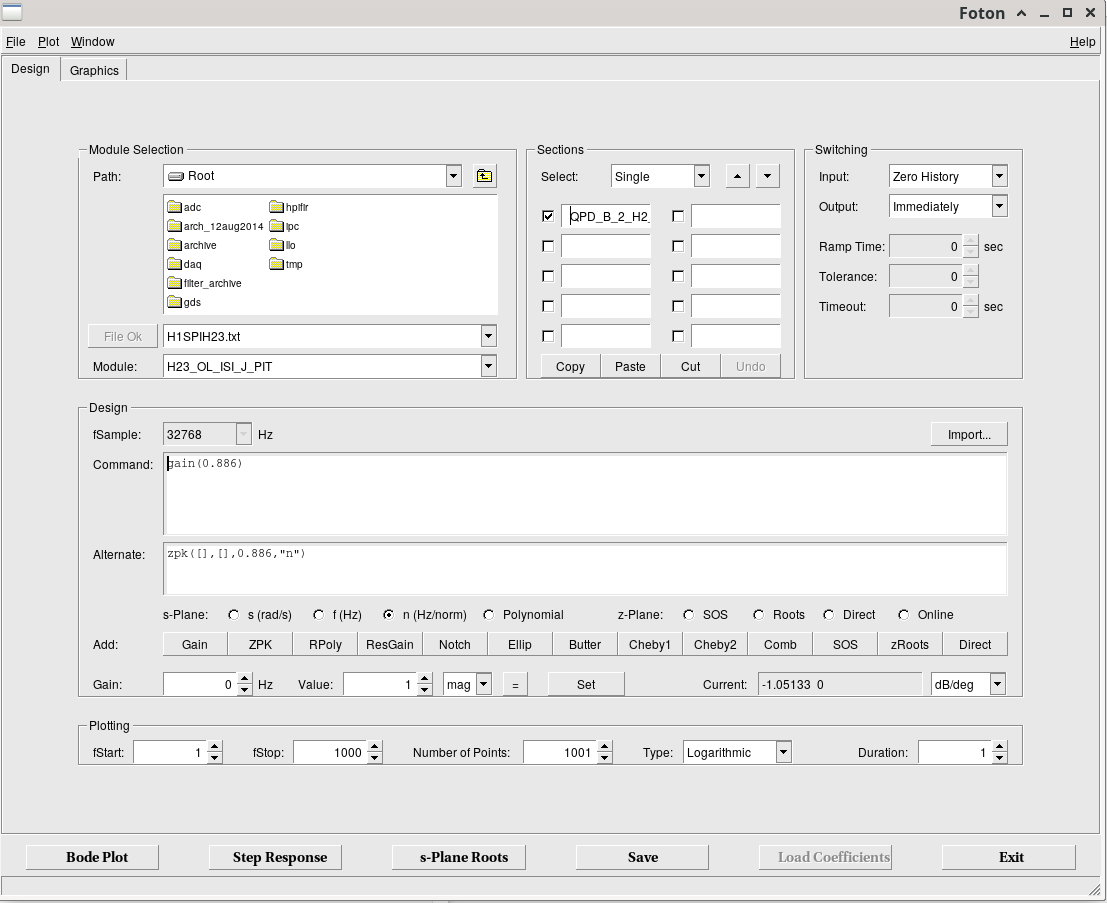
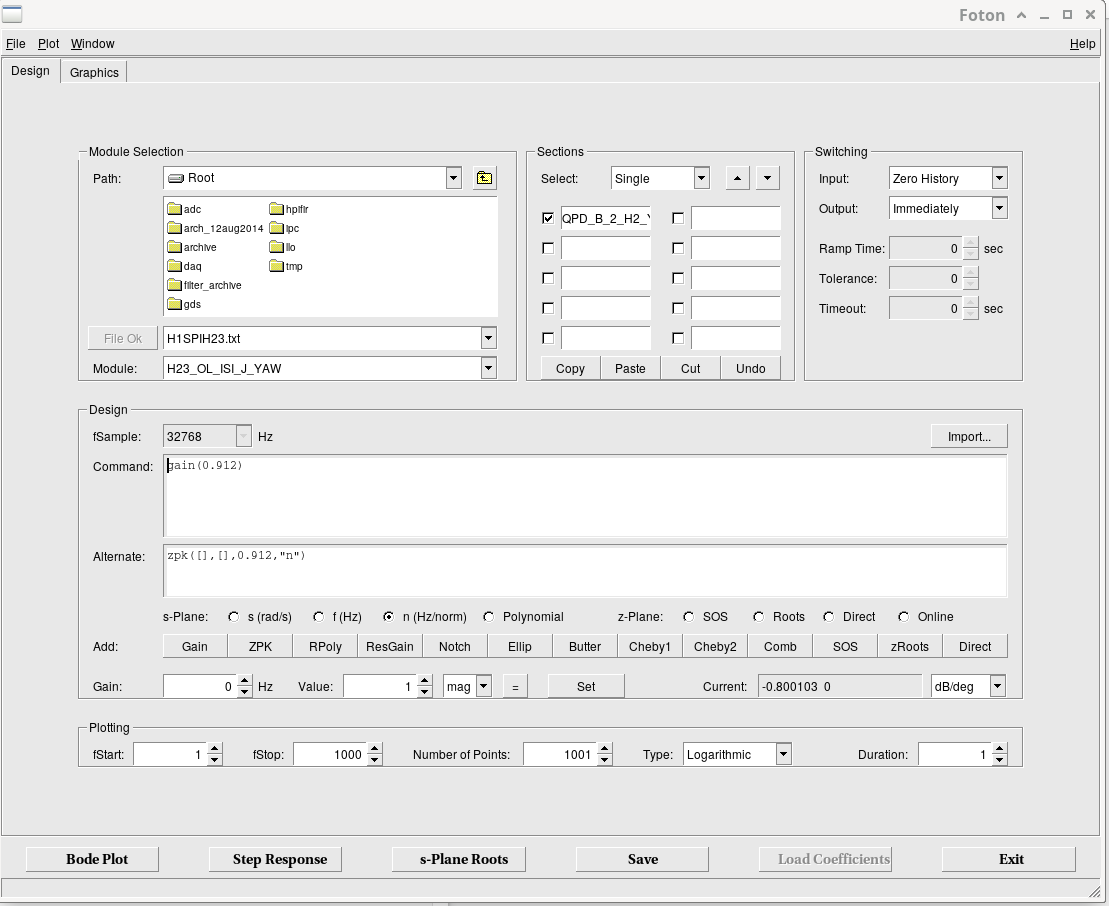
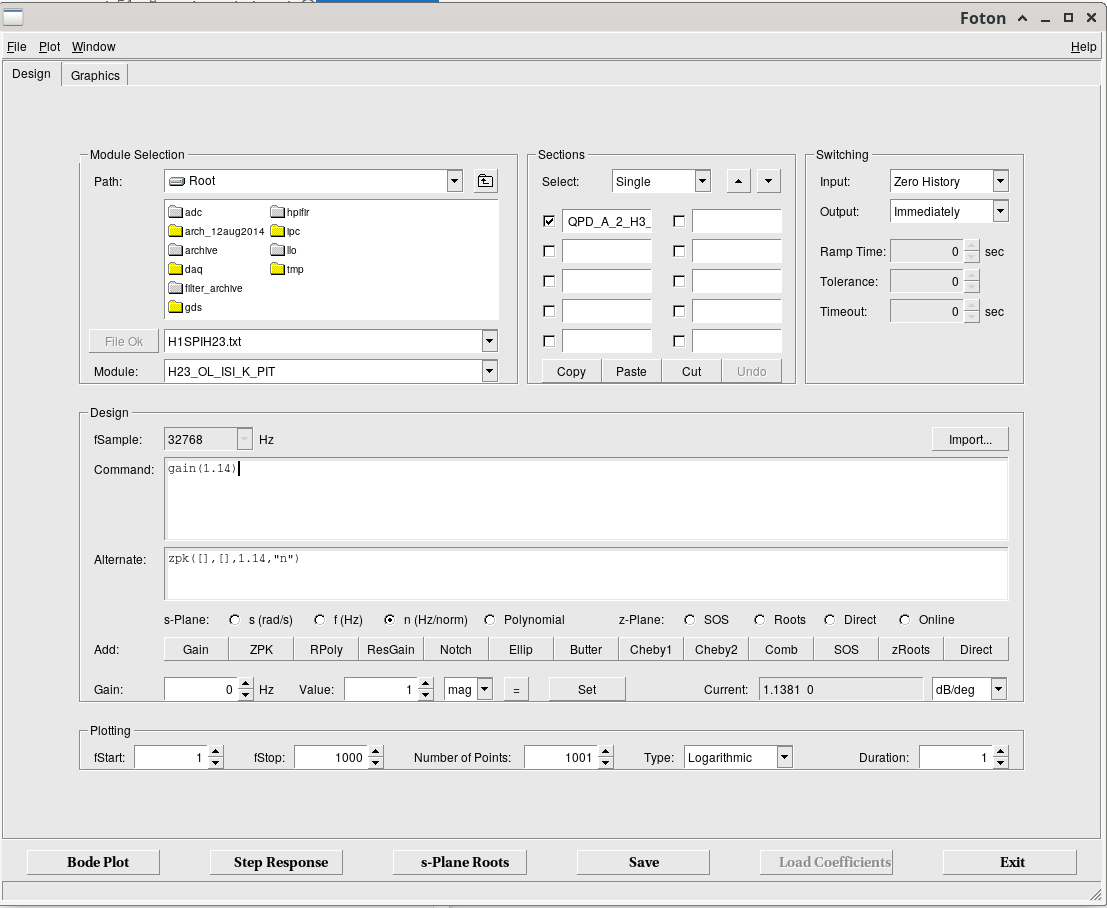
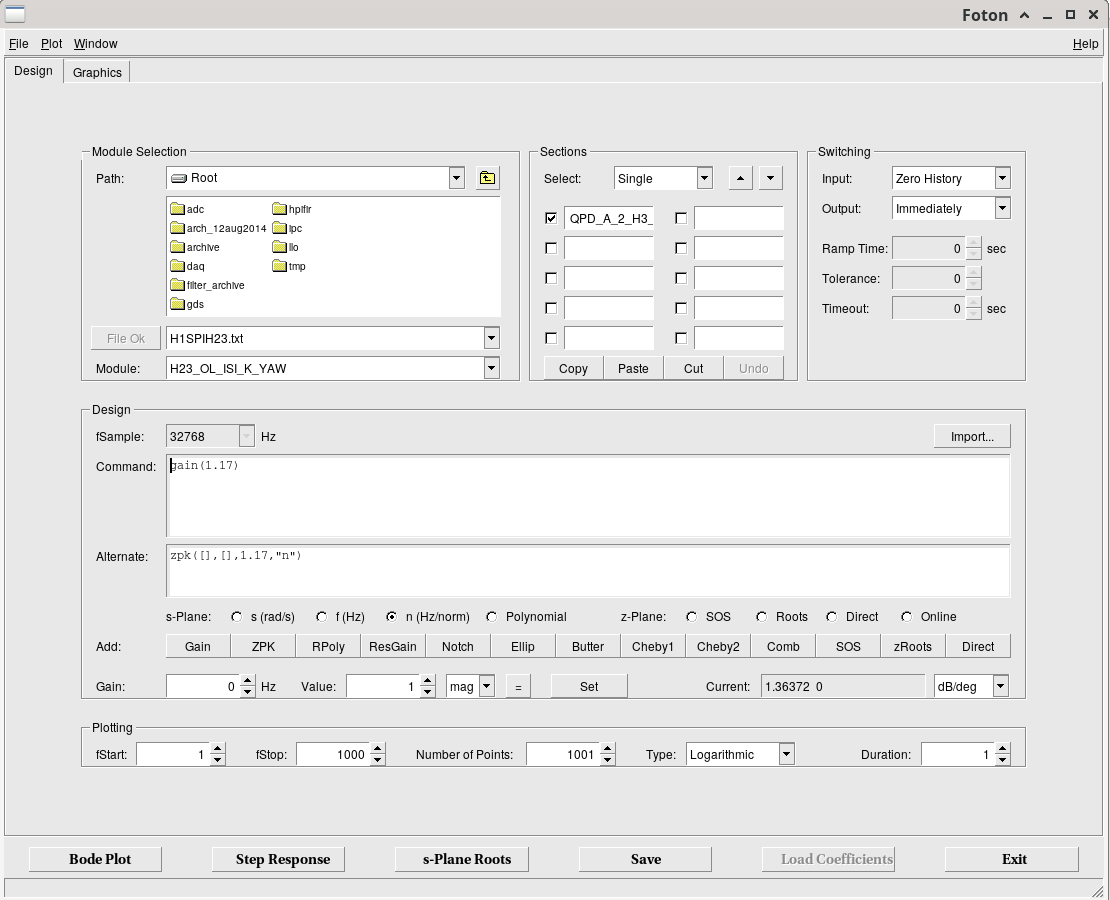
- I updated the calibration in the QPDB CAL filter banks (pitch and yaw) and also added a measured calibration factor in the OPLEV OUT filter banks. This correction factor is (measured calibration in nradians/normalised QPD units) / (theory calibration in nradians/normalised QPD units. QPDB Pitch to HAM2 Pitch, QPDB Yaw to HAM2 Yaw, QPDA Pitch to HAM3 Pitch, QPDA Yaw to HAM3 Yaw.
- I took another measurement with the meaasured calibrations for the optical levers turned on. Top left is again the interferometer displacement in nm/sqrt(Hz), top right now has the rotation of HAM2 in QPD A basis with theory calibration included and in ISI basis with measured calibration included. Bottom right now has the rotation of HAM3 in QPD B basis with theory calibration included and in ISI basis with measured calibration included.
- The comparison between the dark noise of the two QPDs in normalised units (ie before calibration is applied) is shown in the bottom left. We understand the shaping of QPDB as being mainly due to the whitening filter which has a pole at 0.39Hz and a zero at 39.8 Hz, implying the dark nosie is dominated by ADC noise. The shape of QPDA does not match this whitening filter and so there must be some other electronic noise dominating. This requires further investigation.



Put the dark offsets on the QPDs back to what they were before our dark noise measurement. Accepted it in sdf.