Summary
Toward optimizing the JAC injection mode-match at 62 W, the 2 W LDWFS data (LIGO-P2600491) taken before the EOM swap, after it, and after the IO_MB_L2 move were re-analyzed with a full Finesse model of the injection and REFL paths. Mode mismatch power at 2 W: 1.8 % → 5.8 % → 4.5 % for the three states, consistent with the REFL PD lock/unlock ratio (1.9 / 5.7 / 4.9 %), which didn't enters the fit. The current lens position did not improve as much as predicted earlier because that prediction used the symplified model, which misses the near-resonance of the RF sideband's first-order modes in this cavity. The Finesse model includes it and now reproduces all three states. The 62 W analysis and the lens solution derived from it come next.
Result at 2 W
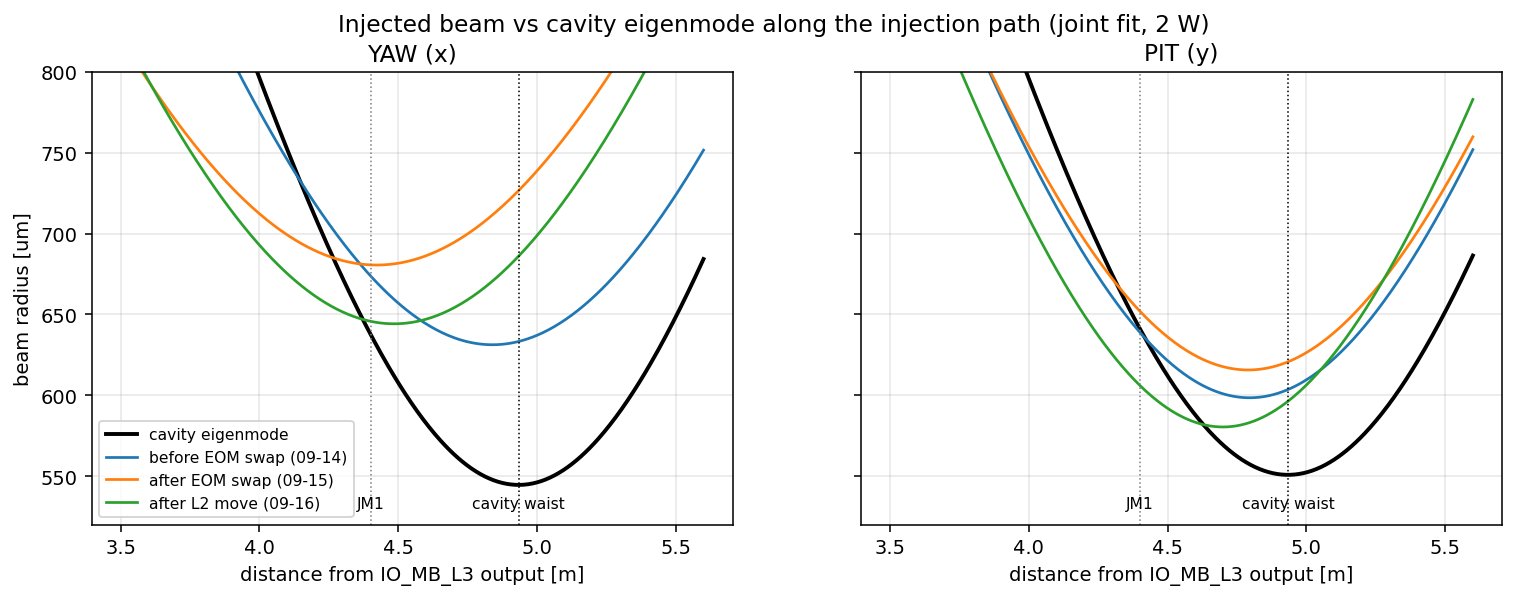
The table gives the fitted injected beam as a deviation from the cavity eigenmode, both taken at the output of IO_MB_L3. The eigenmode there has a waist of 545 µm (YAW) / 551 µm (PIT) located 4.93 m downstream of L3. dw is how much larger the injected waist is than that; dz is the position of the injected waist relative to the cavity waist, positive toward the cavity (downstream), so the negative values below mean the injected beam focuses before the cavity waist. Values come from the joint fit over the three data sets; the errors are statistical.
| YAW dw [µm] | YAW dz [mm] | PIT dw [µm] | PIT dz [mm] | |c20| / |c02| | mismatch (Finesse) | REFL lock/unlock | |
|---|---|---|---|---|---|---|---|
| before EOM swap (09/14) | +87 ± 6 | -94 ± 18 | +48 ± 4 | -138 ± 22 | 0.108 / 0.076 | 1.8 % | 1.87 % |
| after EOM swap (09/15) | +136 ± 6 | -511 ± 36 | +65 ± 4 | -143 ± 25 | 0.212 / 0.090 | 5.8 % | 5.73 % |
| after L2 move (09/16) | +100 ± 5 | -449 ± 28 | +30 ± 3 | -234 ± 21 | 0.183 / 0.092 | 4.5 % | 4.93 % |
- Mismatch (Finesse) is the carrier power the model puts outside the cavity TEM00 at the fitted solution, which includes all of the higher order mode.
Measurement
Three data sets were taken at 2 W input, one per state of the injection path: before the EOM swap, after the EOM swap, and after the IO_MB_L2 move. Each set is a series of 30 s records (24 records, 12 for the last one).
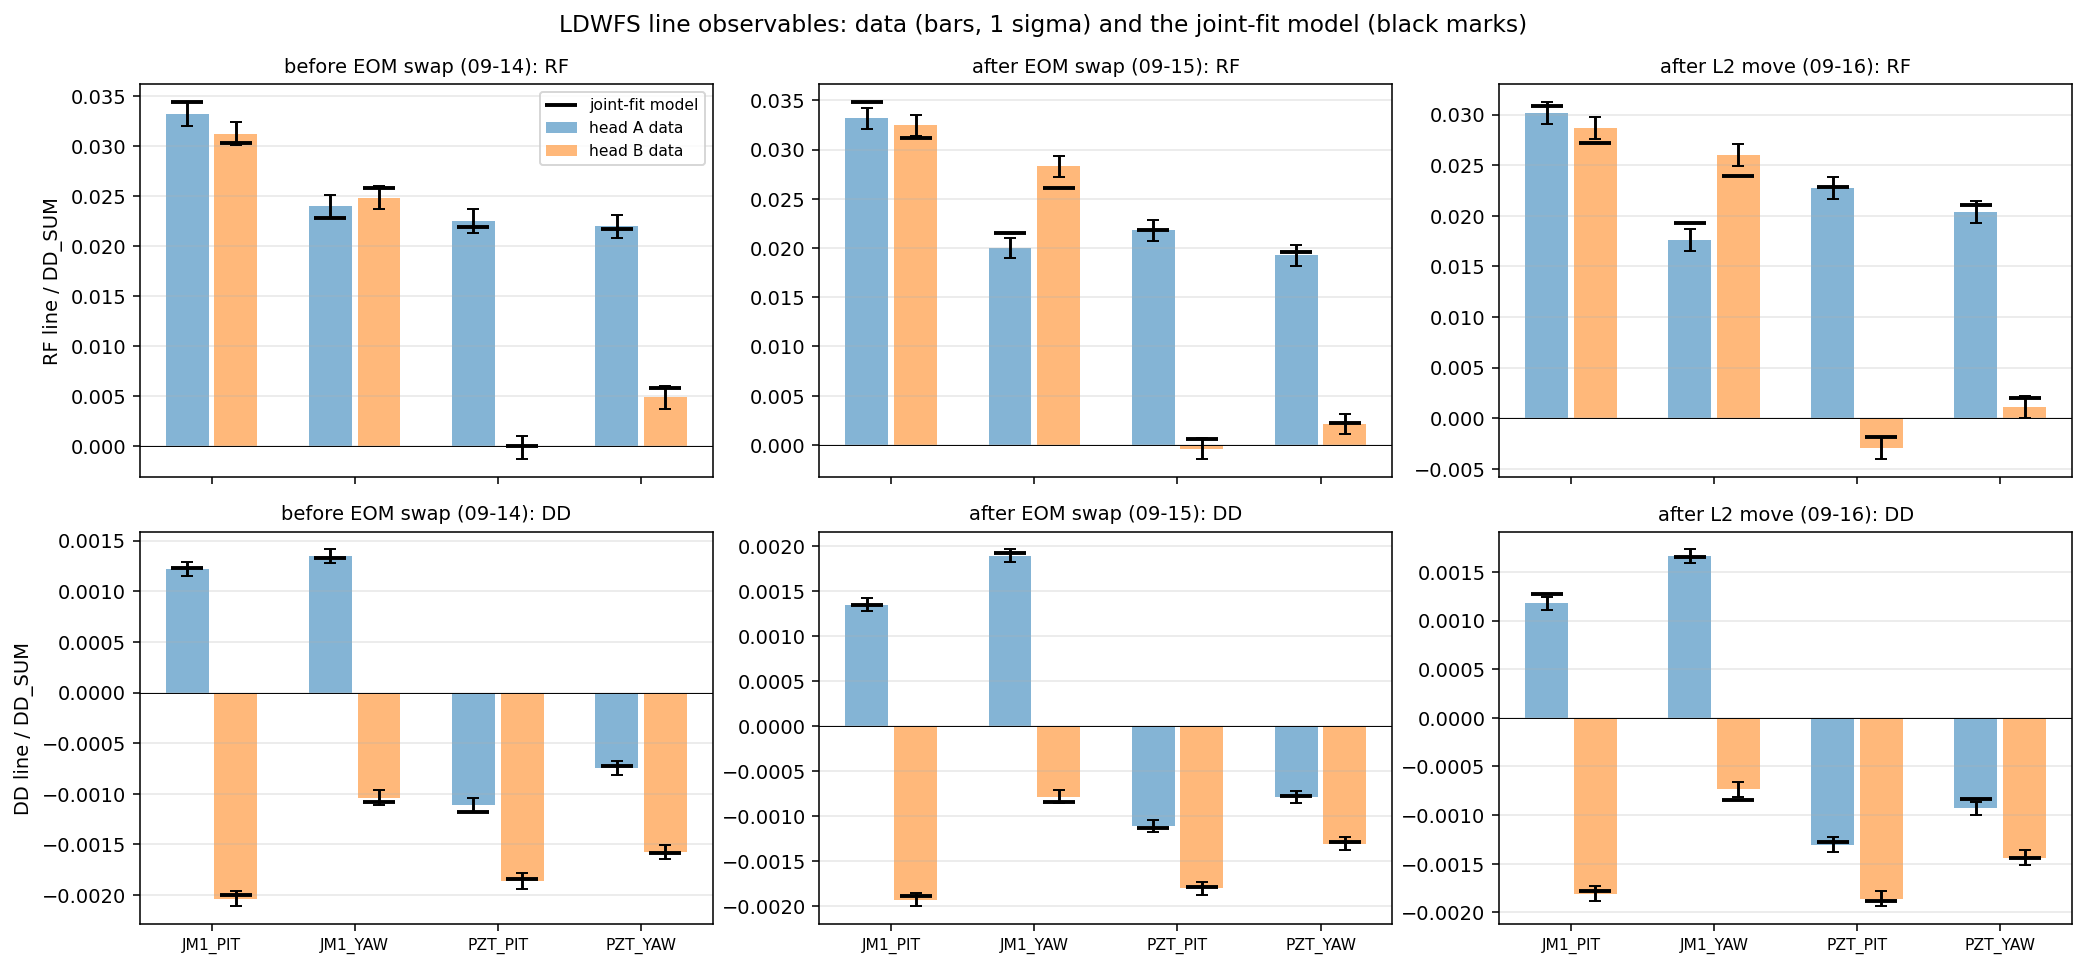
Two angular actuators are dithered, each in both planes, at separate frequencies: JM1 at 9.7 Hz (PIT) and 11.3 Hz (YAW), the injection PZT mirror at 13.1 Hz (PIT) and 14.9 Hz (YAW). A length dither is applied to the JAC PZT at 809 Hz. In addition, during each record one pico motor sweeps the beam spot on one WFS head along one axis with a slow triangle wave (fundamental about 1.5 Hz), cycling through the four head/axis combinations over the series.
The recorded channels are the WFS quadrant I/Q outputs of both heads (H1:JAC-WFS_{A,B}_{I,Q}{1-4}_ERR_DQ). Offline, the amplitude of each angular line is read in the WFS signal (RF) and in the WFS signal demodulated once more at 809 Hz (DD: double demodulation), each normalized by the head's DD sum: 2 actuators × 2 planes × 2 heads × (RF, DD) = 16 line observables per data set.
The pico sweep adds, for each head/axis combination, the ratio RF/DD of the head's response to the spot motion. Being a ratio it needs no pico calibration, and it is a direct mode-mismatch observable: it measures the c2 content (together with the detuning x0) as seen at that head (4 observables). Each data set thus contributes 20 observables.
Analysis
- Step 1, coarse fit with the paper's analytic formulas. Fitting parameters are WFS Gouy phases, c2 per plane, line amplitudes, and actuator gouy phases. It gives |c20| / |c02| = 0.093/0.055, 0.109/0.041, 0.073/0.044 for each datasets. The mismatch is 1.2 / 1.4 / 0.7 % which are quite small comparing to the predictions from the REFL DC PD. The current lens position was computed from this calculation, which is not as good as I expected.
- Step 2, Finesse fit seeded from step 1. The model consists of the three IO_MB lenses, the PZT and JM1 mirrors, the four-mirror of the JAC, the REFL lens (JACR_L1), the REFL BS, the two pico mirrors and the two WFS heads.
- Fit parameters: (1) injected beam per data set (dw and dz in each plane), (2) the angular excitation amplitudes for JM1 and PZT, (3) the dither depth, (4) x0 (static detuning of the cavity), (5) the WFS Gouy phases, represented by a curvature on each pico mirror in each plane (four numbers), which also carries the REFL-path astigmatism.
- Joint fit: (5) is shared by the three data sets, (1) and (4) are per data set (pre-post EOM swap and after lens adjustment); 60 observables, 19 parameters, 42 dof. The single-set fits and the joint fit:
| before EOM swap | after EOM swap | after L2 move | |
|---|---|---|---|
| head Gouy phase, WFS A / B, PIT (shared) | 124.8 ± 0.7° / 189.1 ± 0.9° | ||
| head Gouy phase, WFS A / B, YAW (shared) | 112.7 ± 0.7° / 173.9 ± 1.1° | ||
| mismatch power (Finesse) | 1.8 % | 5.8 % | 4.5 % |
All parameters, errors and the per-record fits are in the detailed analysis note (to be posted).
Why the analytic model was off
- The paper's formulas treat the RF sidebands as fully off-resonant in every spatial mode. In the JAC that is not true for the first-order modes: the round-trip Gouy phase is 100.2° (bench measurement), so the HG10/HG01 resonances sit 100.2/360 × FSR = 41.3 MHz from the carrier, only 1.7 MHz (about 1.4 cavity linewidths) from the 43 MHz modulation frequency. The first-order content of the lower sideband is therefore partially resonant, and its contribution to the angular-line signals is missing from the analytic model.
- With the mismatch small (before the EOM swap, |c2| about 0.1) the error is tolerable; after the swap (|c2| about 0.2) the analytic fit underestimates the mismatch by a factor 3–4 and its Gouy phases drift (heads by up to 8°, the PZT reference by 10–20°). This is why the earlier lens plan, derived from that model, predicted more than the move delivered.
- The Finesse model carries the sideband modes explicitly (modes up to order 10) and needs no extra parameter to reproduce the three states, the REFL PD ratio and the scans.
Lens-move reconstruction (check)
Only IO_MB_L2 (and IO_MB_L1 by 3 mm) was moved between the 09-15 and 09-16 sets. Back-propagating the fitted 09-15 beam through the injection telescope and asking which L2 displacement reproduces the fitted 09-16 beam gives 18 ± 3 mm toward L1. The survey gives the L1–L2 spacing as 60 mm before and 26.5 mm after, i.e. an L2 move of 33.5 mm, so the error is ~1.5cm. This error is bigger comparing to the quoted error, which is statistical only (from the fit χ2); lens focal-length tolerances, the optic positions (even between PSL and HAM1) and any thermal lensing are not included.
Next
- Repeat the analysis on the measured 62 W data (and the 10 / 25 W steps) with the same model; the thermal lensing between 2 and 62 W is the quantity to be fitted there.
- Derive the lens solution for 62 W from that fit. Already at 2 W the reach of the present lenses is limited: L3 can move only about 50 mm, and with L3 at that limit and L1+L2 moved together by 90 mm the mismatch would go from 4.5 % to about ~3 %. Anything better than that needs a lens change.
Figures
Figure 1: Beam radius along the injection path from the IO_MB_L3 output to the cavity, YAW (left) and PIT (right). Black: the cavity eigenmode (waist 545 / 551 µm, 4.93 m from L3). Colored: the injected beams from the joint fit for the three states. In every state the injected beam focuses before the cavity waist with a larger waist, and the two planes differ.
Figure 2: The 16 line observables per data set — RF (top) and DD (bottom) amplitudes of the four angular lines on WFS A (blue) and WFS B (orange), normalized by the DD sum — for the three states. Bars: data with 1 σ errors; black marks: the joint-fit model (one shared WFS layout, per-state injected beam and x0).