J. Kissel

As we explore the relationship between HAM3 - HAM2 differential motion with the SPI, it's forcing us to re-understand some ISI fundamentals. Brian made claims that we *shouldn't* use the ISI super sensors as metrics for the real displacement of the platform in LHO:92129, and points us to some math in T2500279. I wanted to back up the math with some plots of platform motion to help better visualize the math.

You can find plots of the current blend filters in use, in their dimensionless comparable form, from LHO:70527.
- the X/Y blend frequency is 0.18 [Hz] with broad gain peaking of around 1.5x to 2x from 0.03 - 0.6 [Hz].
- the RX/RY blend frequency is 0.375 [Hz] with more focused gain peaking of 4x from 0.1 to 1 [Hz].

Let's start with RX, since that's a relatively simple feedback loop, with no sensor correction complicating the math.
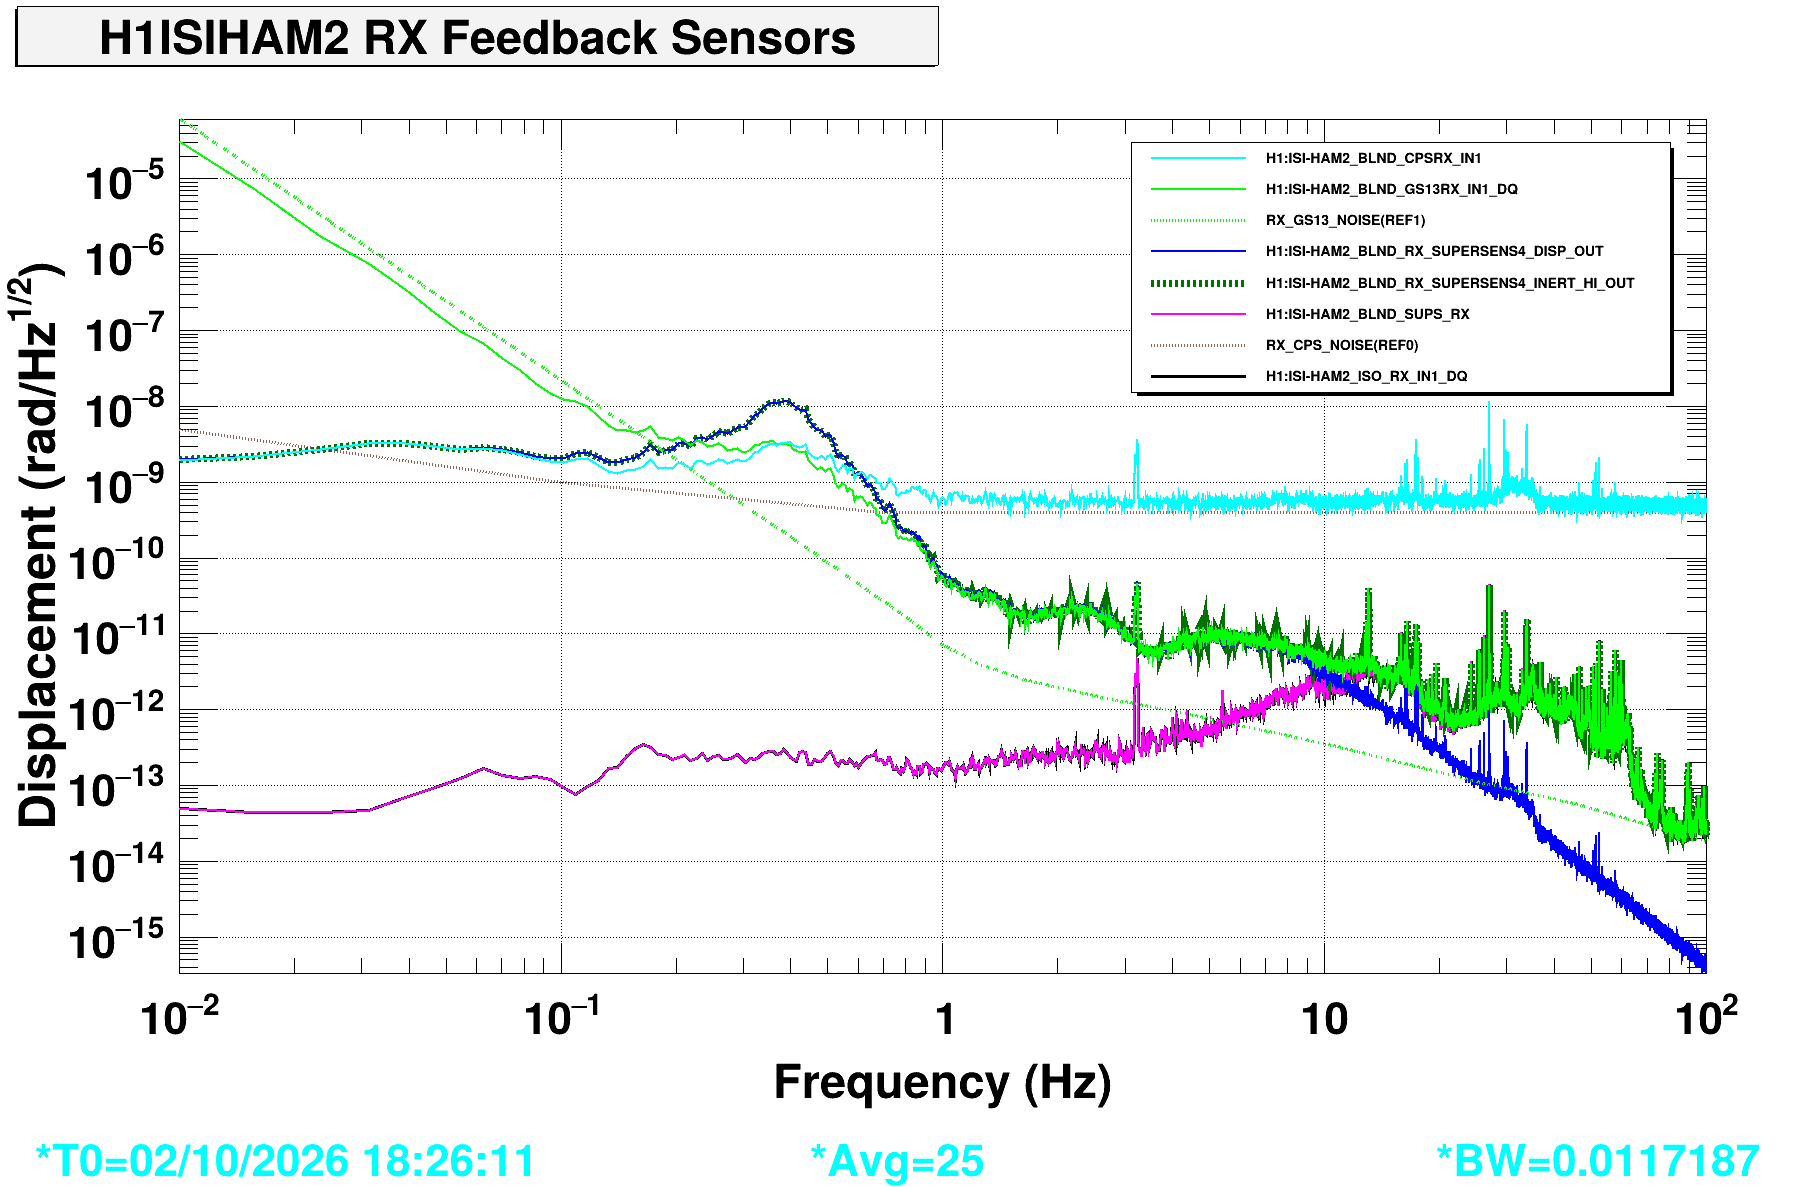
(RX-1) RX ASD (Blend Inputs vs. Blend Outputs vs. Super Sensor)
    - The input to the blend filters are shown in SOLID light blue (CPS) and green (GS13), compared with their sensor noise scaled to the RX degree of freedom (same color, just in dot-dot line style). Above ~1 Hz, the CPS is limited by its sensor noise, but also arguably below 0.1 Hz. Below 0.15 Hz, the GS13 is limited by its sensor noise. This implies that
    - As we apply the blend filters to those input signals, we see what Brian describes in Section 2 of his document:
        . There's a hefty amount of gain peaking between 0.1 and 1 Hz [Hz] from the complementary blends, reporting a factor of ~4x more motion than at the input.
        . The CPS output is virtually identical in amplitude to the GS13 output up to 10 Hz.
        . The sum of the two blended outputs is "essentially zero" -- this is what we strive to understand.
    - There two channels, H1:ISI-HAM2_BLND_RX_FADE_OUT and then H1:ISI-HAM2_BLND_SUPS_RX -- test points in series just after the sum -- and just downstream's H1:ISI-HAM2_ISO_RX_IN1 that are equivalent and identical.
    These two test points being identical to the ISO input is only true for DOFs where there's no input from the SUSINF external "sensor correction," either SUS offloading or CPS DIFF or SPI, as is true for the RX DOF -- knowing this will become important for DOFs that employ, e.g. CPS DIFF like the X DOF. I show the SUPS_RX and ISO_RX_IN1 channels here just confirm that there's nothing wild or crazy going on like "the signal changes as you exit up and out of a level in the simulink model," and to show that there's no external input from SUSINF.

(RX-2) RX TF COH (Blend Outputs vs. Super Sensor)
    - This shows the linear coherence between each output to the blends and the super sensor.
    - assertion The CPS output's coherence is only non-zero where the CPS are actually measuring real platform motion where that signal appears above the sensor noise, between 0.1 and ~1 Hz.
    - The coherence of the GS13 output matches the coherence of the CPS below 10 Hz. assertion That implies that the GS13s are measuring the exact same thing as the CPS in this frequency region, whether it be real platform motion, or CPS sensor noise * the blend CPS filter.

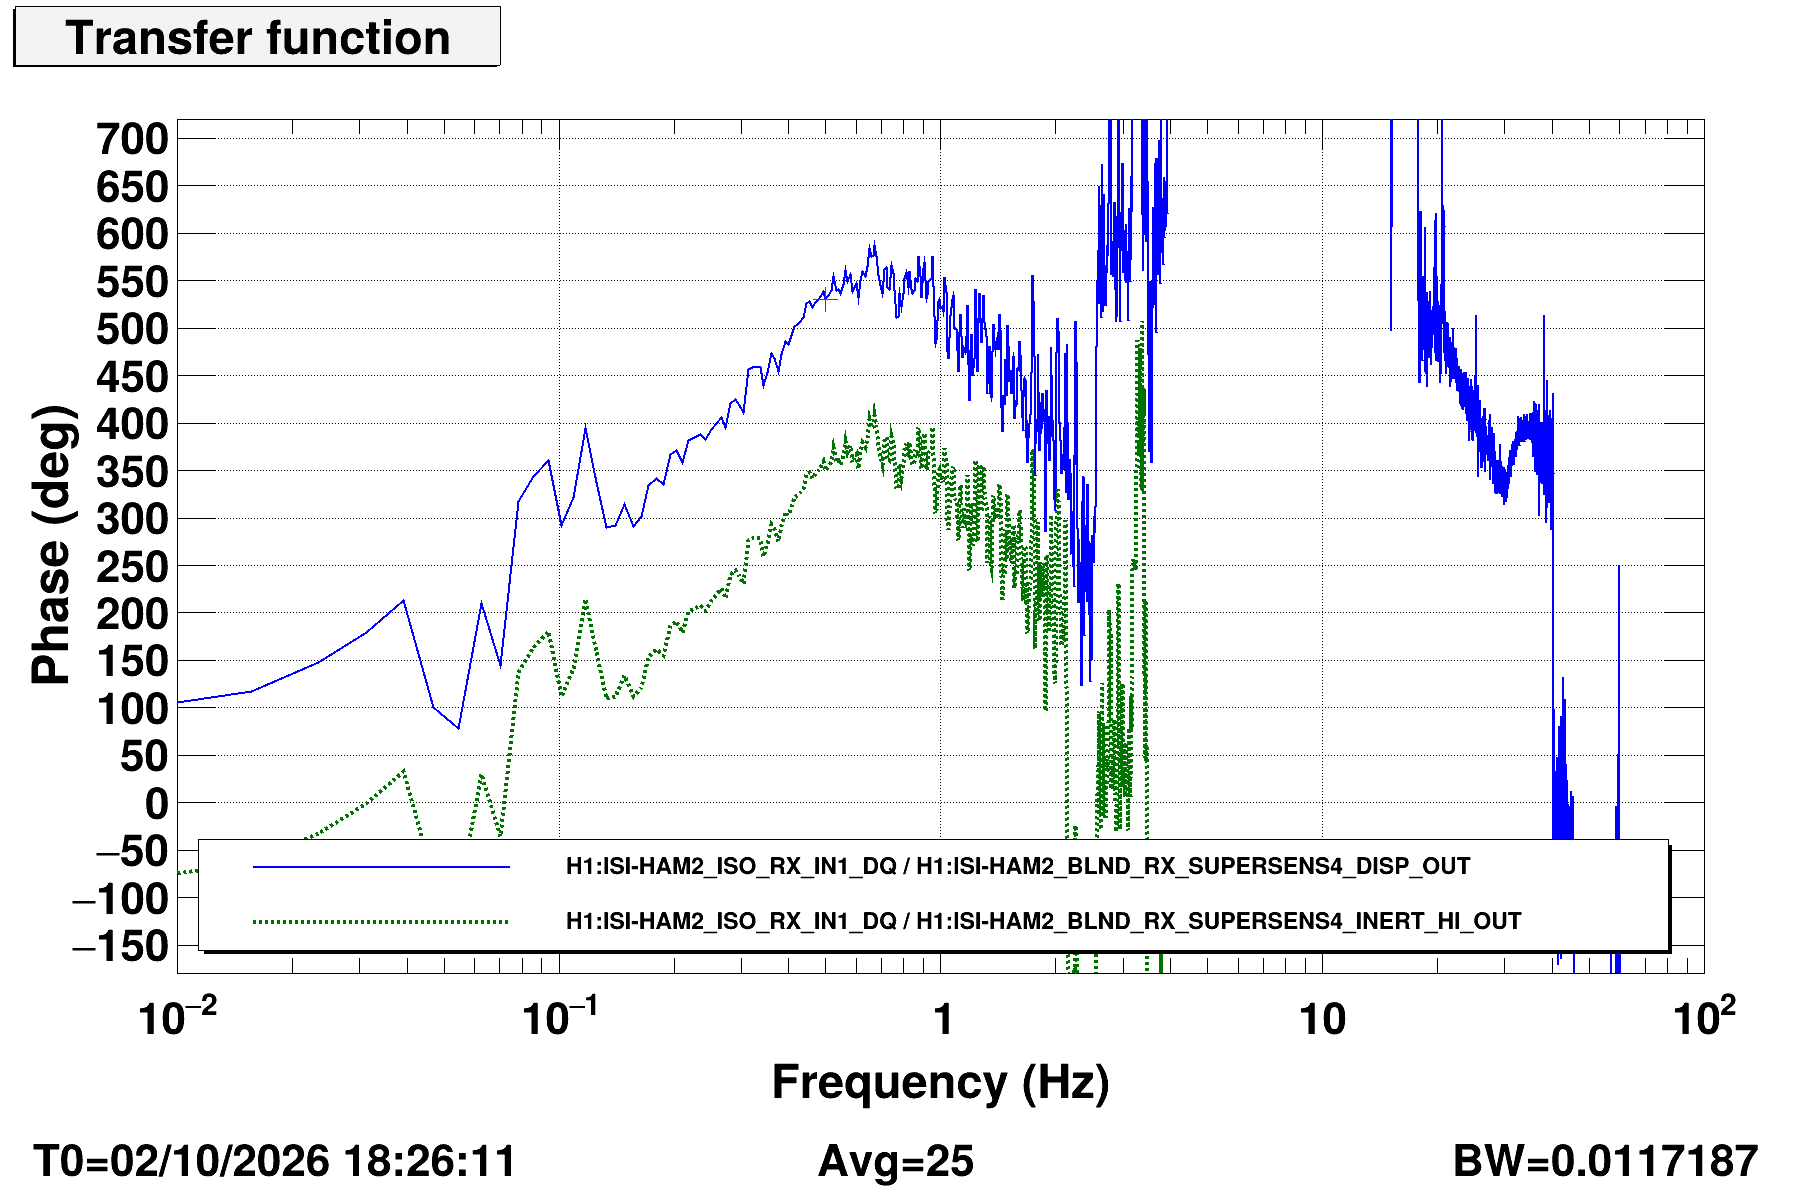
(RX-3) RX TF PHA(Blend Outputs vs. Super Sensor)
    - This shows the (unwrapped) phase of the TF between the CPS blended output and the GS13 blended output w.r.t. the super sensor.
    - At least below ~3 Hz [Hz] it's obvious that the blended output of the CPS is exactly 180 [deg] out of phase with the blended output of the GS13
        Spot check of RX TF Phase at 0.5 [Hz]
            DISP OUT / SS       = 529.8 [deg]
            INERT OUT / SS      = 349.8 [deg]
            Difference          = 180 [deg]
      One can only trust the spot check at most frequencies if the blend filters are truly complementary. If they're not, then you've gotta be conscious of the "deviation from complementary" in the comparison. This will become important for DOFs where we push hard on the performance, like the X DOF.
    - Thus, the two signals, measuring exactly the same thing with the same amplitude below ~10 Hz, and when added together, given their phase relationship, you get a super sensor signal that's "essentially zero."

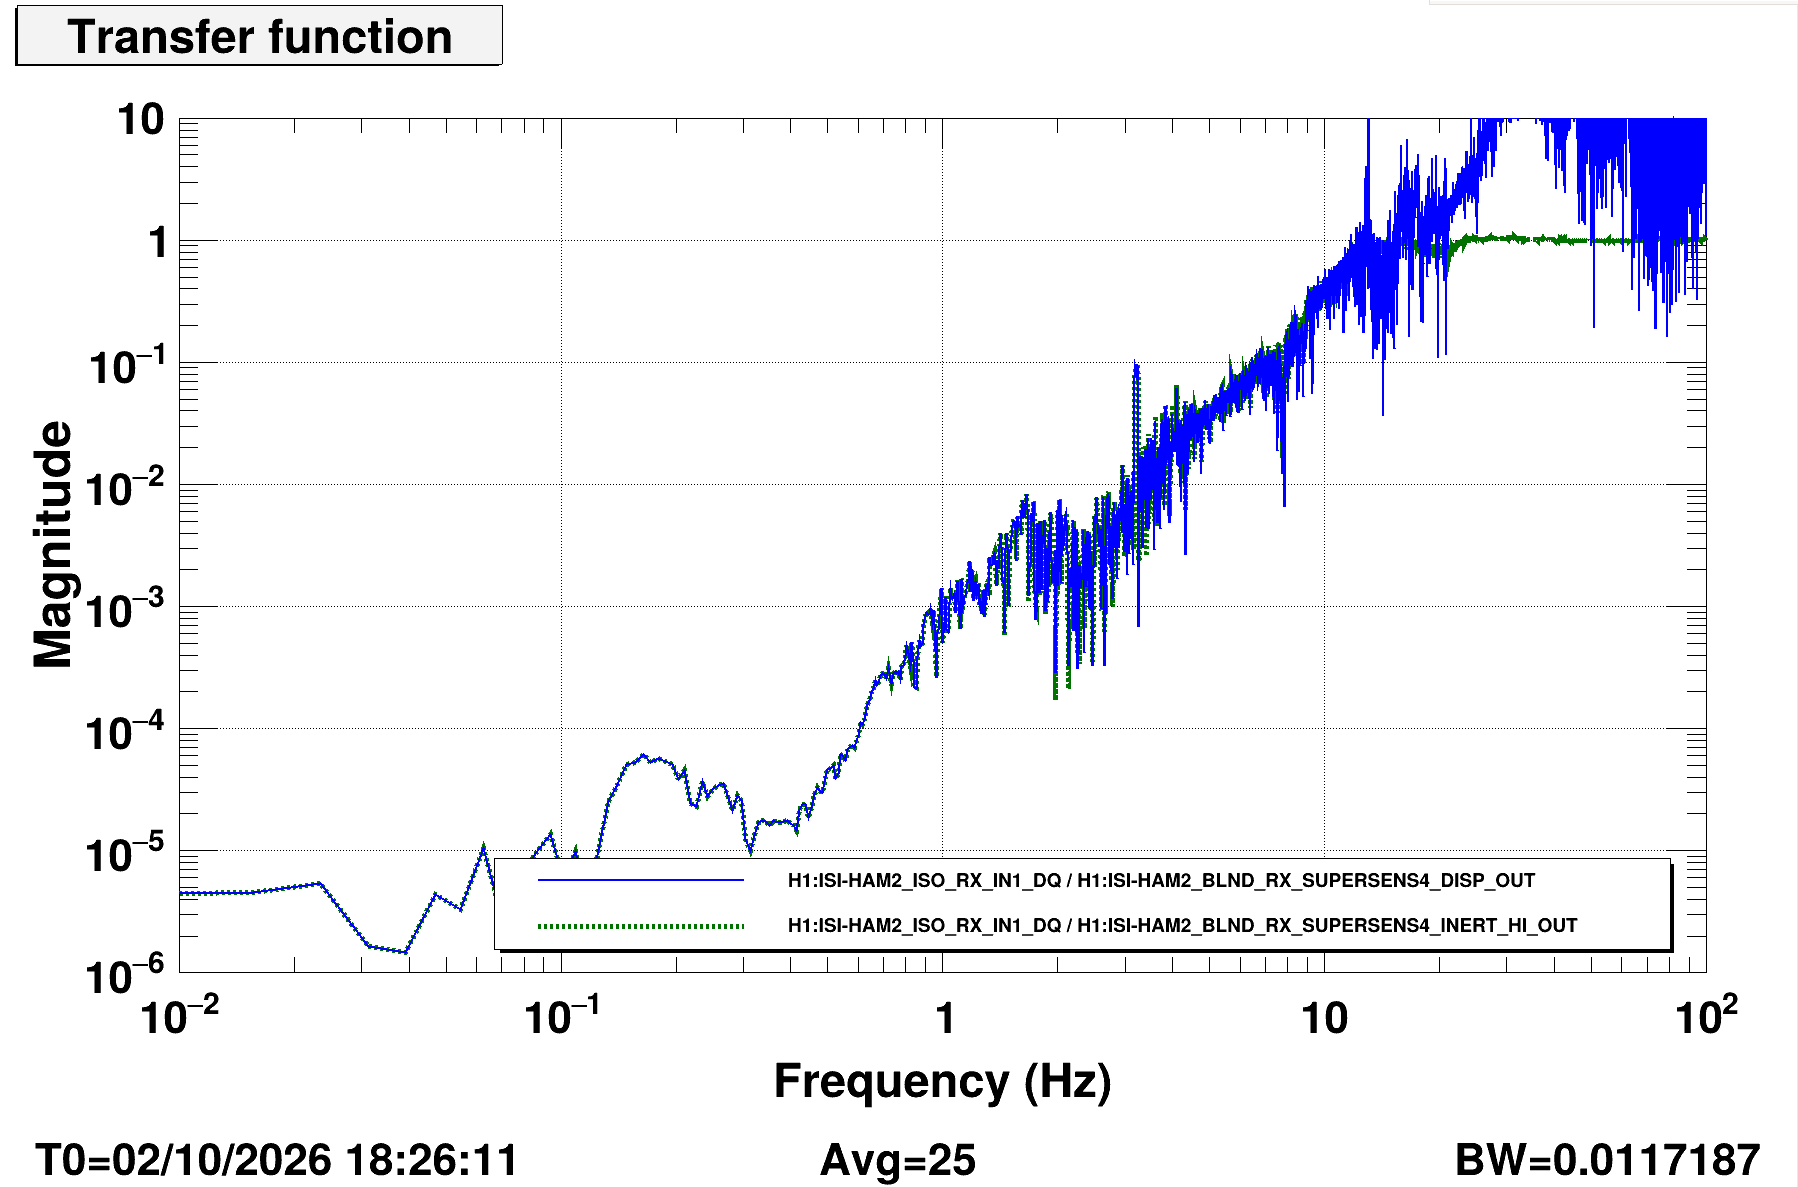
(RX-4) RX TF MAG (Blend Outputs vs. Super Sensor)
    - This shows magnitude of the TF between the CPS blended output and the GS13 blended output w.r.t. the super sensor.
    - Again, below ~10 [Hz], the GS13 and CPS blended outputs has the same transfer function magntiude w.r.t. the super sensor.
    - This -- especially is essentially a measure of the loop suppression
    - assertion where the TF is incoherent, the TF magnitudes loop suppression is reporting that the platform motion is dominated by suppressing sensor noise. In the case of the GS13s, its an independent measure of this loop-suppressed CPS noise that's dominating the platform motion.

thanks Jeff
Here's a slightly different plot which shows the same thing. This is for H1-HAM2, RX direction at a different time.
These are pg 6 and 7 of fig_excess_tilt_H1HAM2_1420509618.pdf
in https://alog.ligo-la.caltech.edu/SEI/index.php?callRep=2540
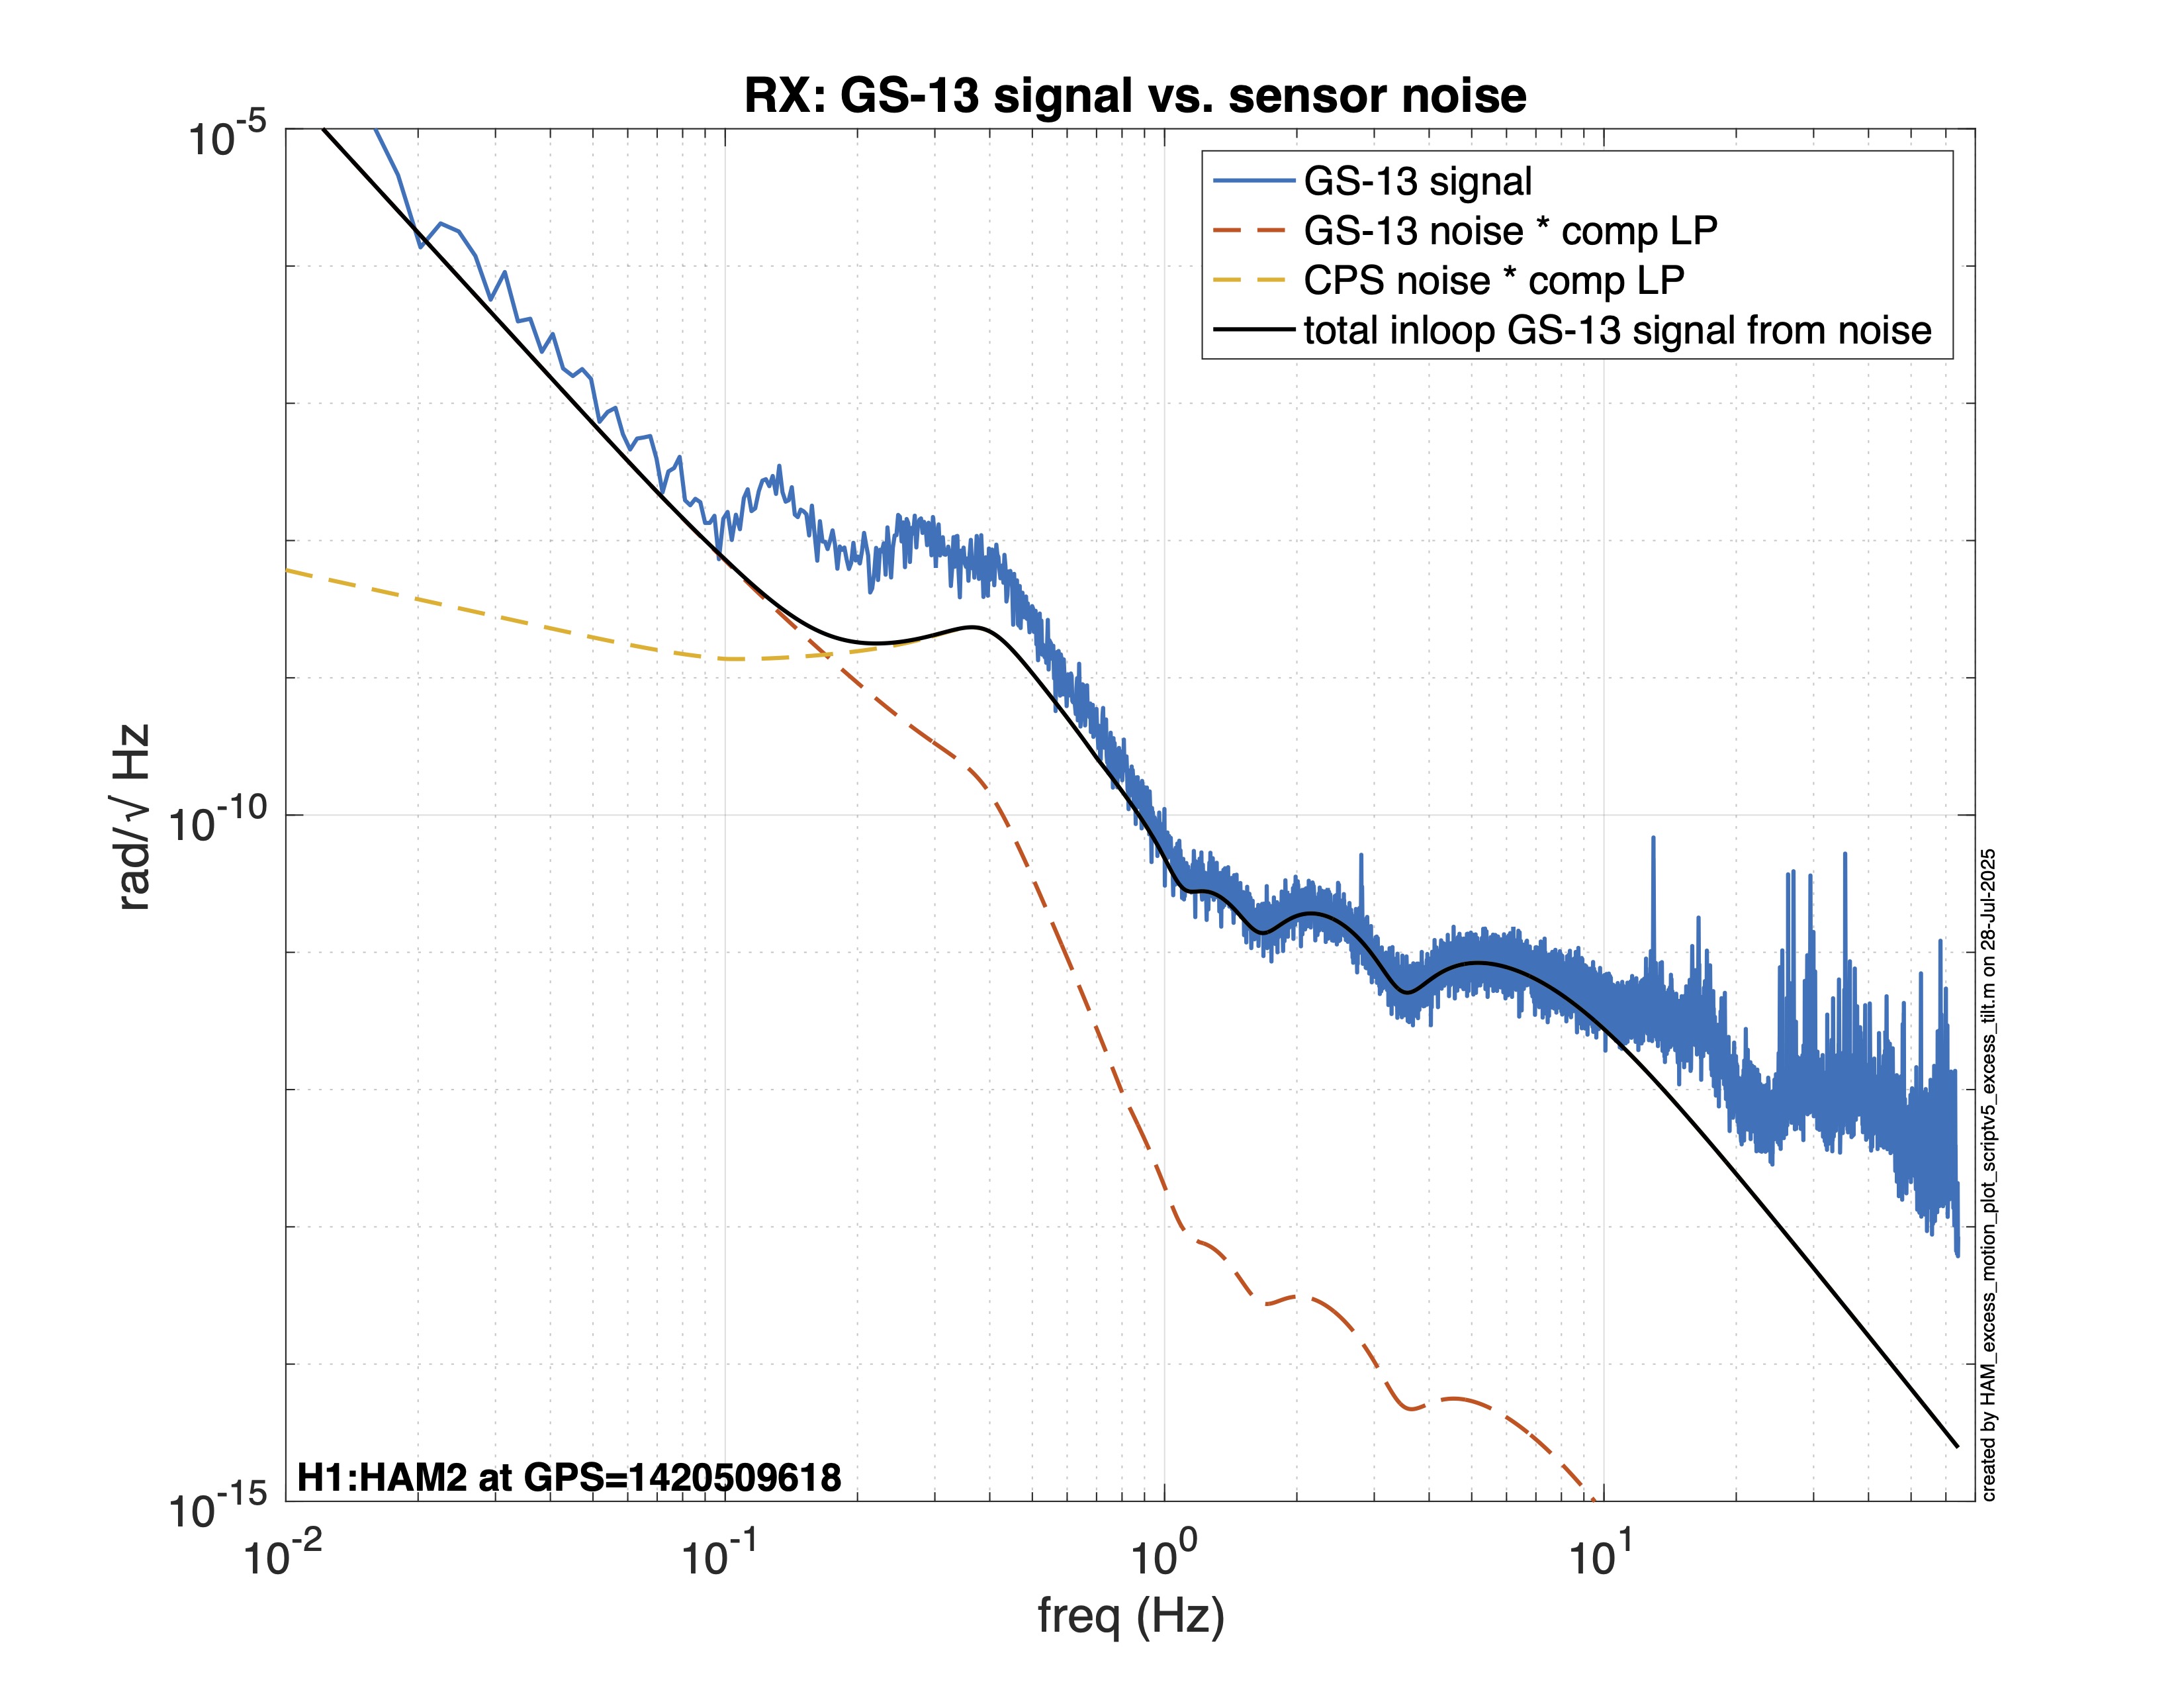
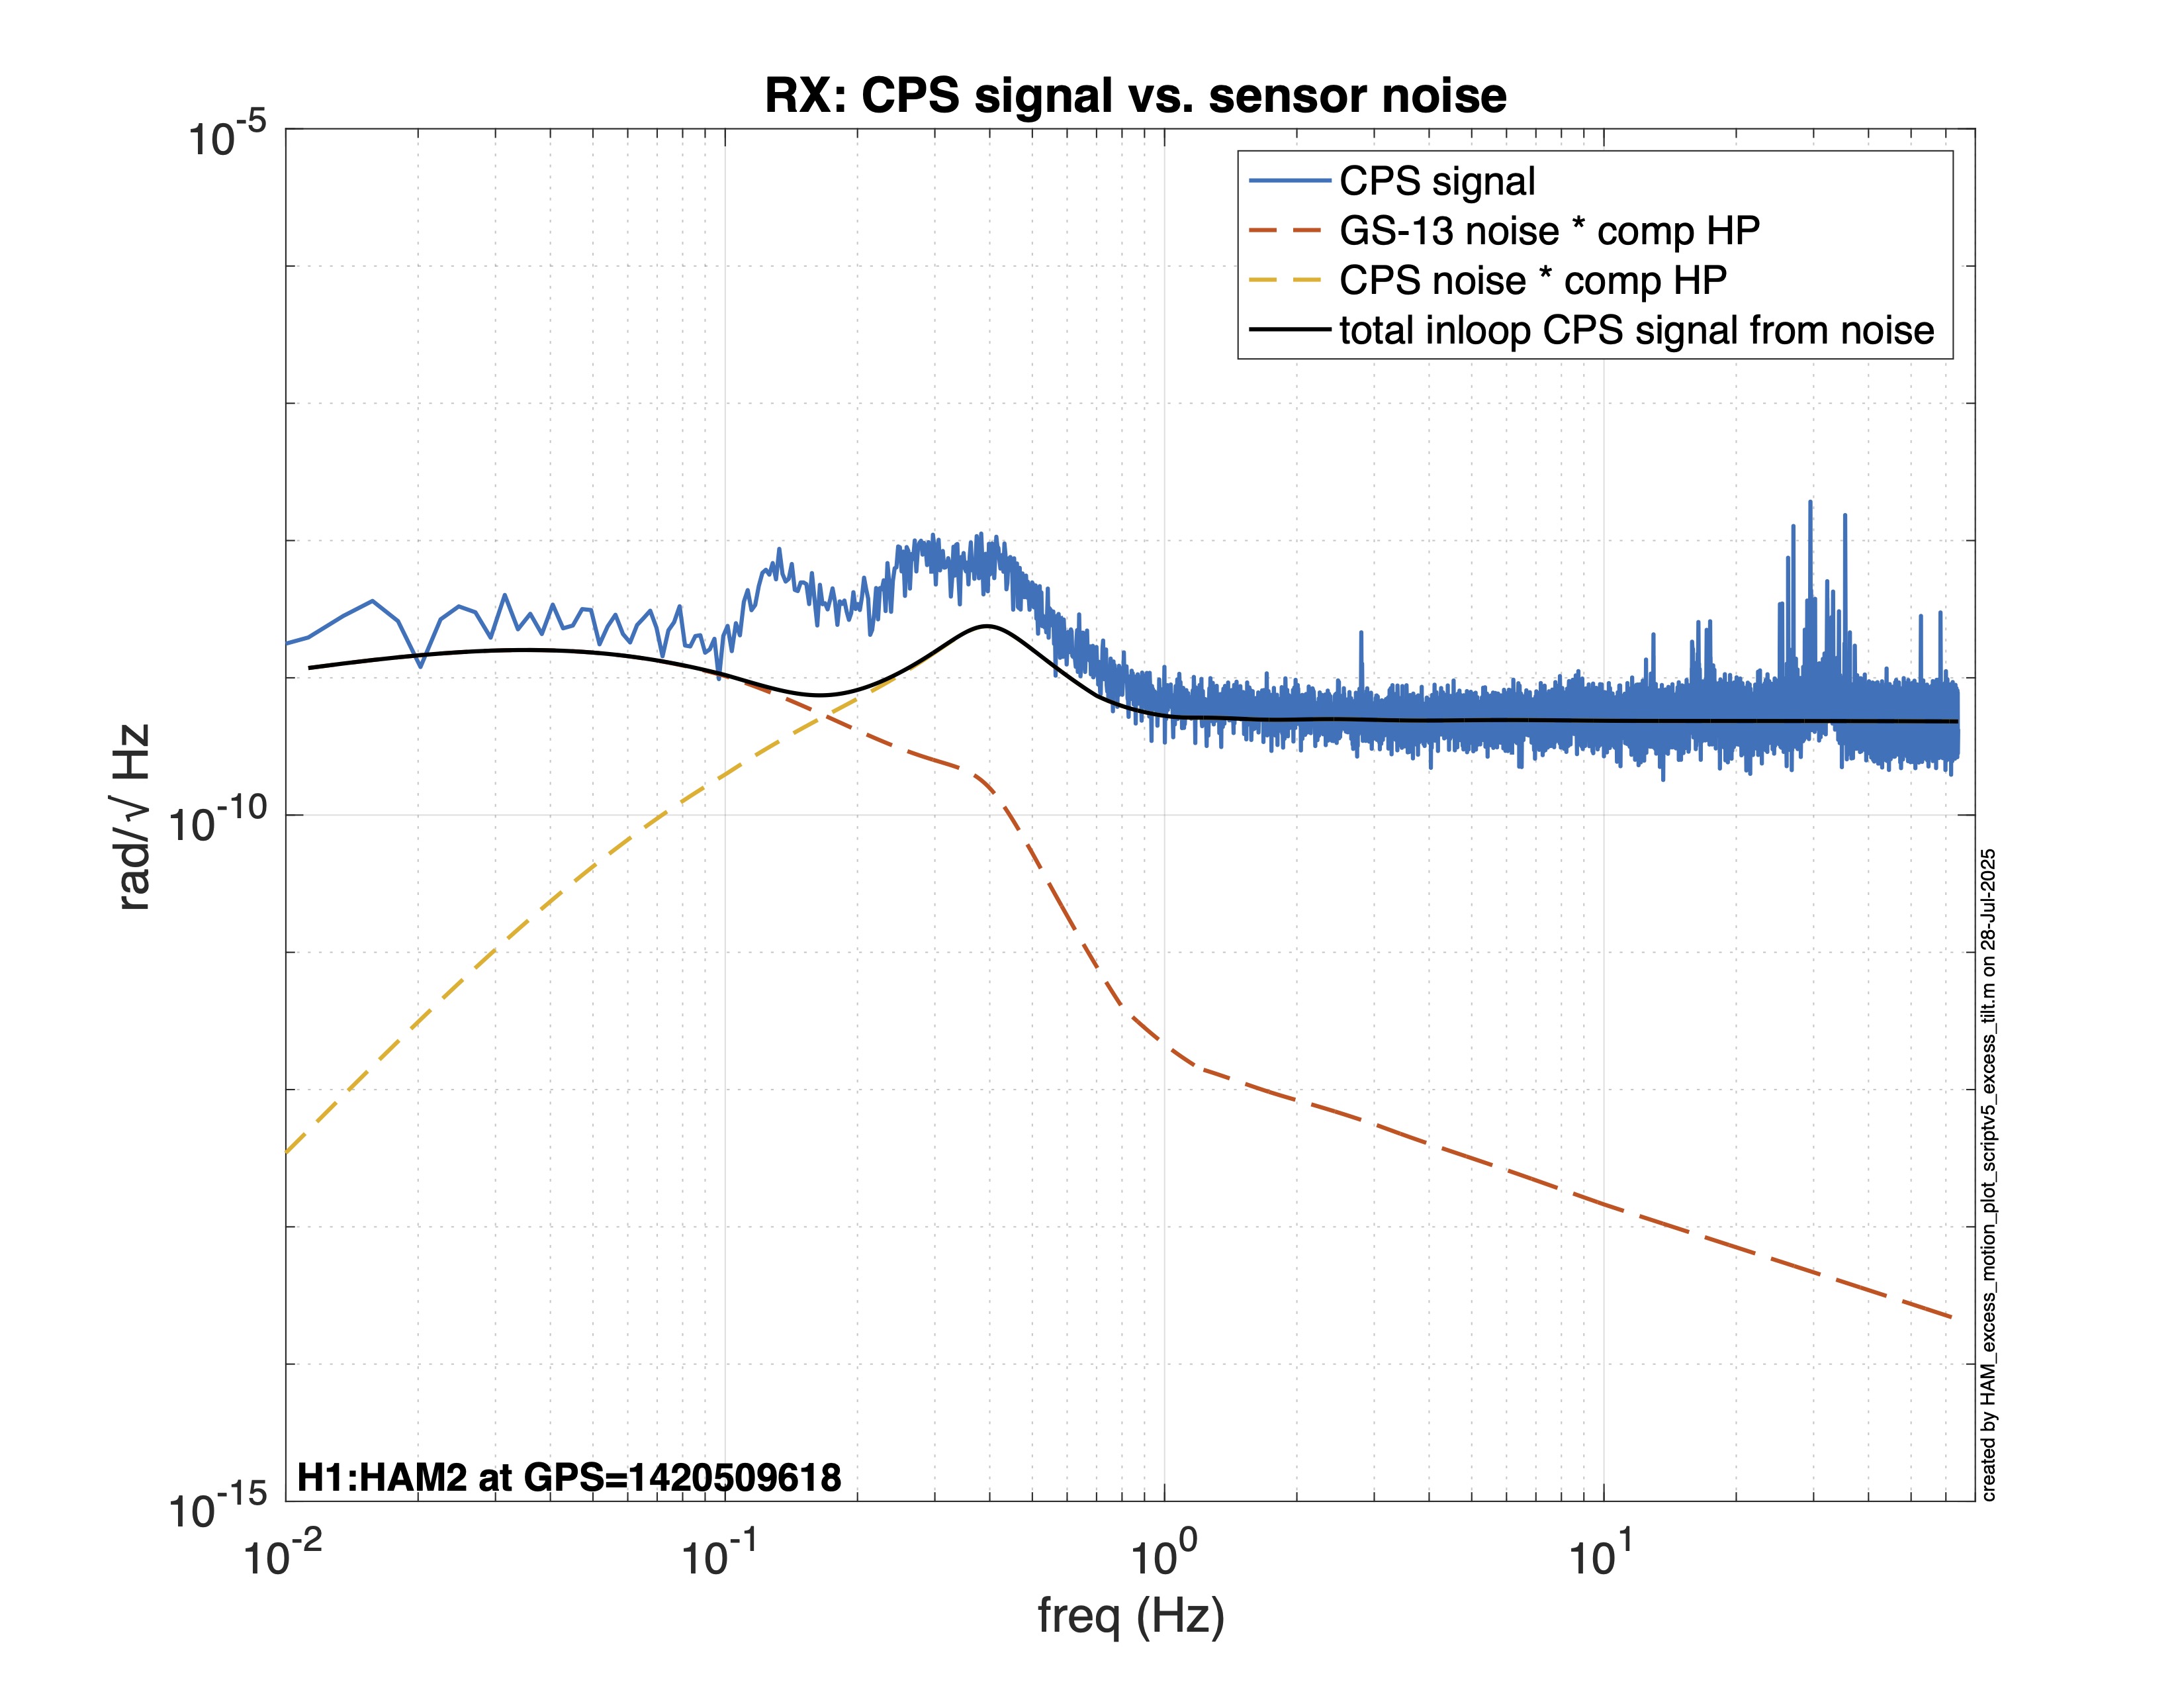
The point of that log is somewhat different (there is excess tilt motion at the microseism), but these 2 plots are useful to help visualize what's going on when you are running a loop dominated by the sensor noise OF the OTHER SENSOR in the blend.
These show the in-loop signals from the CPS and GS-13 (calibrated, in-loop signals in the cartesian basis)
First plot is the GS-13. Above 1 Hz, the signal in the GS-13 sensor is completely predicted by the readout noise of the CPS. Why? Even though the CPS is agressively blended away, the noise is still quite large and it dominates the supersensor. The control for RX drives the table to cancel the noise, but that cps-driven table motion is large enough that the GS-13 can easily measure it. That T2500279 document steps through the math - but the answer is not complex:
Above 1 Hz the table is moving like the (-1) * CPS noise * the CPS lowpass blend filter.
Above 1 Hz the table motion is large enough that the GS-13 can easily measure it. I've attached the GS-13 signal and the CPS signal
Below 1 hz the story is more complex, but sensor noise (probably in the form of cross coupling from Z to both the CPS and the GS-13 tilt signals) dominates.
Below 0.1 Hz the filtered GS13 and the CPS are similar, so I you need a bit more care - see figure 3.
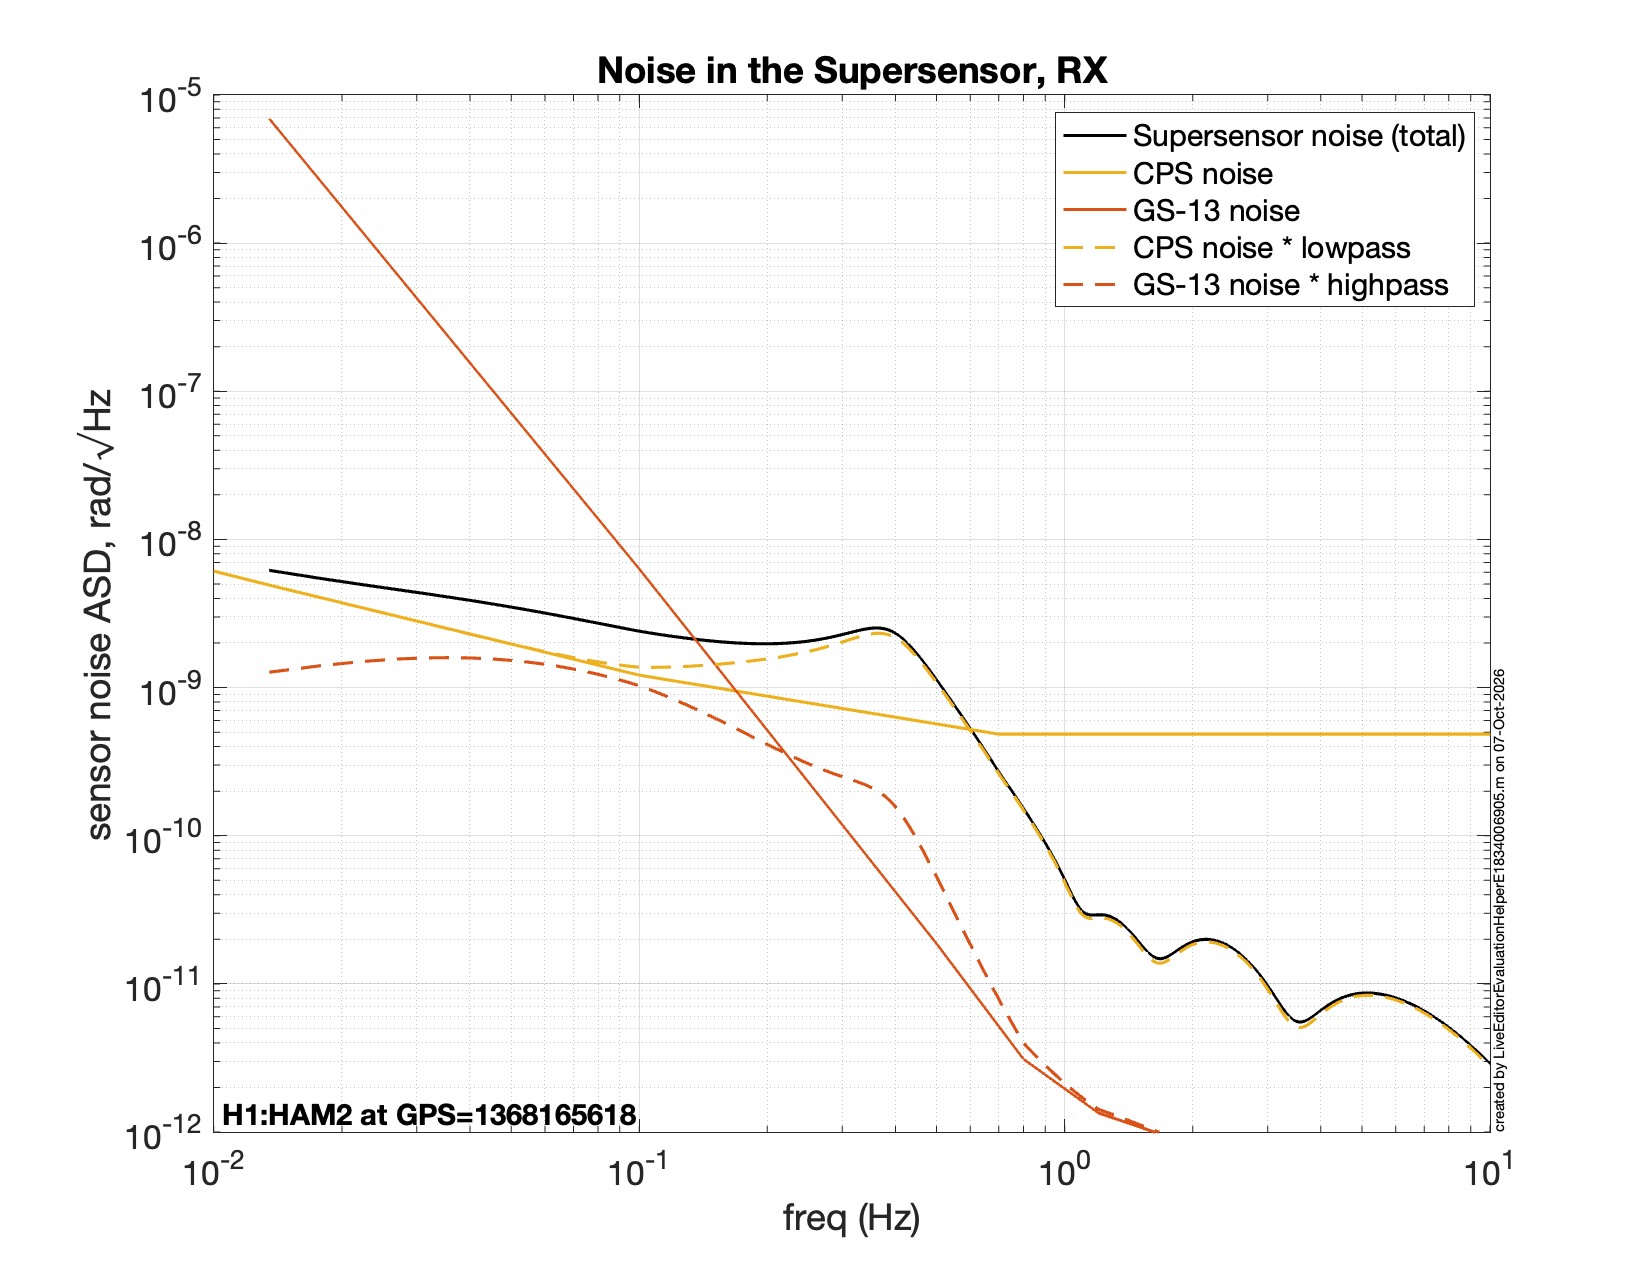
plot 3: To see the "readout" noise comparison, look here. This is the noise of the super-sensor for RX (with coarse CPS). The dashed line are the CART based sensor noise after the blend, and the black is the (incorrent) sum. The noises are quite similar below 0.1 Hz. Wen the loop is running, the table motion should be approximately -1 * supersensor noise at that moment, ie the table motion should have the same black motion spectrum.
Above about 0.2 Hz, the black "table motion = supersensor noise" is well above the GS-13 readout noise, so the GS-13 should be a good monitor. If the actual GS-13 noise is larger, e.g. from cross-coupled Z motion, then this will not be true. If the CPS noise is larger, e.g. because of cross-coupled z motion to the CPS tilt readout, then the GS-13 will be a good monitor. (note - We have seen this in some of the plots for the SPI readout - where it matches the GS-13 but not the CPS at 0.2 Hz)
If the table actually matches the black line below 0.1 Hz, then neither sensor is a reliable readout.
You can't see the total motion in the GS-13 readout because the GS-13 noise is >> than the motion, and at the readout you see GS-13 noise * lowpass, and the lowpass = 1 down here. All you can see is the GS-13 noise.
You can't see the motion in the CPS either. The motion is driven by the CPS noise, but the CPS noise-driven-motion and the CPS noise ~ cancel in the CPS readout below 0.1 Hz, so you can't see that motion. You can see the motion driven by the GS-13, but that's only part of the motion. Sina's look at the coherence is a useful tool here - it shows the in-loop supersensor residuals are correlated with the CPS readout, which you really can't deduce just looking at the spectra.