Hugo, Sheila
Having heard that at Livinstgon ISC is seeing about one fringe per second (need to confirm this is for green, not infared) (also see LLO alog 10404), while here we see more like 10 fringes per second with the green, we wanted to investigate the motion of the optics. Laser frequency noise is something that should also be ruled out, although it seems unlikely since the frequency of the motion we see is around (roughly) 0.1Hz. We wanted to compare the SEI/ SUS platform motion between the two sites. To do so, we compared thefollowing:
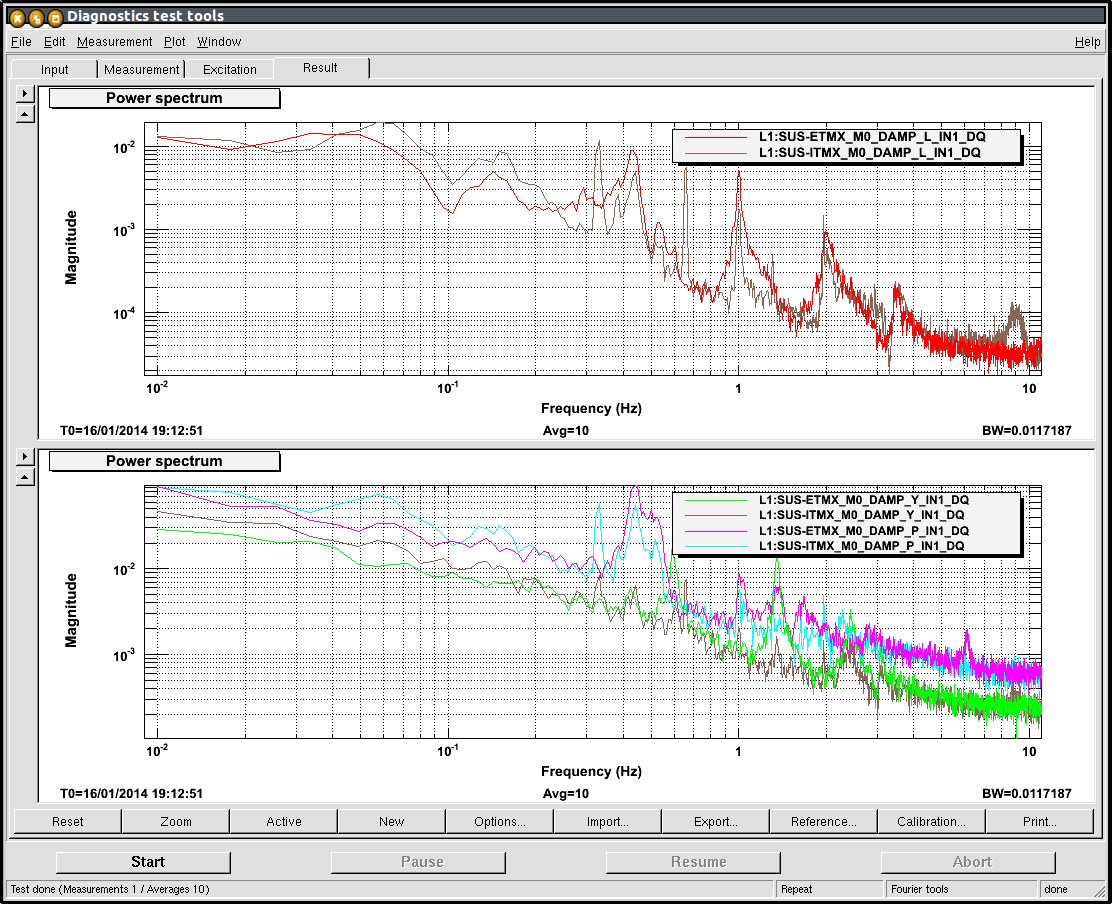
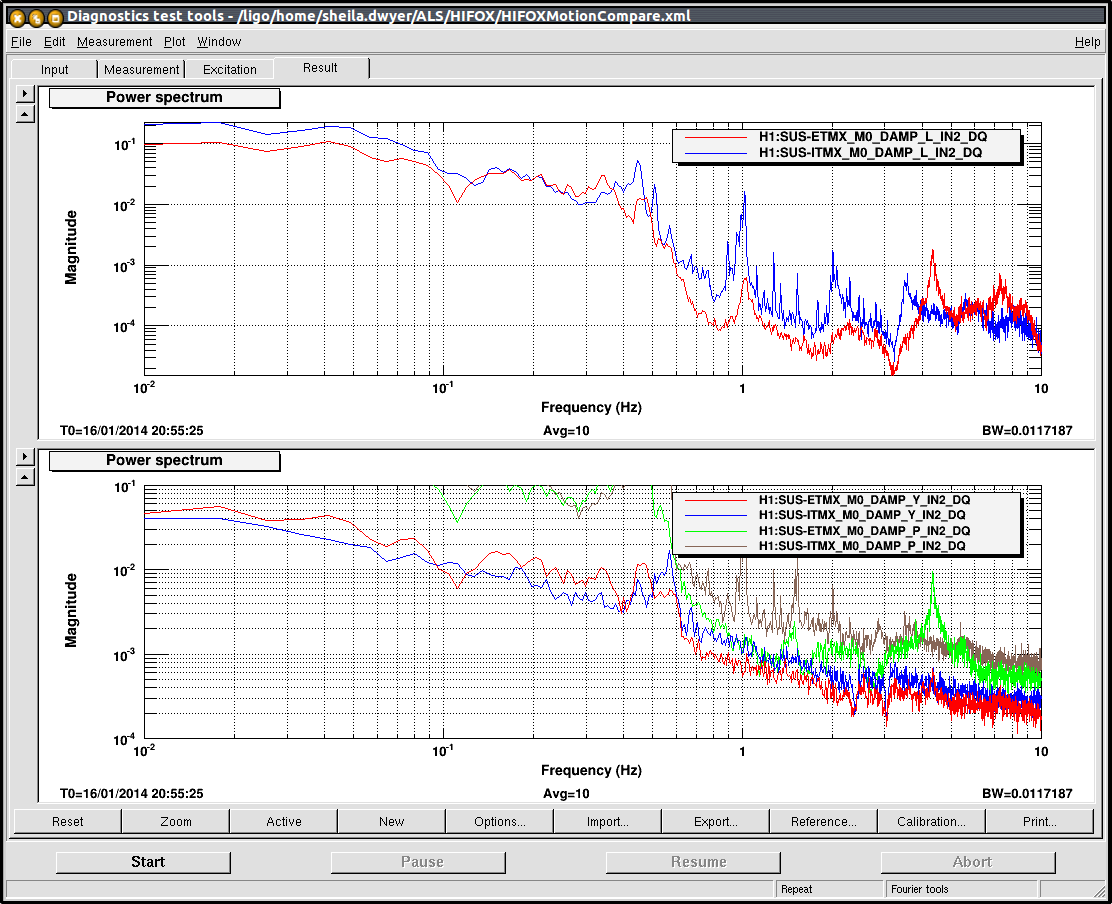
- motion of the top mass (M0) of ITMX and ETMX (LLO, LHO)
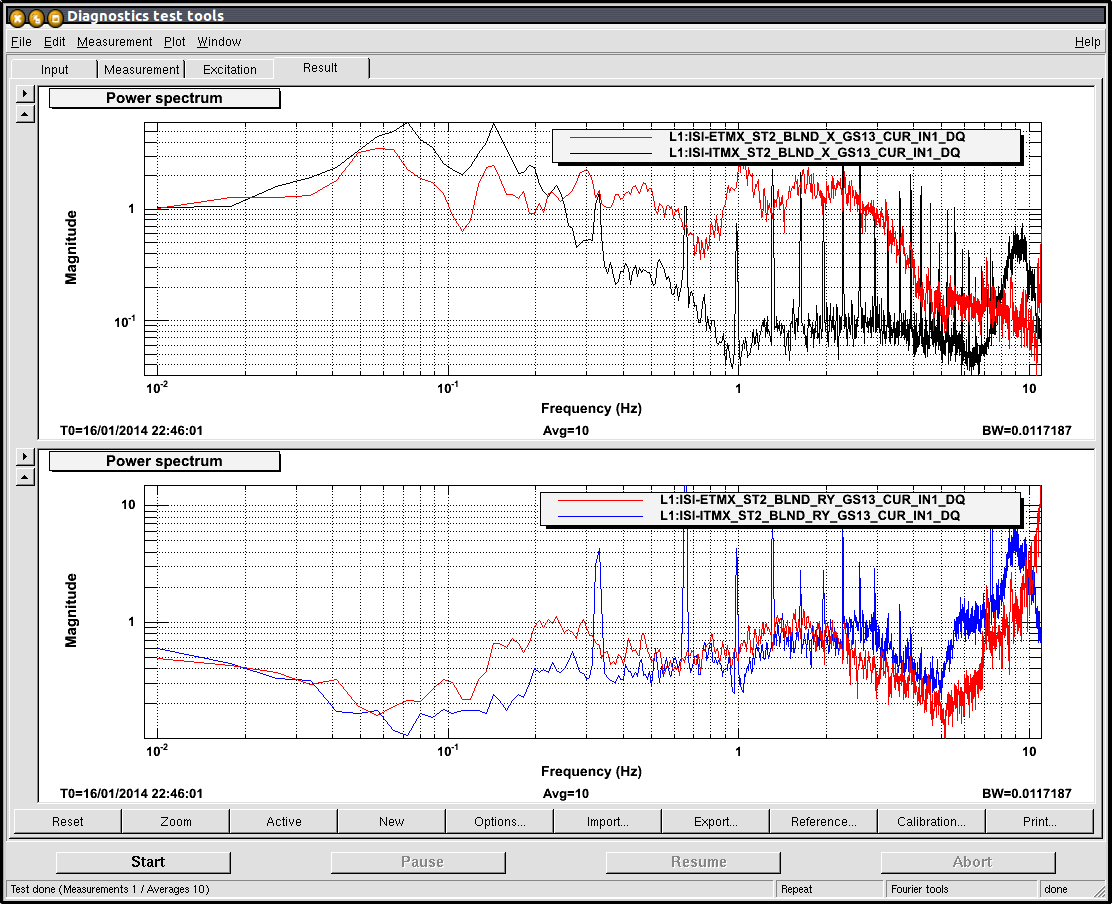
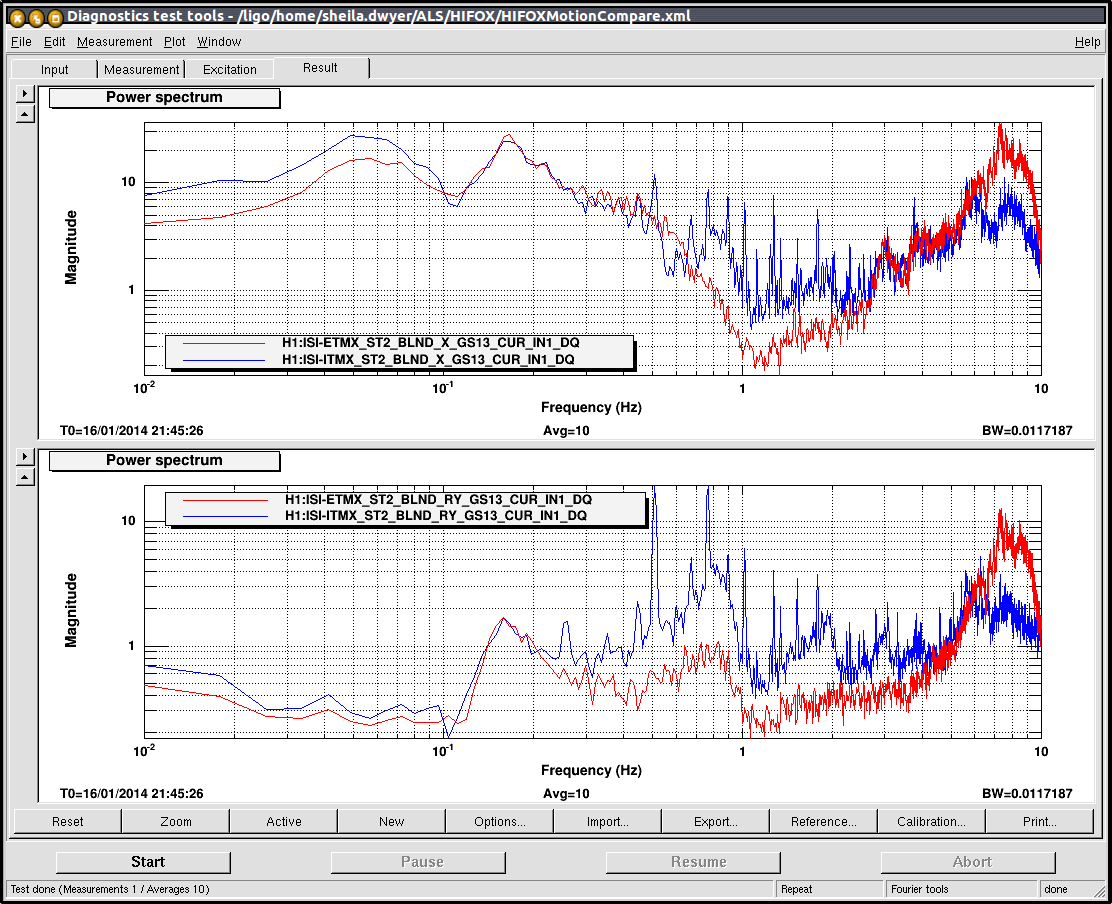
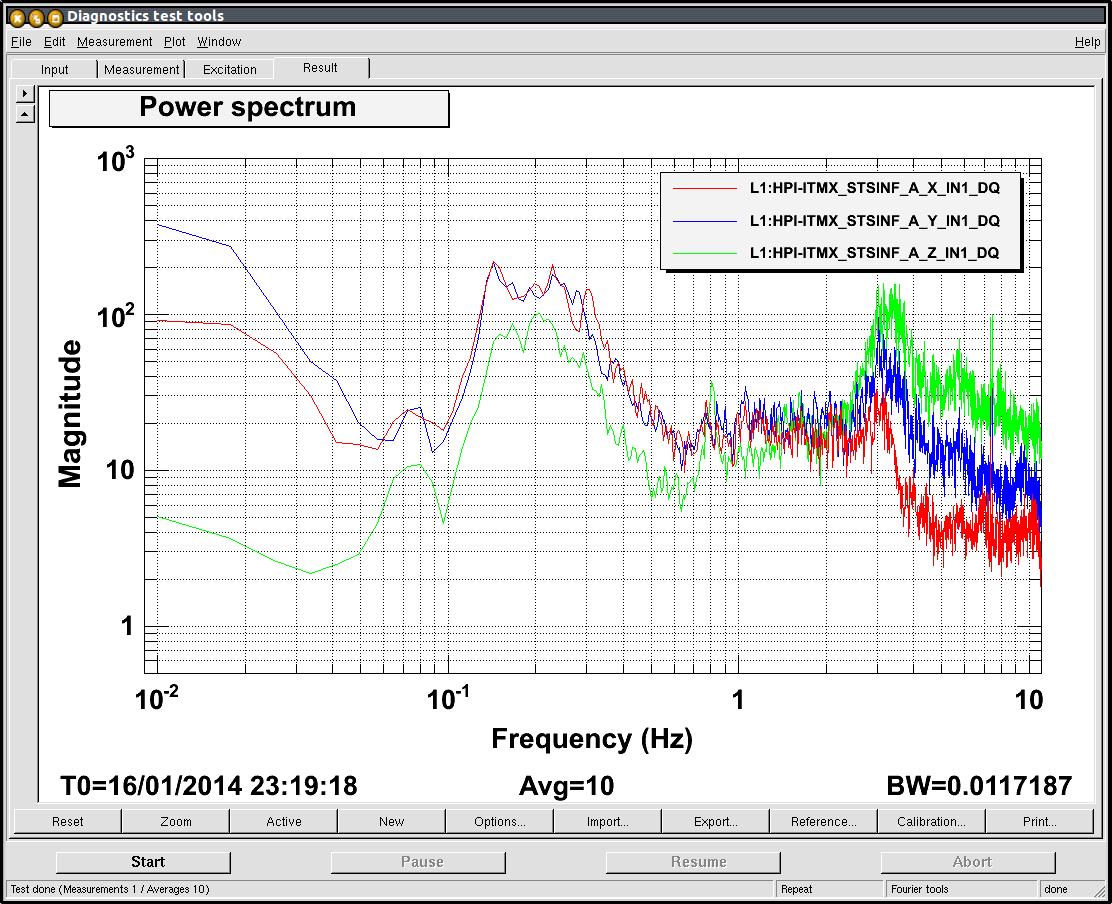
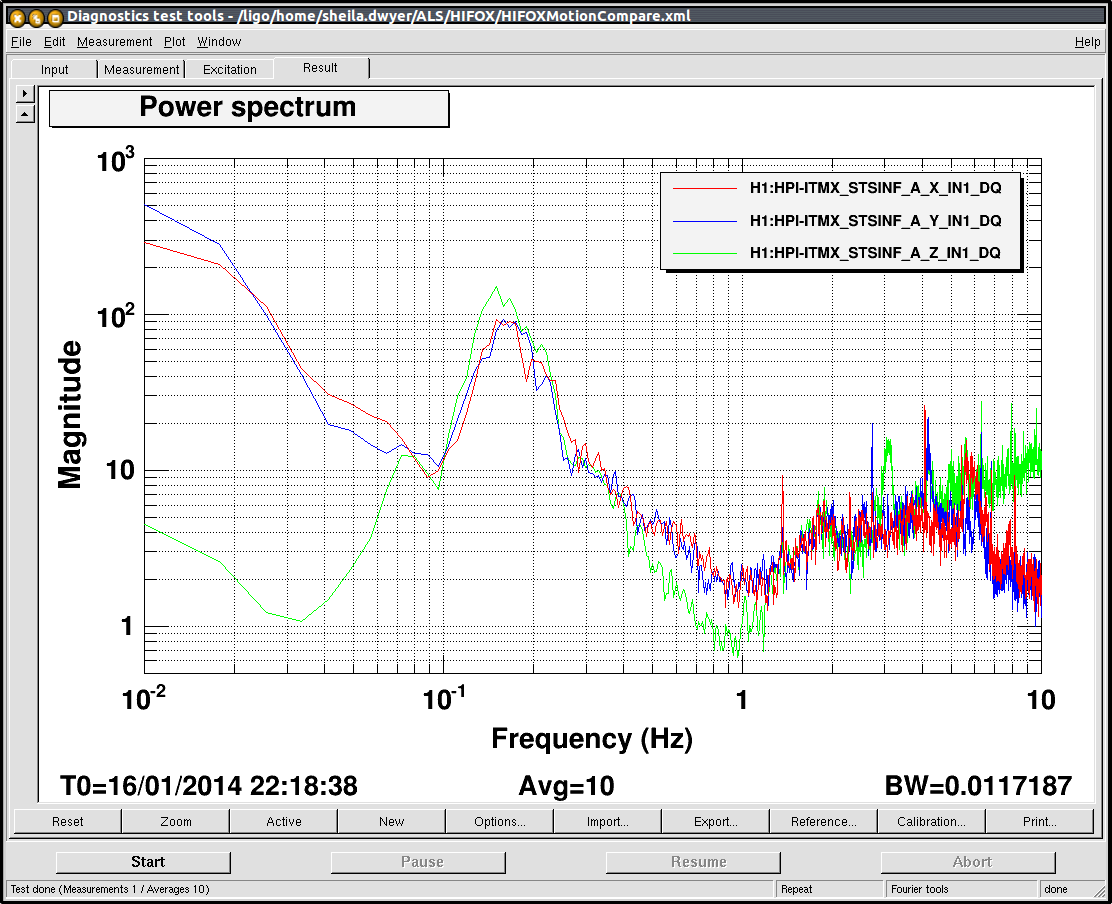
- Intertial motion of ST2 of the ISIs at ITMX and ETMX (LLO, LHO)
... Along X (Longitudial) and RY (pitch).
The SUS and SEI plots (which were not calibrated) would suggest that the magnitude of the motion recorded on both SUS and ISI is 10x bigger at LHO along X (longitudinal) while it was recorded within the same range along RY (Pitch).
We thought that differences in ground motion could explain this observation. Ground motion (LLO,LHO) was however comaprable between sites, at the time of the measurement.
Another explanation could have been a difference in matrices/calibrations between sites, but, as far as the ISI are concerned, they seem to match.
We see that we loose lock often because we use up the VCO range. The VCO full range is 2 MHz (awiki) which is equivalent to 14um peak to peak change in the arm length.
Another usefull comparison to make would be to look at the data from the ISIs durring HIFO Y to see if the motion that we had then was comparable to what we have now.