With the difficulty we had been having locking the green arm stably, there was some speculation about what the difference in the ETM transmission from the design of 5% would mean for our locking. Here are a few plots of pdh signals and resonance profiles for the cavity we have.
First, the IQ scatter plot we see doesn't look anything like a PDH signal I am used to. There was some speculation that this is caused by Doppler fringing. Using the equation 20 from P000017 the critical velocity for doppler effects with our etm is 200um/second, (about 800 fringes per second!) so we were never in this regime. (if the transmission of the ETM was 5%, this velocity would have been 3um second, which would have been reasonable with the motion that we had on thursday and before) Since Hugh's changes to the ISIs yesterday we are seeing about 3 fringes/ second when it is fast, (more often 1 or 2 fringes) so our cavity length is changing at about 0.8um/second at most.
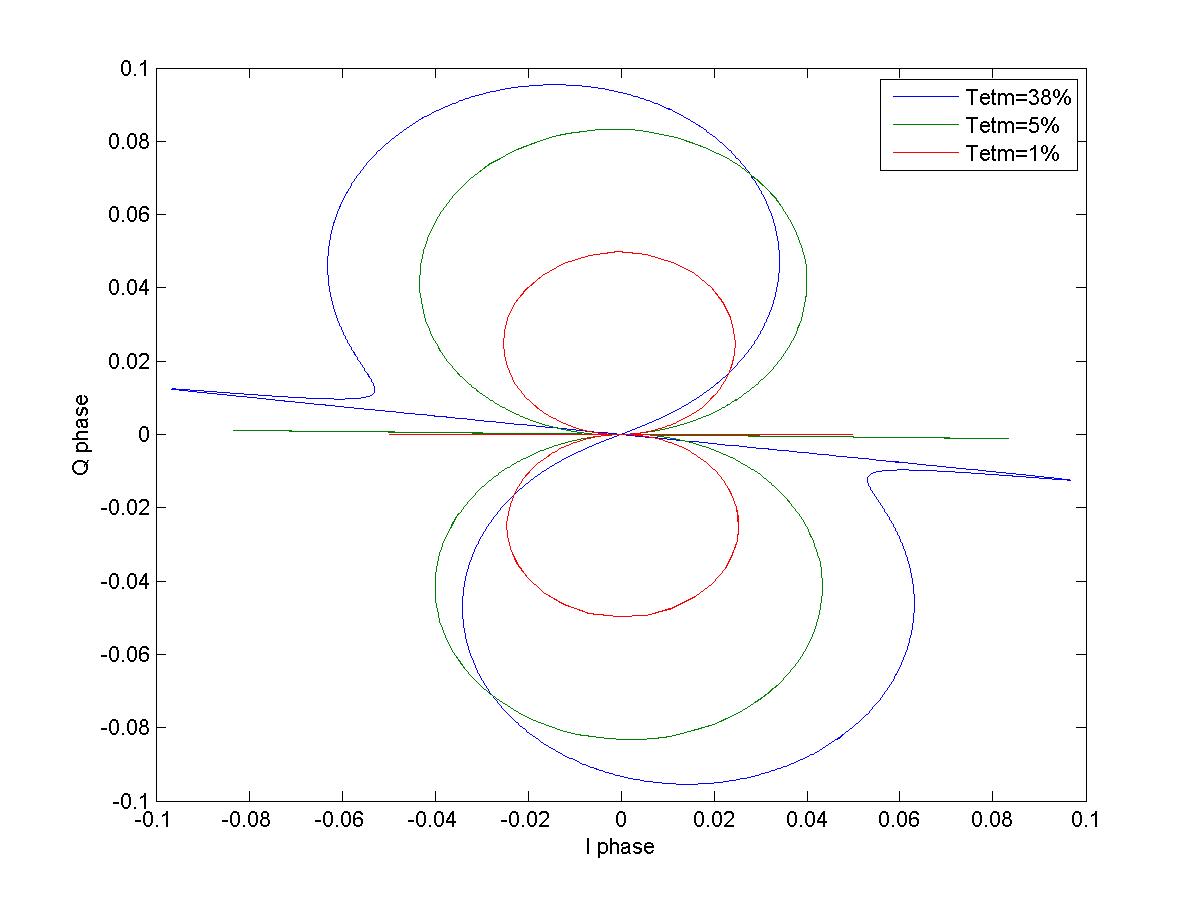
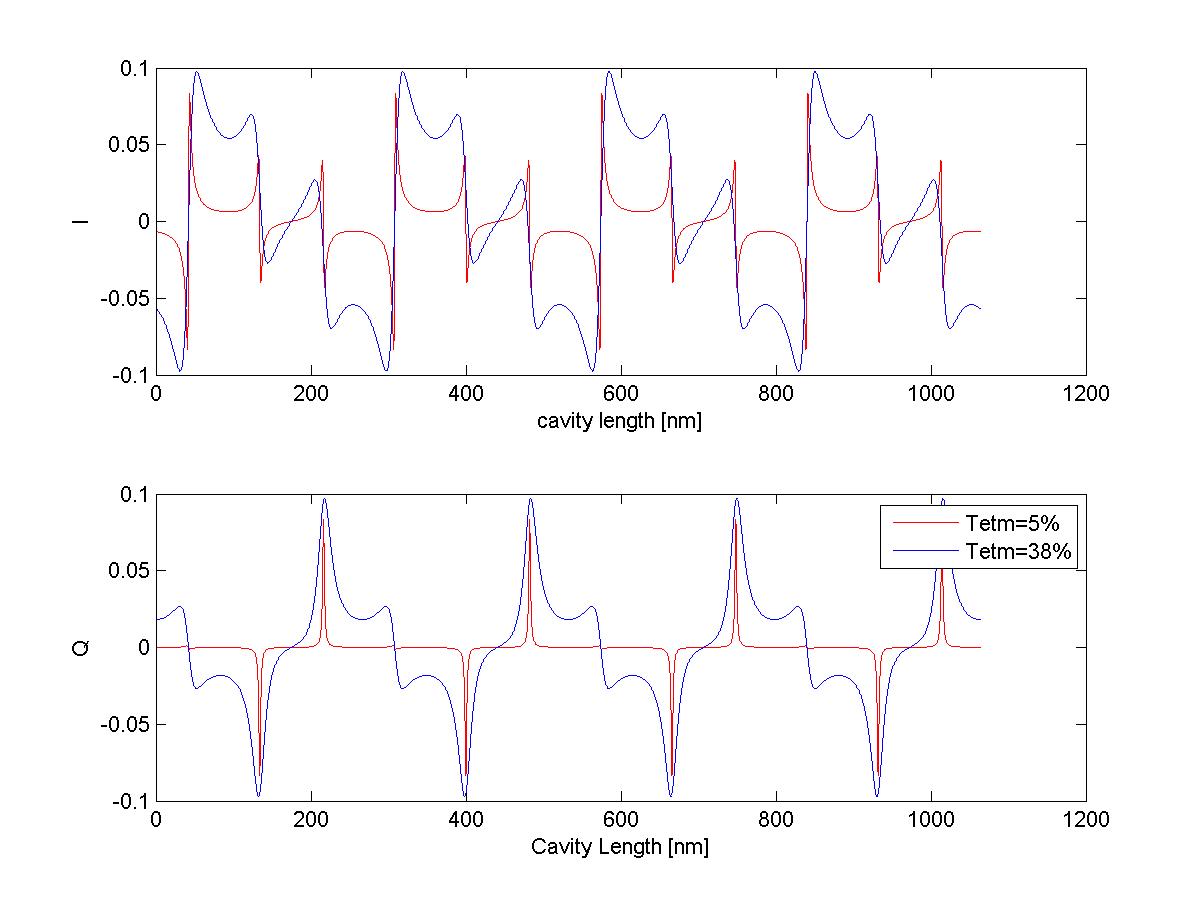
Here is an IQ plot of the PDH signals (units not meaningful) for an ETM transmission of 1% (normal looking), 5% (lobes from sidebands are becoming large) and 38% (our situation).
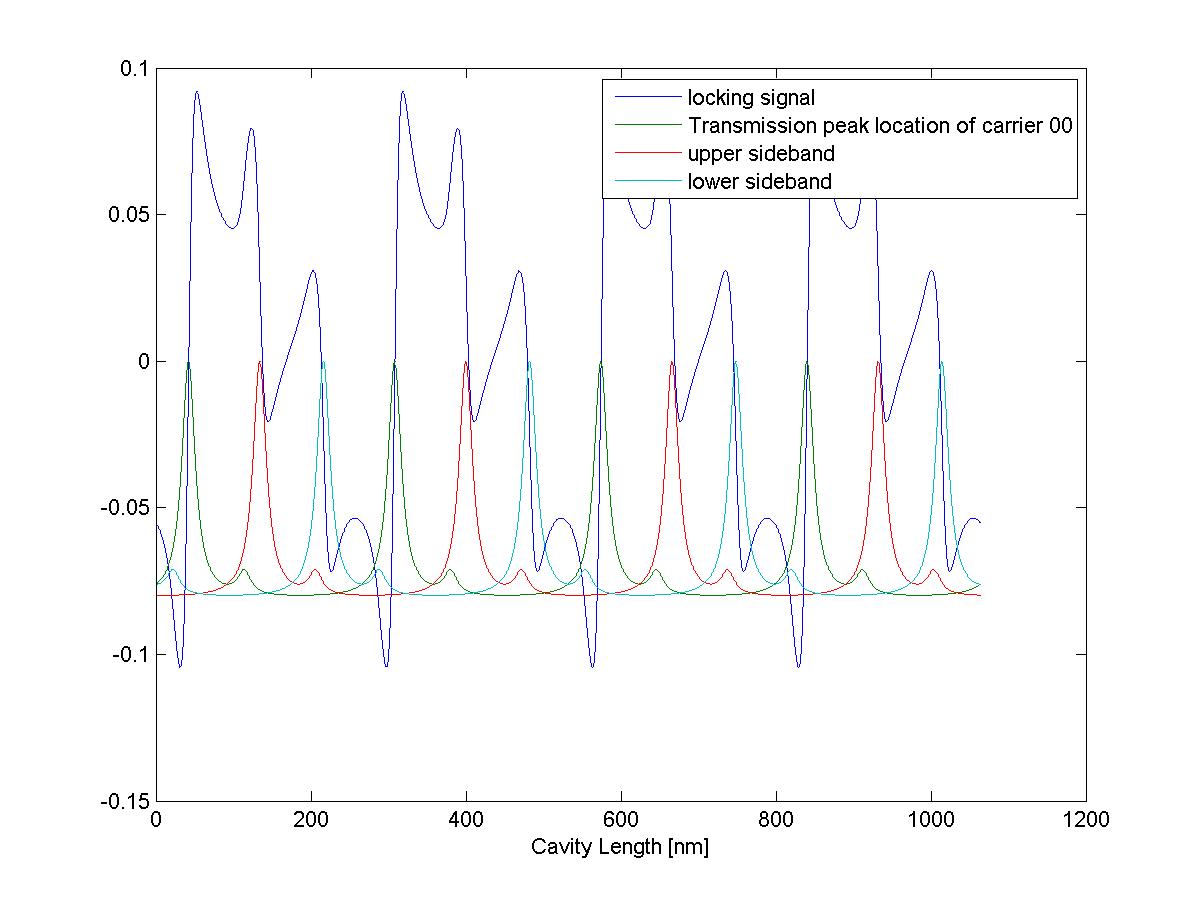
Even though that looks strange, it still seems like an OK signal for locking to if the demod phase is tuned correctly: Plot (In this plot I have used a different demod phase for the low finesse cavity than the one showing the design)
We also have been wondering how we are going to measure the modulation depth, since we do not have an OSA that works for green light. At some point we tried to lock on a sideband to have a look at the transmitted power relative to the 00 mode. The power we saw would have suggested a ridiculously high modulation depth. I believe that we might have been fooled by the camera image and were really locked onto a first order mode.
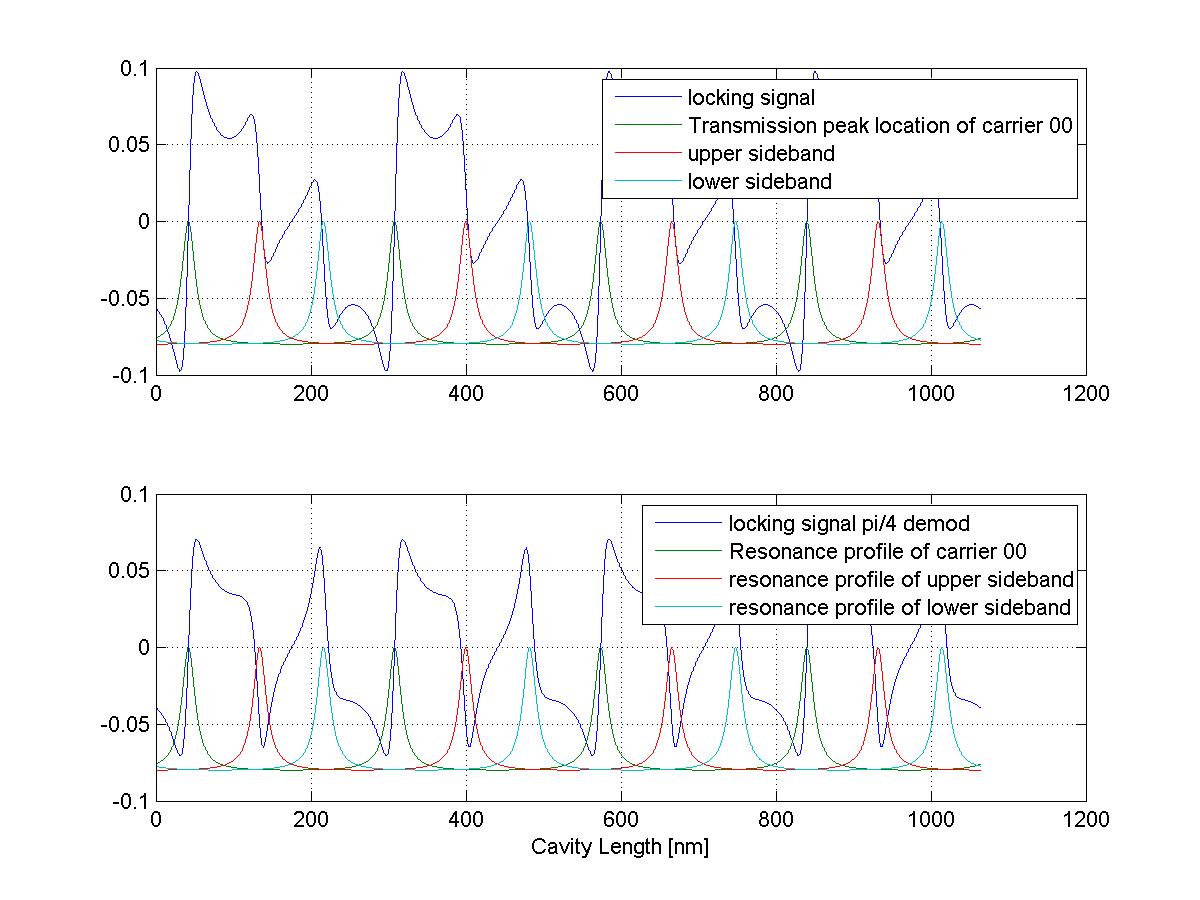
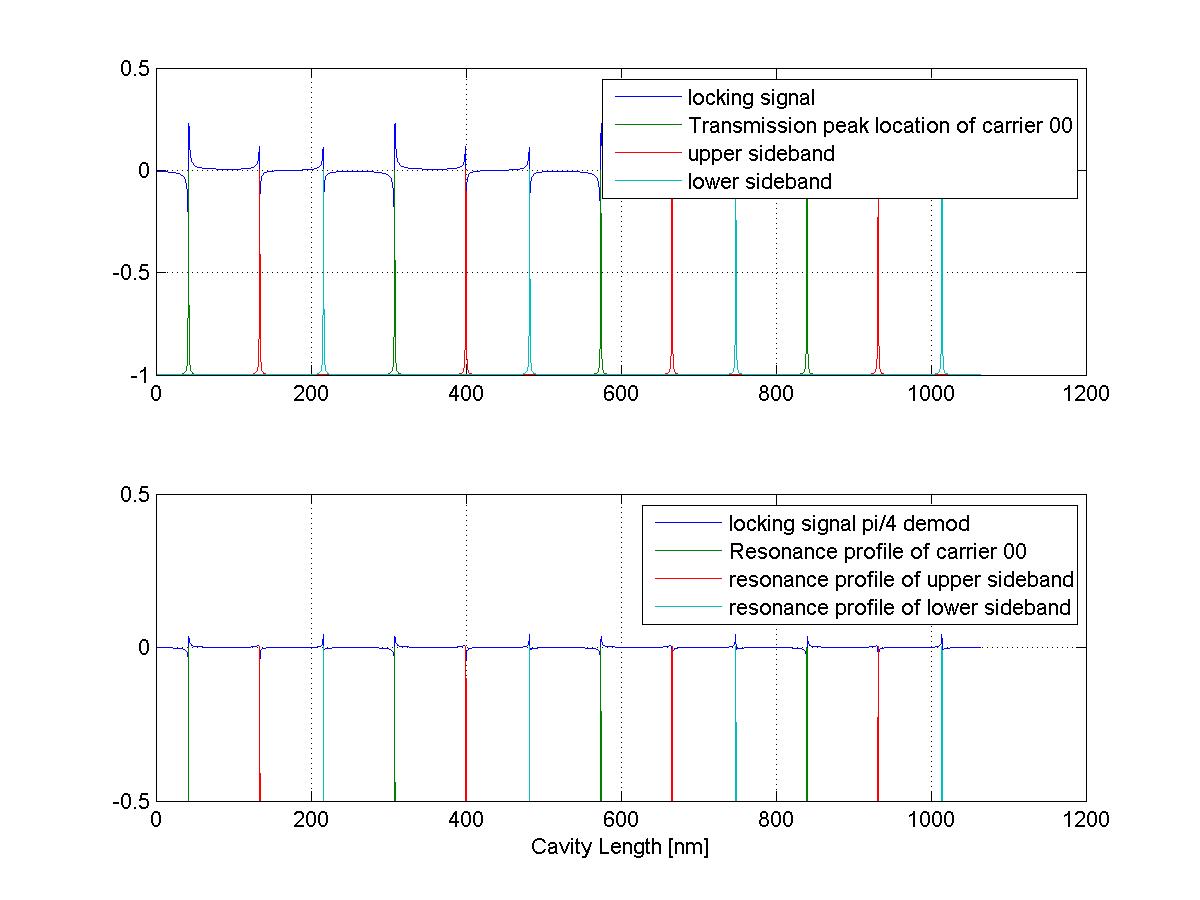
Keita suggested that I check if we really lock to the side band resonance when by flipping the sign of our servo. We would if the demod phase is tuned correctly and we didn't have higher order modes. Plot (This plot shows the shape of the resonance profiles for the carrier and each sideband against the PDH signal, the vertical scale is not meaningfull. The lower panel shows what happens with the wrong demod phase). I made the same plot for a higher finesse (Tetm=1%) where the sidebands are resonant when the cavity is locked with the sign flipped, even for the wrong demod phase.
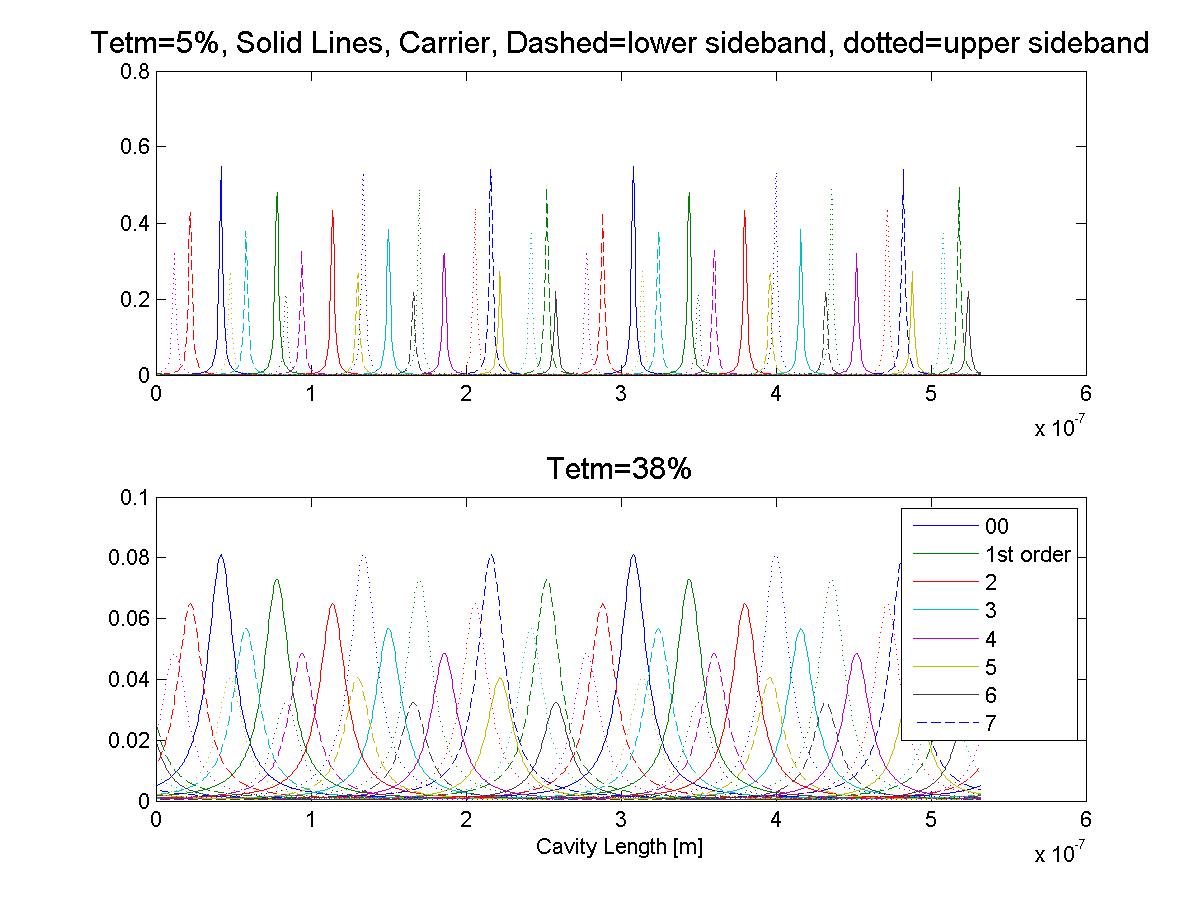
We also wondered if our low finesse would mean that higher order modes would be resonant when the cavity is locked. Here is a plot of resonance profiles for the first 7 higher order modes. The top panel shows Tetm=5%, the bottom panel Tetm=38%. The only of these modes that is resonant with the carrier is the lower sideband of the 5th order modes, which we should be able to keep small once we have a good alingment.
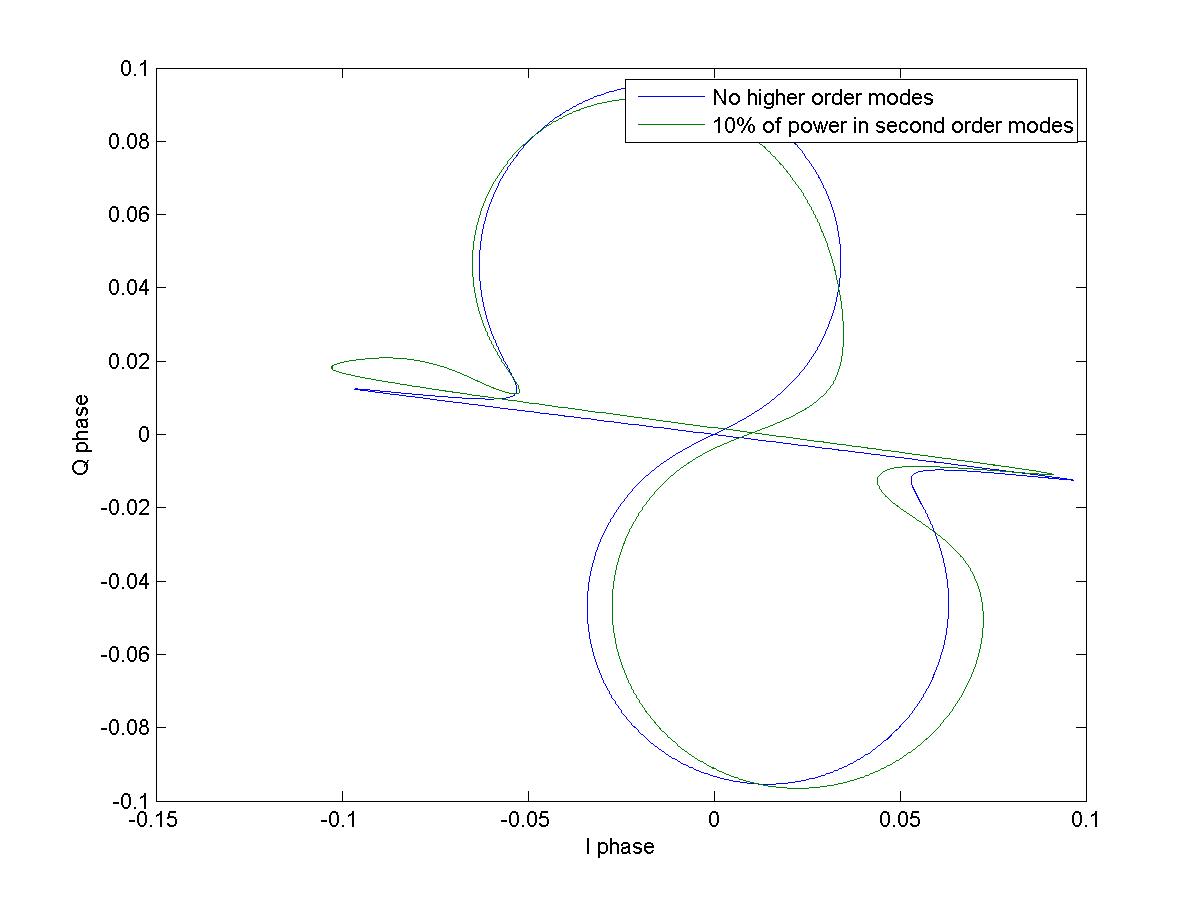
The last few plots are what higher order modes do to our locking signals. Here is an IQ scatter plot and the locking signal with resonance profiles of the carrier and sidebands when 10% of the power is in a second order mode. With a mode mismatch like this we still get reasonable locking signal.
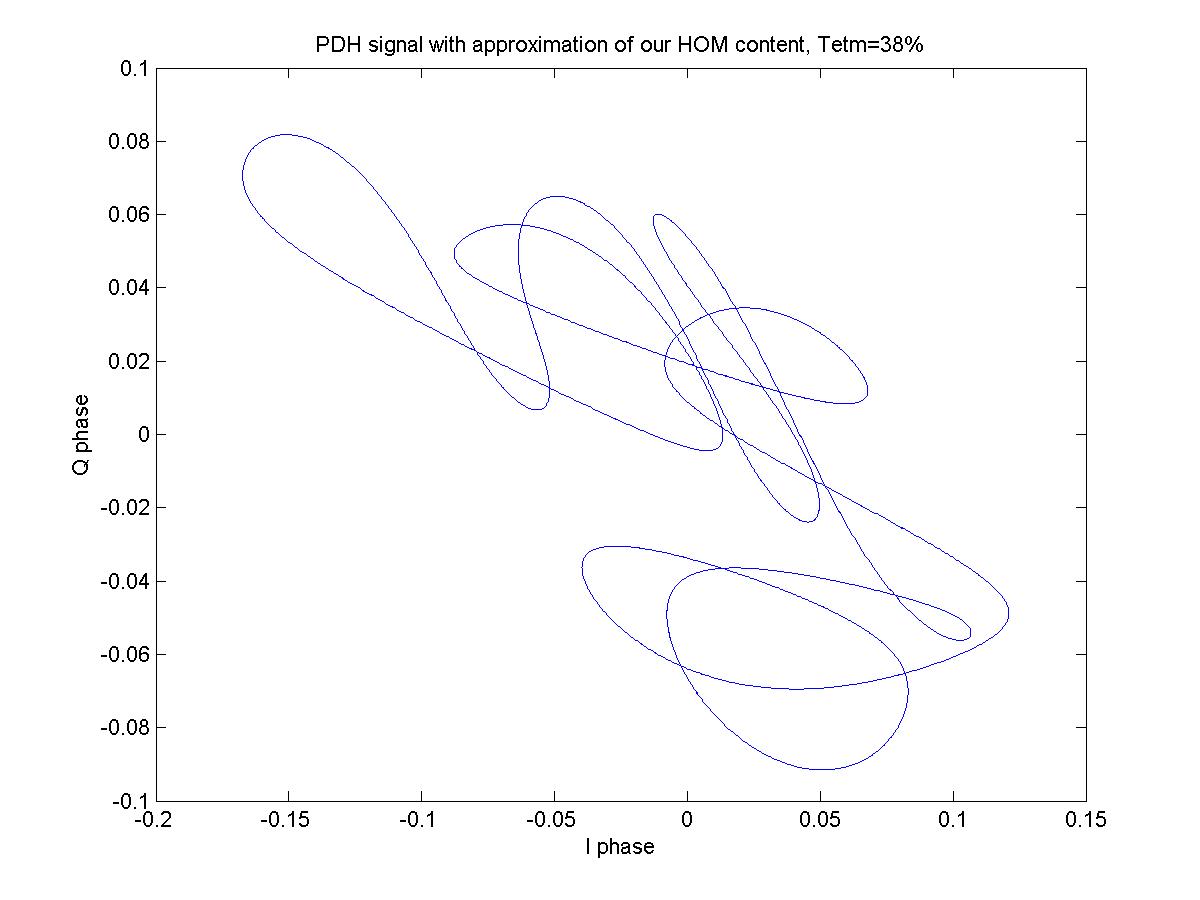
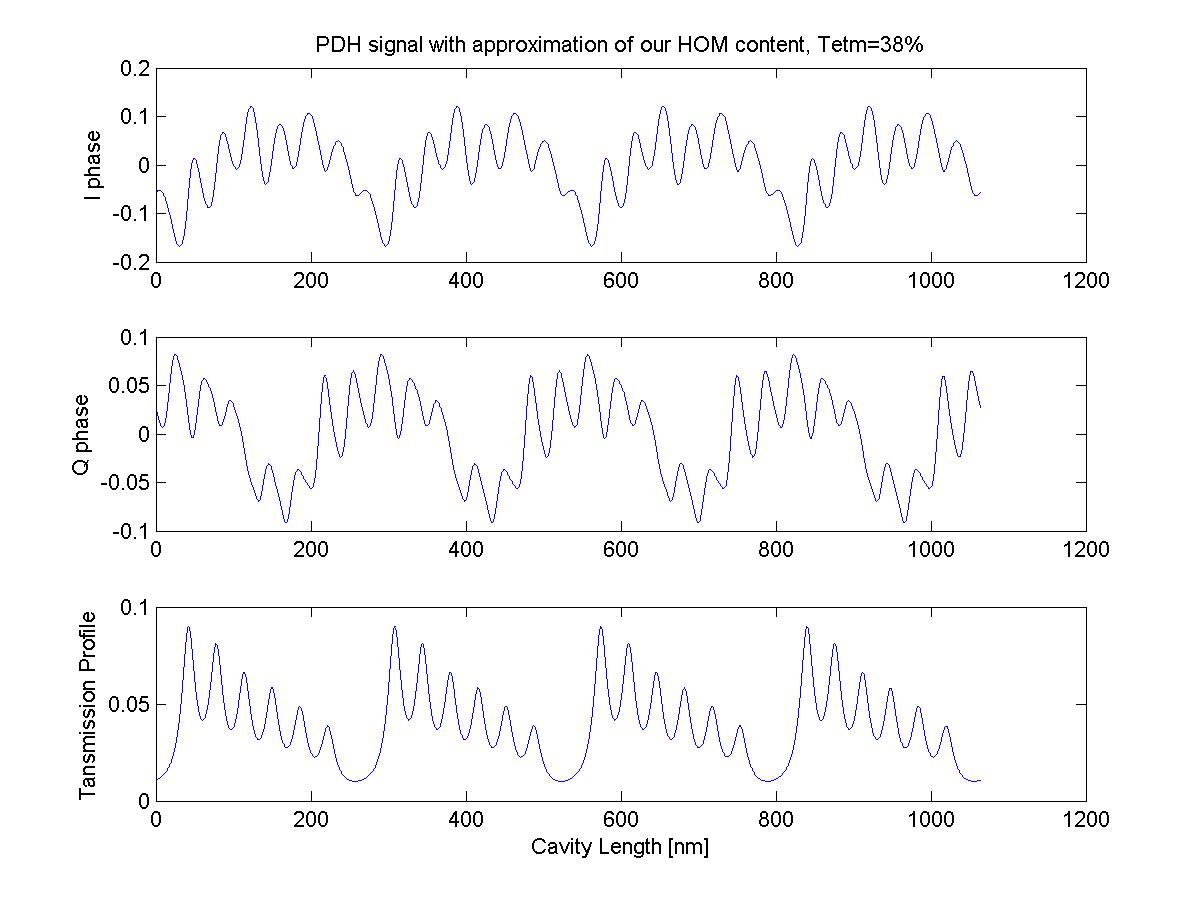
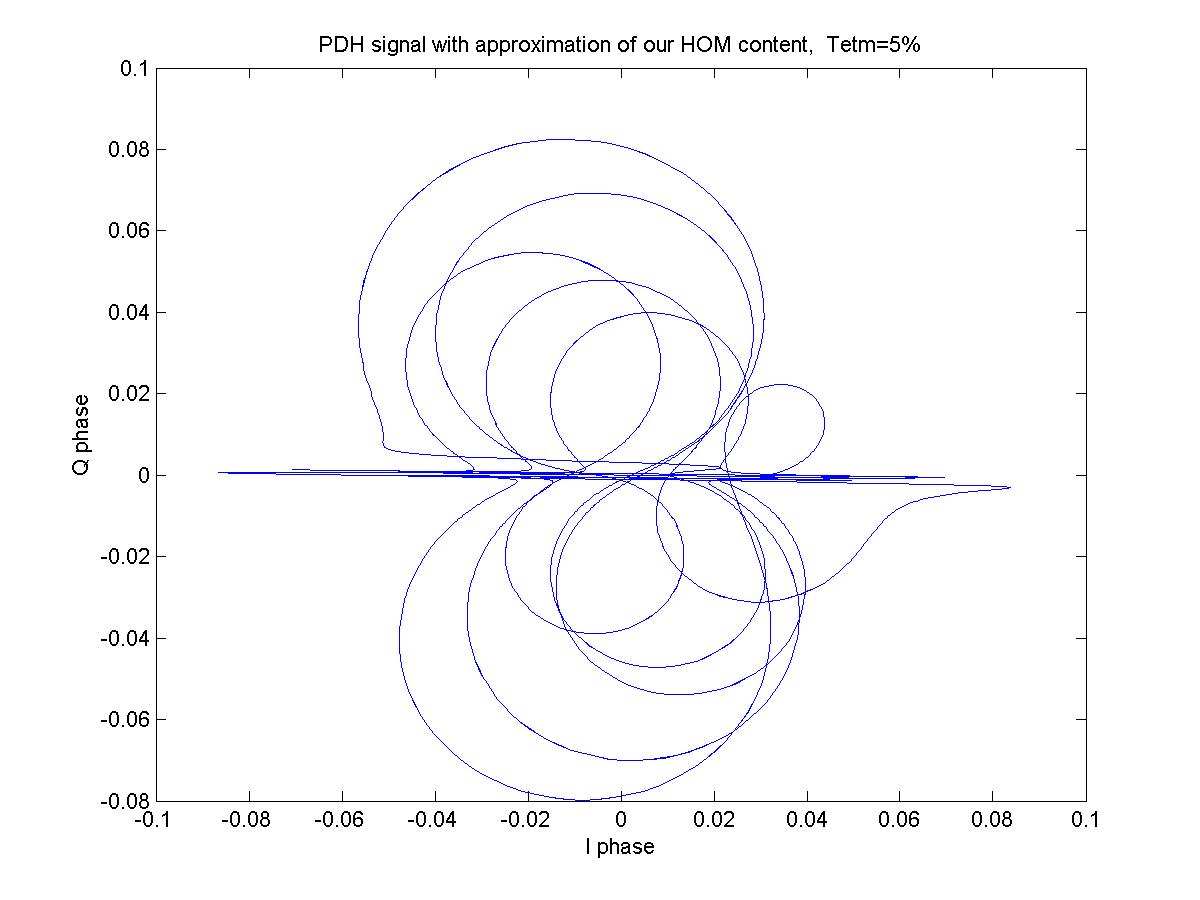
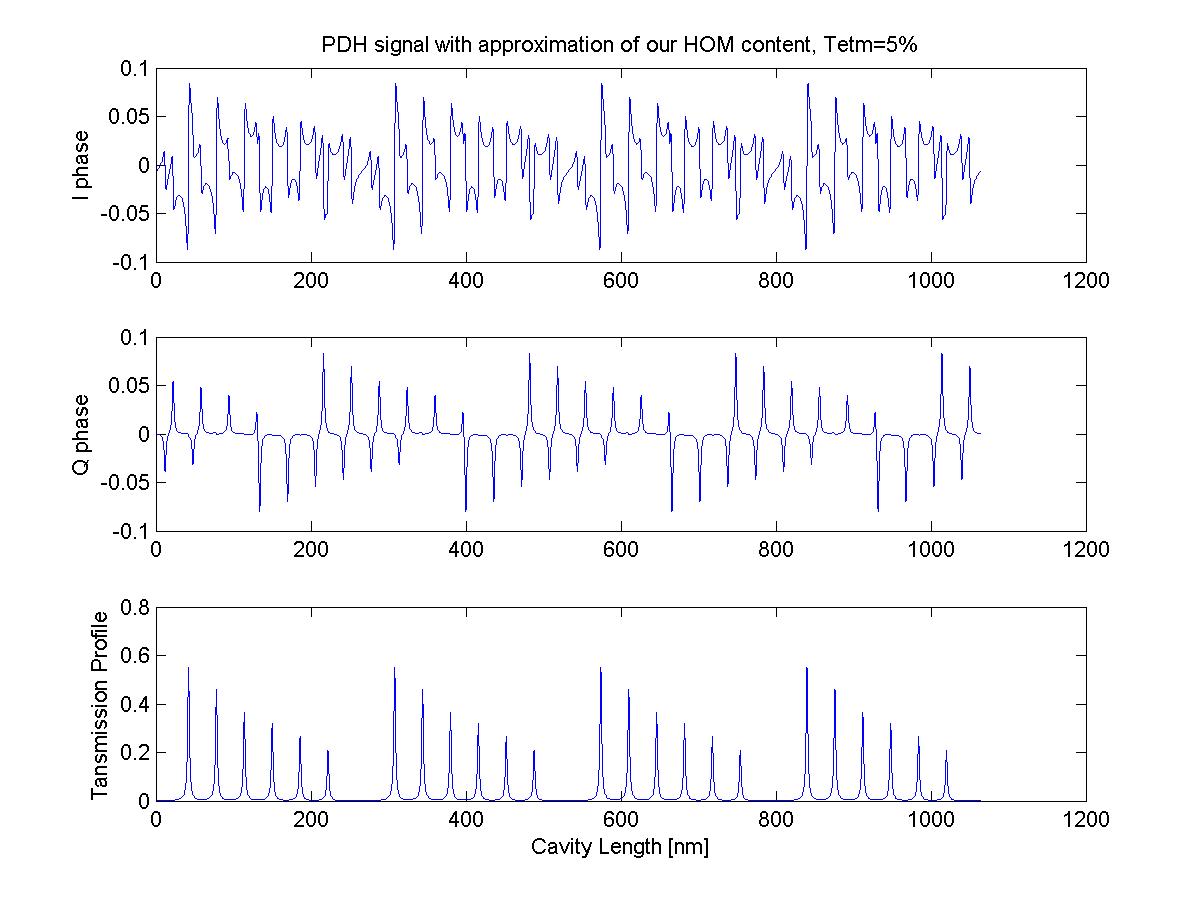
I had a look at some of our cavity transmission peaks , and made a rough approximation of the higher order mode content. Here are plots of the PDH signals (with my approximation of the transmission profile in the bottom panel) and an IQ plot. These are both with the demod phase tuned for the 00 mode with our finesse (by using the plot without higher order modes).
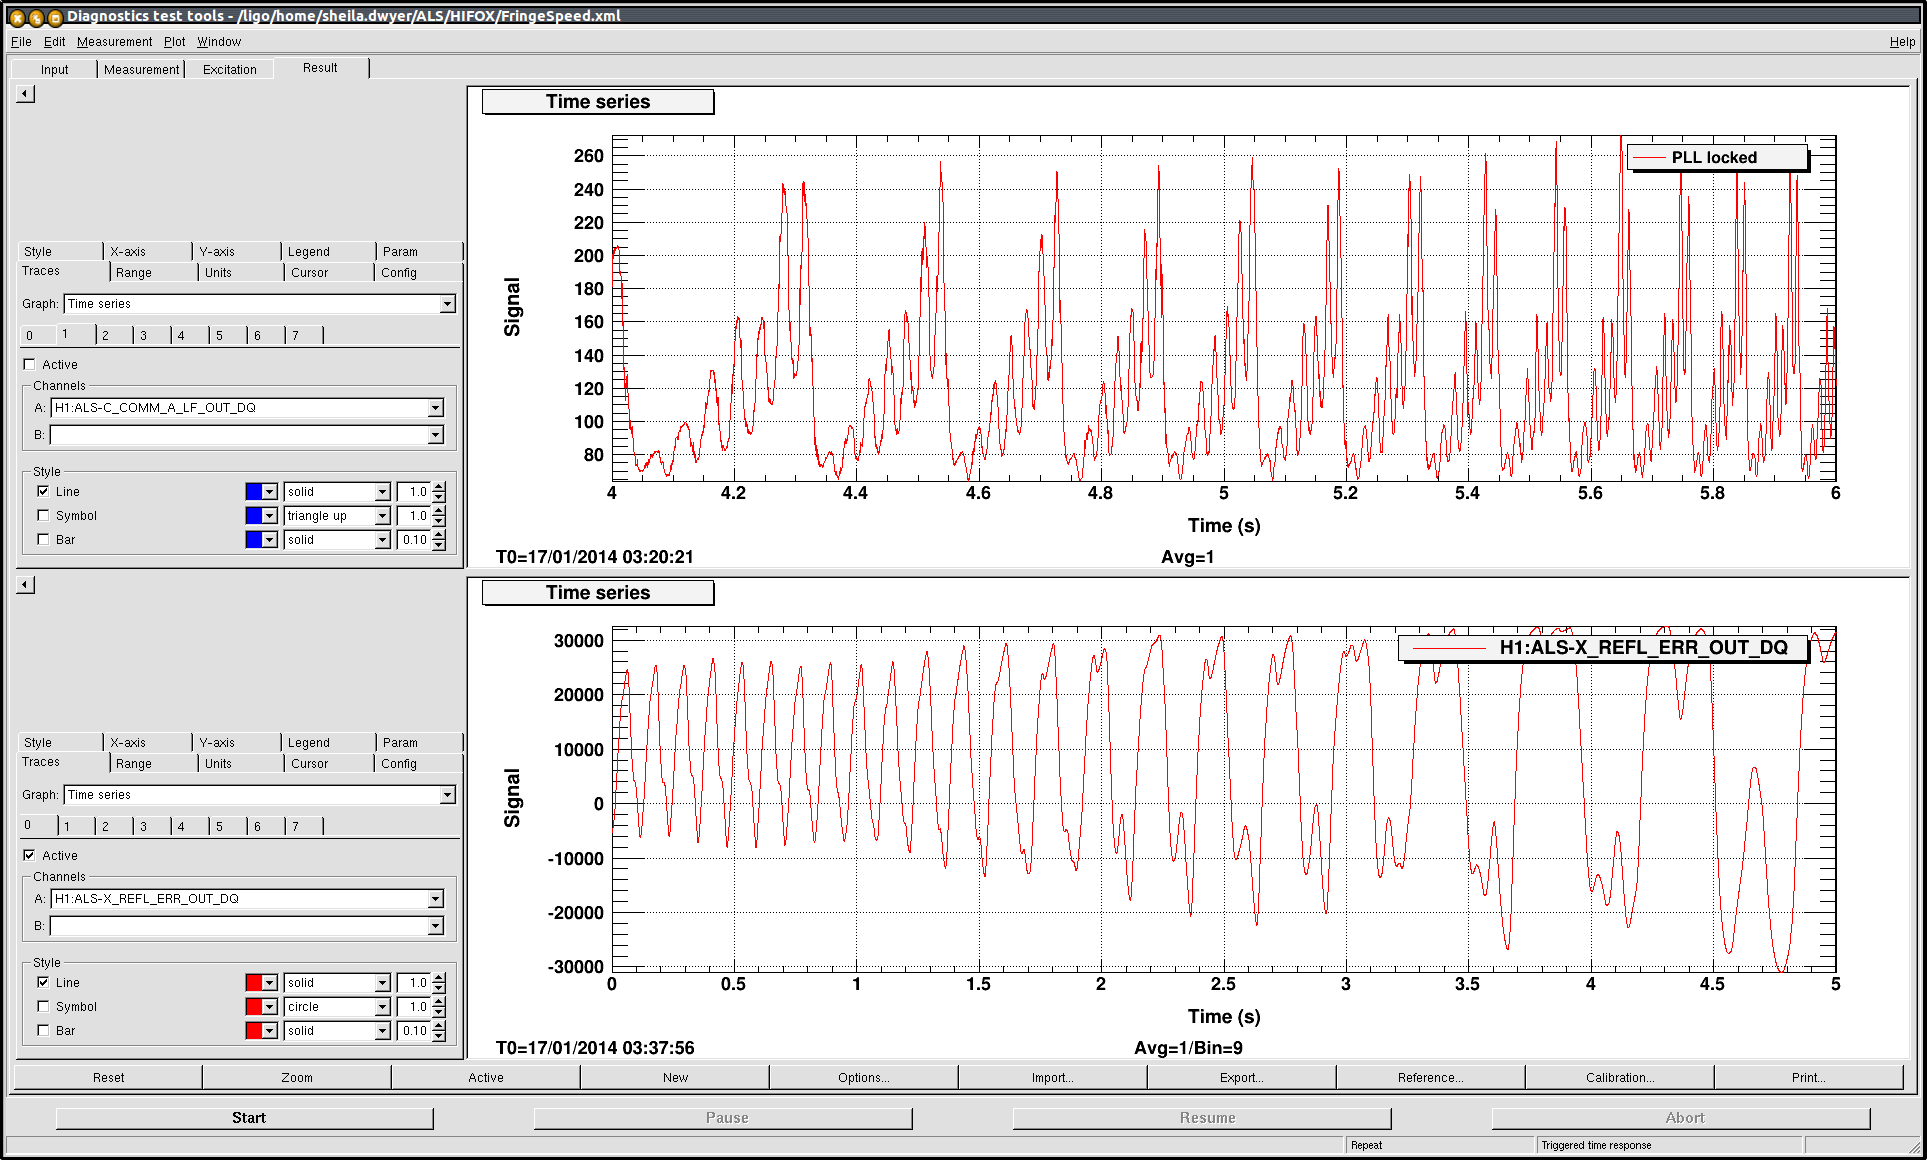
Daneil and I took a video when we were at the X end last night of our actual IQ scatter plot, which looks about as crazy as the prediction above.
The next two plots are what the IQ plot and PDH signals would look like with my approximation of our higher order mode content and the intended ETM reflectitvy of 5%. The higher order mode content doesn't totally confuse the locking signal the way that it does with the lower finesse.
I think that Yuta has some similar plots, and maybe has tried to actually match some of the PDH signals that we see.
In all of these plots I used:
