Written by Yuta, posted by Koji, while he is waiting for renewal of his ligo.org account:
In the entry alog #9381, Sheila explained how the PDH signal is distorted by the broadened resonance
of the higher-order modes due to low finesse of the cavity.
Here in this entry I explain how the shape of the PDH signal can be modified by changing the sideband frequency.
[Motivation]
ETMX transission for green was larger than designed(designed:5% -> measured:36%) and cavity length lock does not stay long.
The PDH signal looks strange(see alog #9381). To explain the situation and see how we can improve the PDH signal,
we calculated PDH signal including HOMs.
[Method]
1. Calculate PDH signal including the effect of carrier HOMs and sideband HOMs.
2. Change sideband frequency to see how PDH signal changes.
The parameters I used are the same as the ones listed in alog #9381.
Calculated TMS is 5.076kHz and the sideband frequency before we have changed last night was 24.407079MHz.
HOM content and vertical scale are arbitary in the following plots.
[Result]
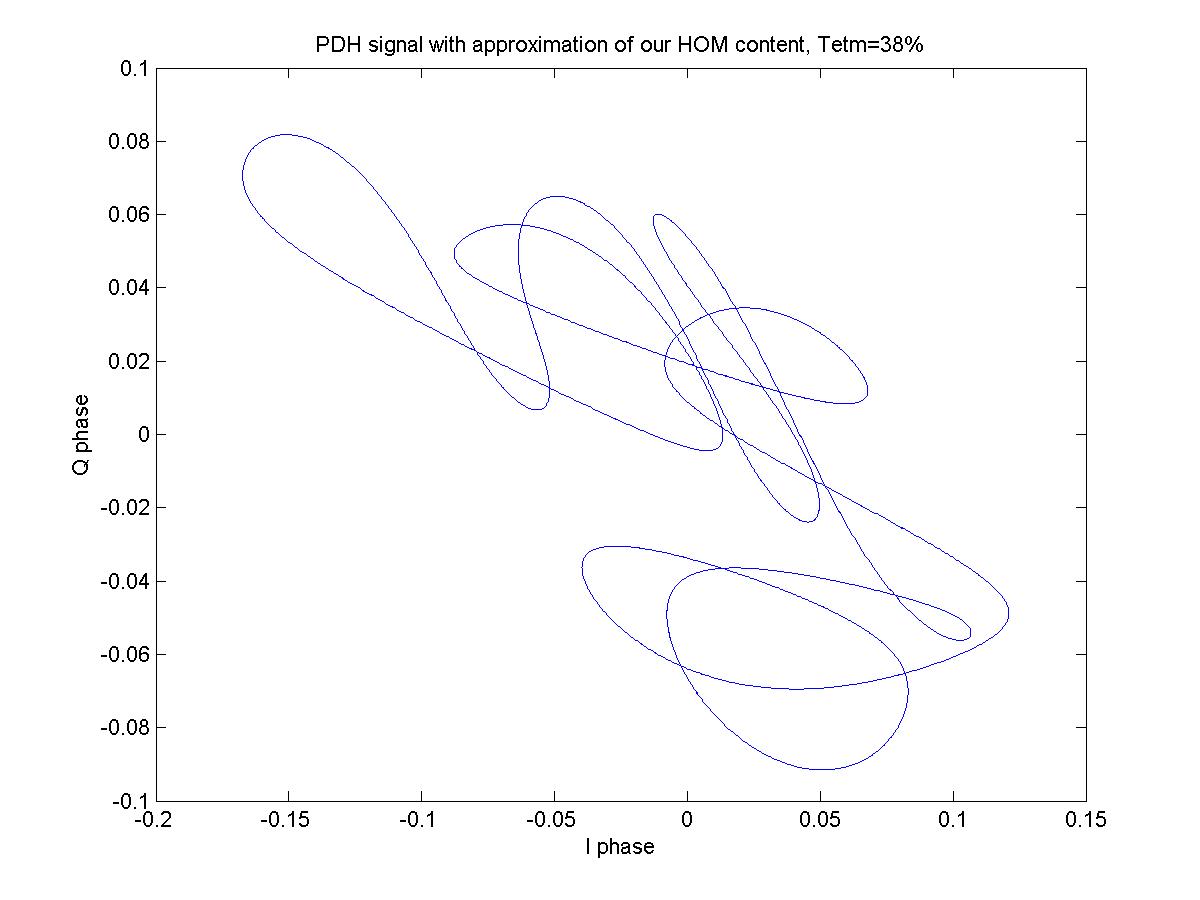
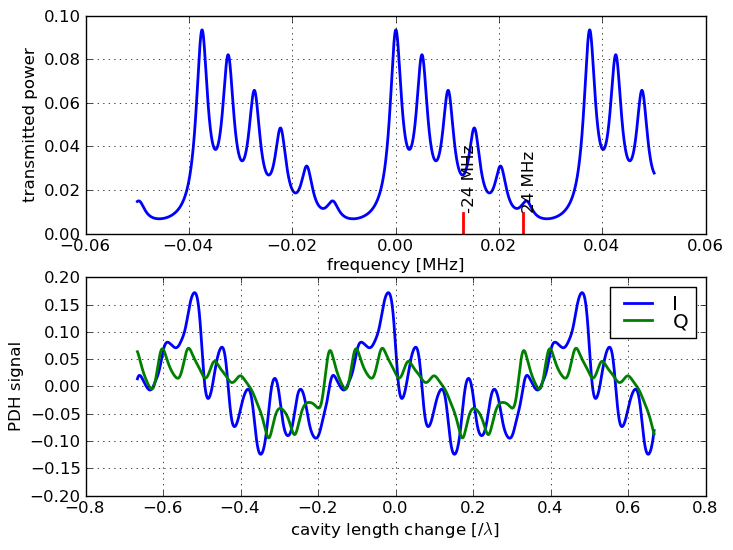
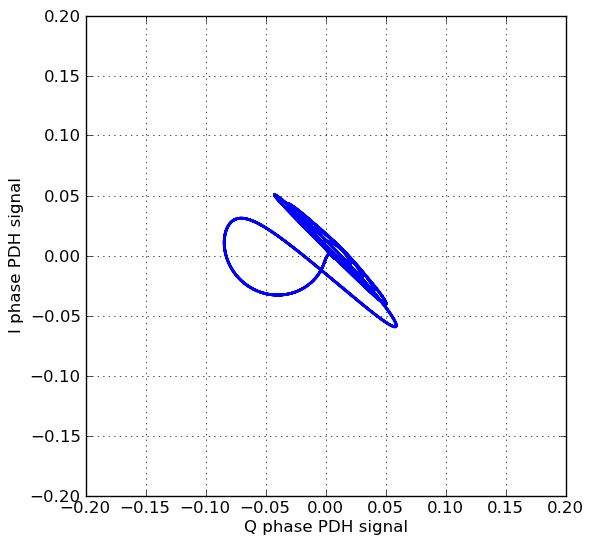
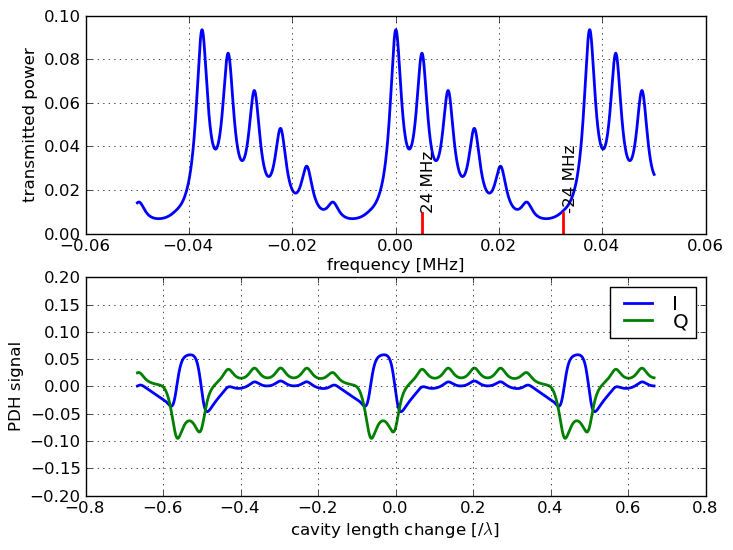
1. HOMPDH_sb24_4MHz.png and HOMPDHIQ_sb24_4MHz.png show the calculated transmission, PDH signals,
and XY plot of I-phase and Q-phase PDH signals, when the sideband frequency was set to the original value. This
IQ plot is very similar to what we have seen(see video in alog #9381) and agrees well with Sheila's calculation.
2. HOMPDH_sbonres+0_5TMS.png and HOMPDHIQ_sbonres+0_5TMS.png are the plots when one of the sideband
is at the middle of the TEM00 and TEM01/10 resonances. PDH signal gives zero crossing at TEM00 resonances,
but it also gives zero crossing at other HOMs. So, mode hopping rate is expected to be high.
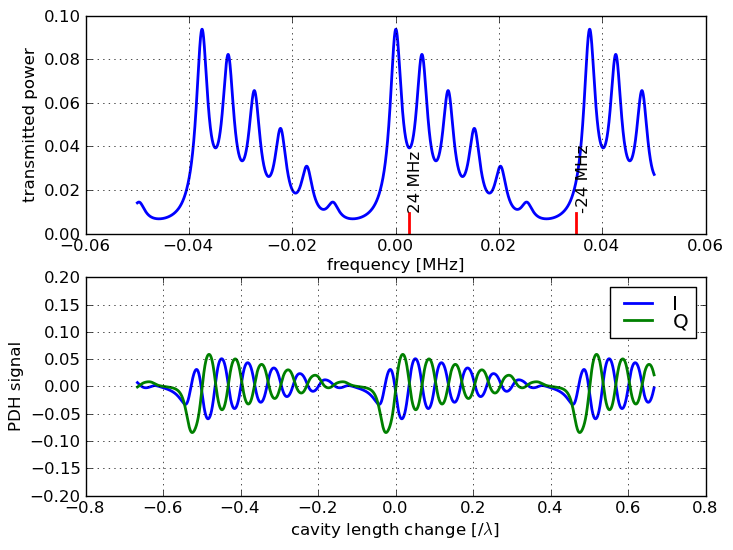
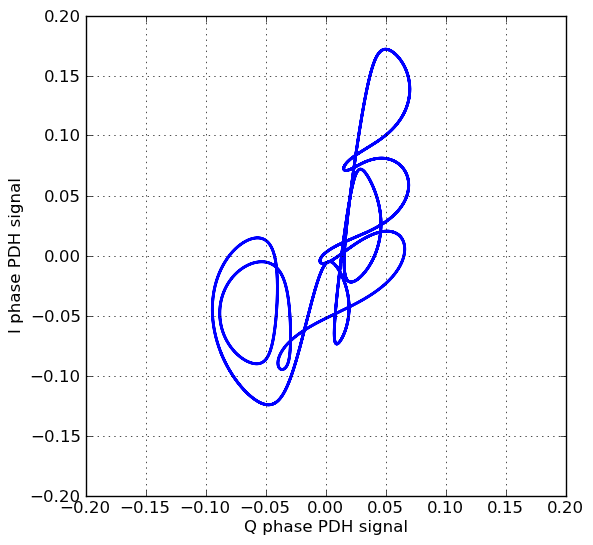
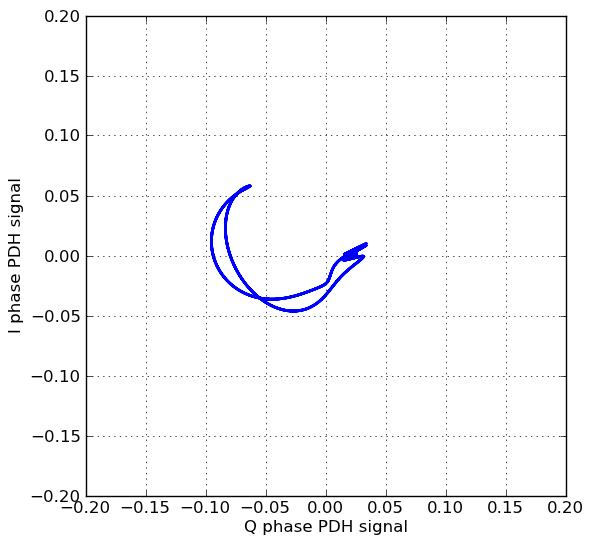
3. HOMPDH_sbonres+TMS.png and HOMPDHIQ_sbonres+TMS.png are the plots when one of the sideband is
at the TEM10/01 resonance. PDH signal does not give zero crossing at TEM00 resonances, but if the correct offset
is given, mode hopping rate should be low. The IQ plot will be somewhat simple "8" shaped plot in this case.
See alog #9379 for what we have done using these results.

Written by Yuta
Calculation on demodulation phase dependence was done. See also alog #9429.
Requirement for the demodulation phase adjustment, TMS measurement and mirror alignment fluctuation to achieve frequency noise of few Hz are;
demod phase error < ~ 5deg
TMS measurement error < ~ 5% (~250 Hz)
mirror alignment fluctuation < ~0.3 urad
[Method]
1. Fix sideband frequency at the middle of the TEM00 and TEM01/10 resonances and calculate PDH slope and offset at 00 resonance for various demodulation phases.
2. Calculate PDH signal when the demodulation phase is set so that PDH offset will be zero at 00 resonance (see alog #9384).
3. Calculate zero crossing point of PDH signal dependence on differential cavity mirror misalignment (see alog #9429) when demodulation phase is off by 5 deg (see alog #9386) from the phase where the PDH offset is zero.
4. Repeat 3 by slightly changing the sideband frequency.
[Result]
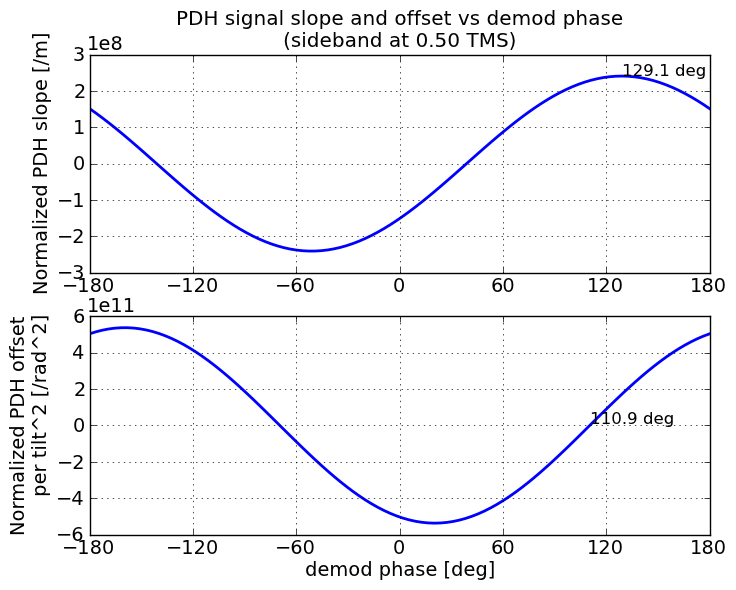
1. misPDHdemod.png shows PDH slope and offset vs demod phase. Note that demodulation phase which maximizes the slope is different from the phase which minimizes the offset. The phase which minimizes the offset does not depend on TEM01/10 content, but the slope does.
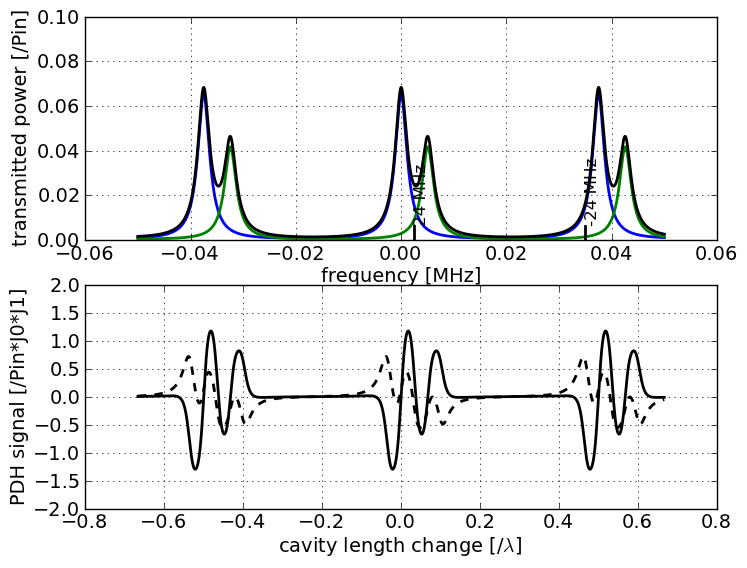
2. misHOMPDH.png shows PDH signal when the demodulation phase is set so that PDH offset will be zero at 00 resonance.
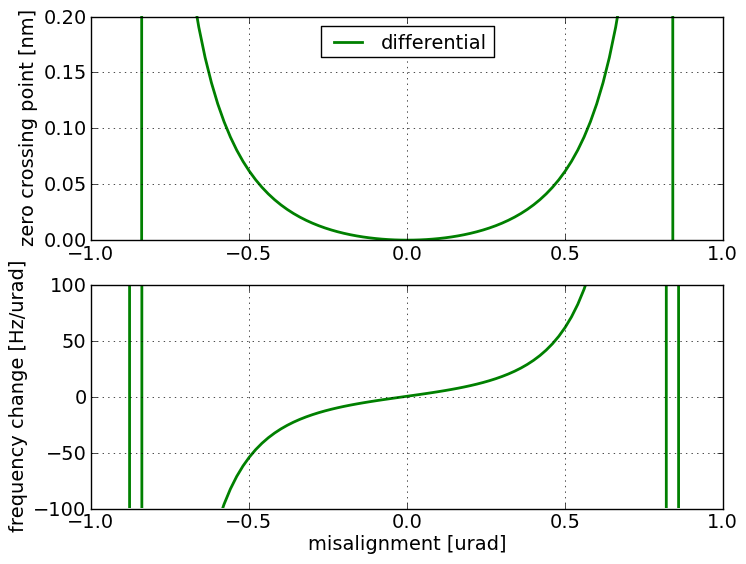
3. zerocrossingPDH_5deg.png shows PDH zero crossing point shift by differential mirror misalignment when demodulation phase is off by 5 deg.
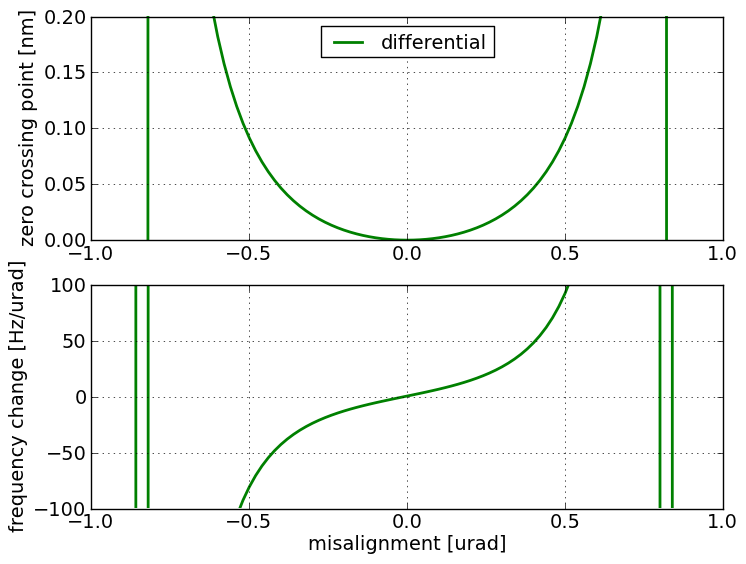
4. zerocrossingPDH_5deg_5percent.png shows PDH zero crossing point shift by differential mirror misalignment when demodulation phase is off by 5 deg and TMS measurement 5% wrong (worst combination).
[Discussion]
1. Assuming we can adjust the demodulation phase within ~5deg to minimize PDH offset by misalignment, measure TMS at <5% precision and alignment fluctuation is <~0.3 urad, misalingment induced frequency noise is smaller than few Hz.
2. The PDH signal looks nice when sideband is at the middle of the TEM00 and TEM01/10 resonances. It has about TMS of linear range and the range symmetric (compare with alog #9384).