(Correction Jan/31: Sheila's made a similar plot for a period (https://alog.ligo-wa.caltech.edu/aLOG/index.php?callRep=9691) where the cavity was locked all the time, and it seems like the plot presented here was sampling only a small edge of the 00 lock range.)
As of now, it seems like both ETM and ITM should be within 0.3 urad pk-pk from the optimal alignment to stay locked on 00 mode.
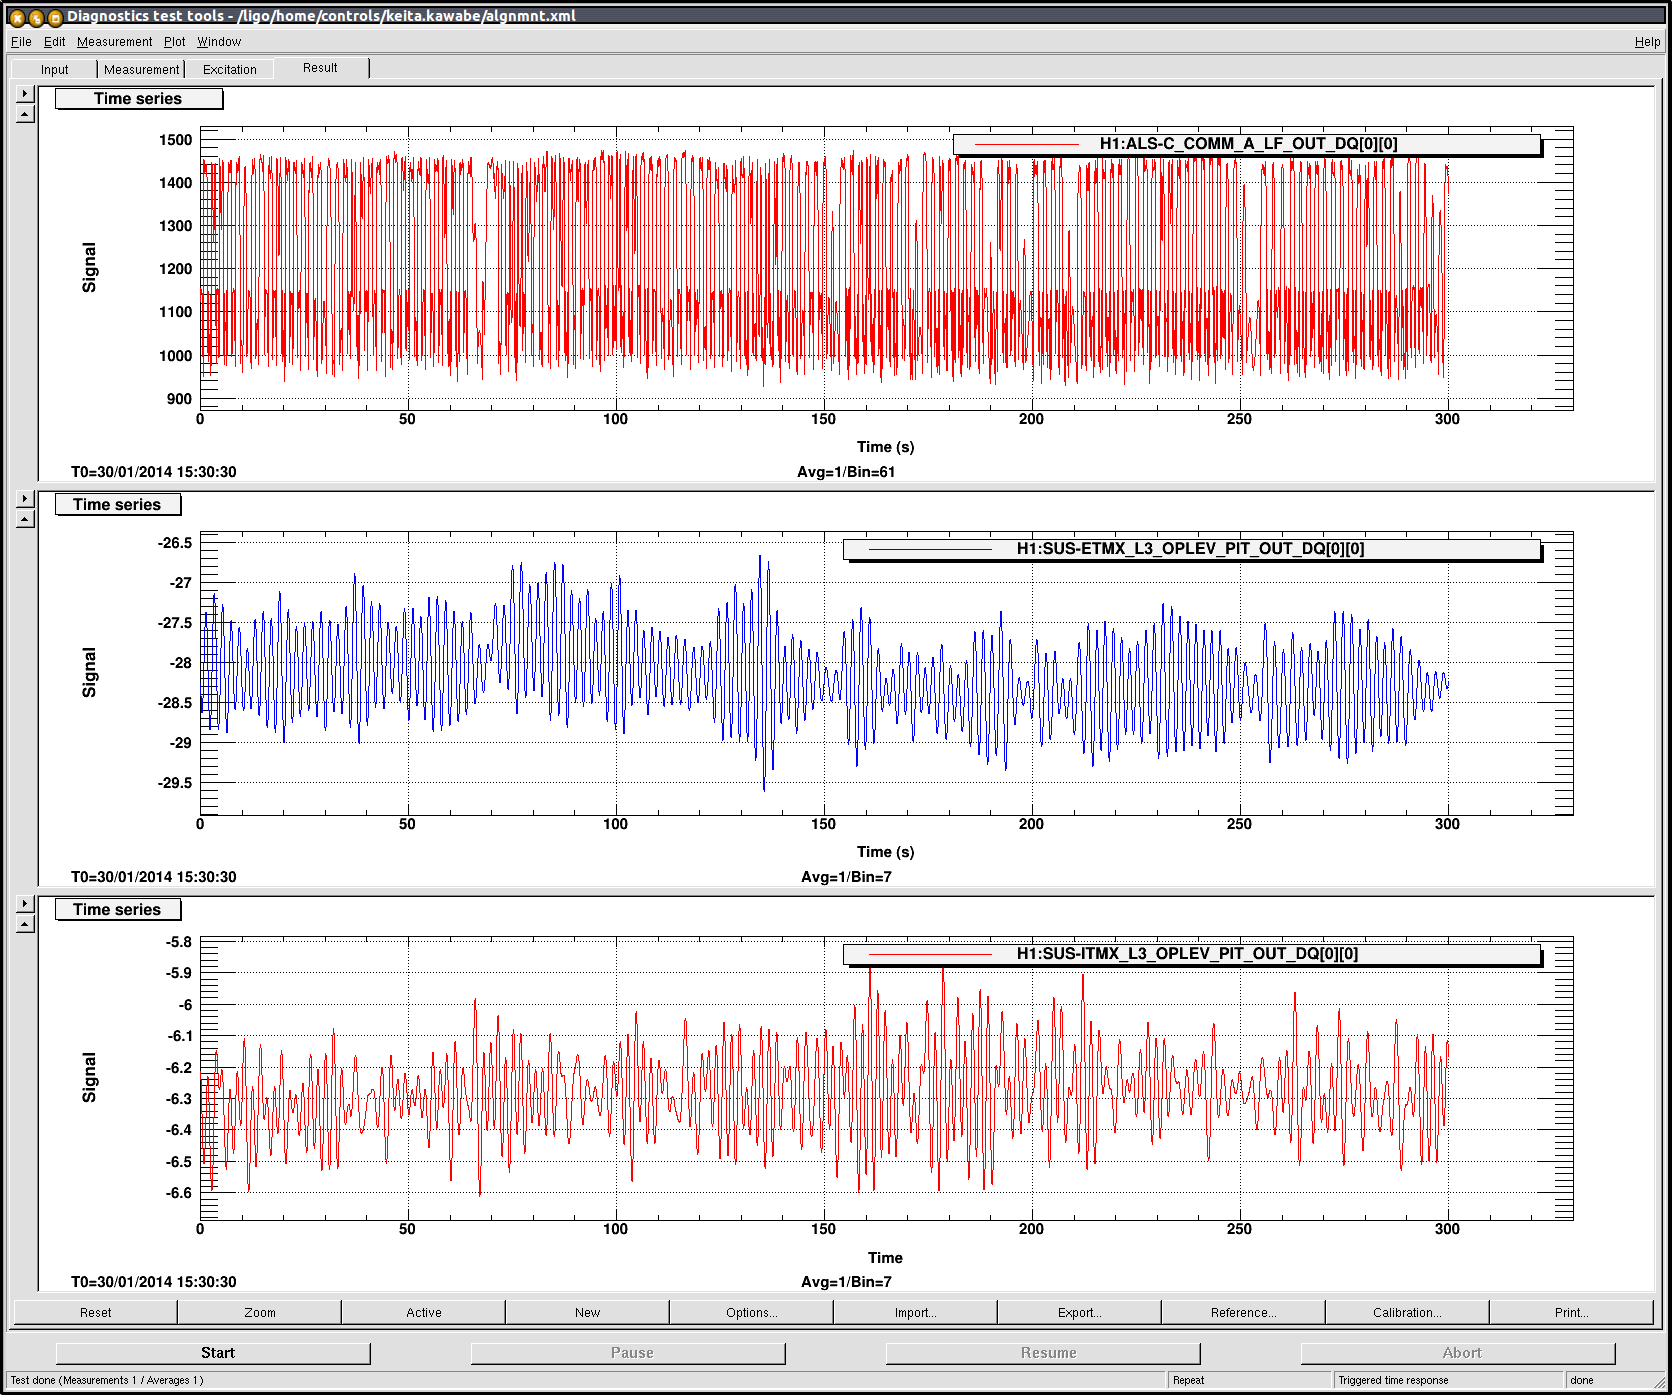
Plot 1: I took OL and green transmission data for 5 minutes when the cavity was going back and forth between 00 and 01 mostly without losing lock.
In the top panel, the transmission time series is actually the sum of the SHG and the transmission, but it's on 00 mode when it was 1400 counts, 01 when it was between 1000 and 1200 counts.
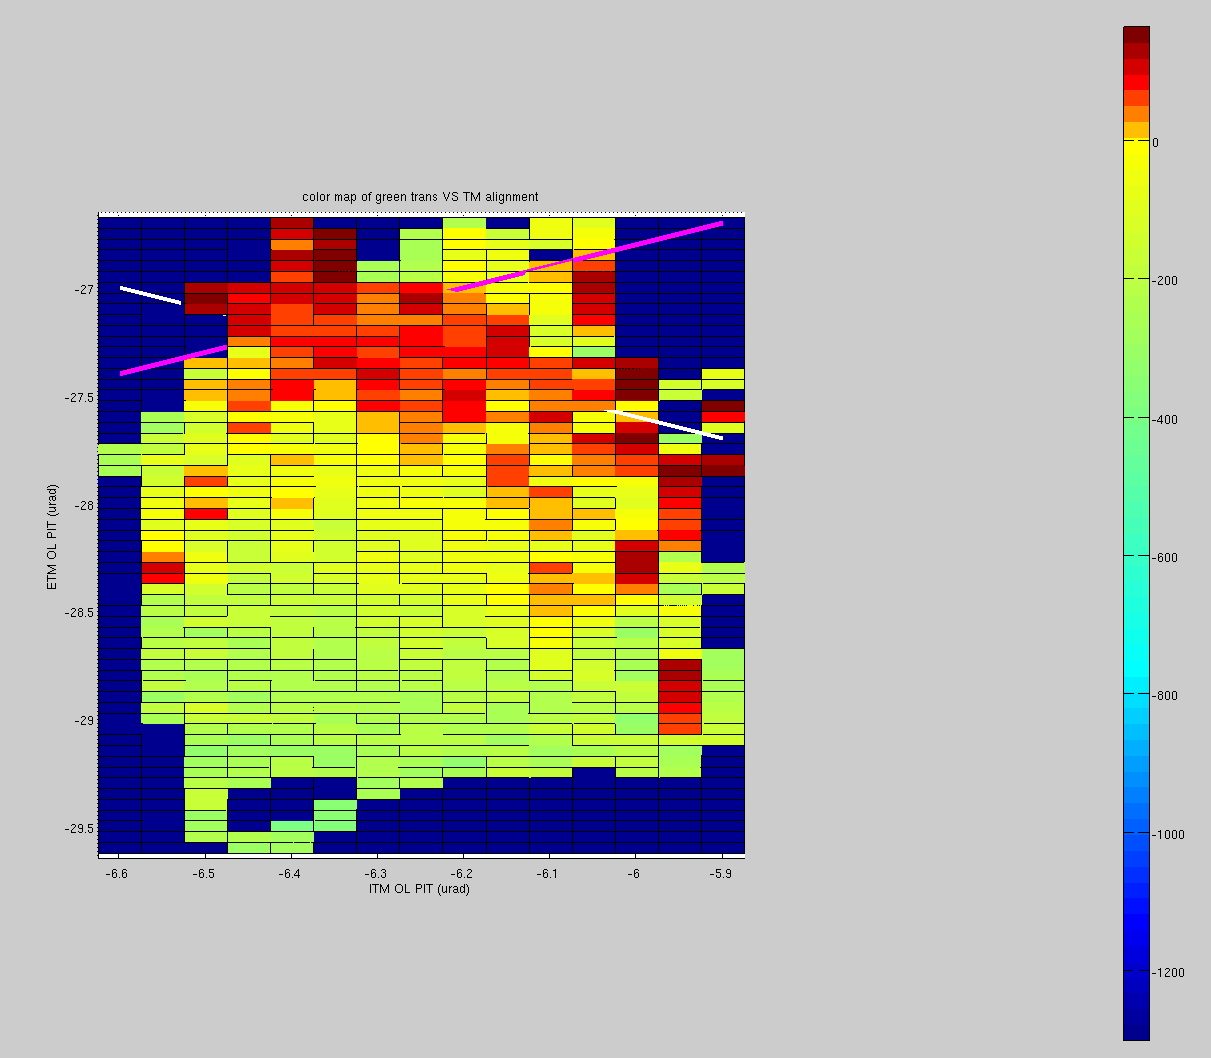
Plot 2: 2D color map of the above data.
X axis is ITM OL PIT, Y is ETM. I arbitrary set the threshold of 1300 counts for green transmission and subtracted that from the transmission data, and set the color map such that orange-red color is above 0 (i.e. locked to 00 mode), yellow-green is negative (01 mode).
Each cell is normalized by the number of data points in that cell. Blue means there's no data point in that cell.
Sorry that X and Y axis scaling is different. To aid your eyes, I put white and pink diagonal lines showing the direction of common (soft) and differential (hard) misalignment.
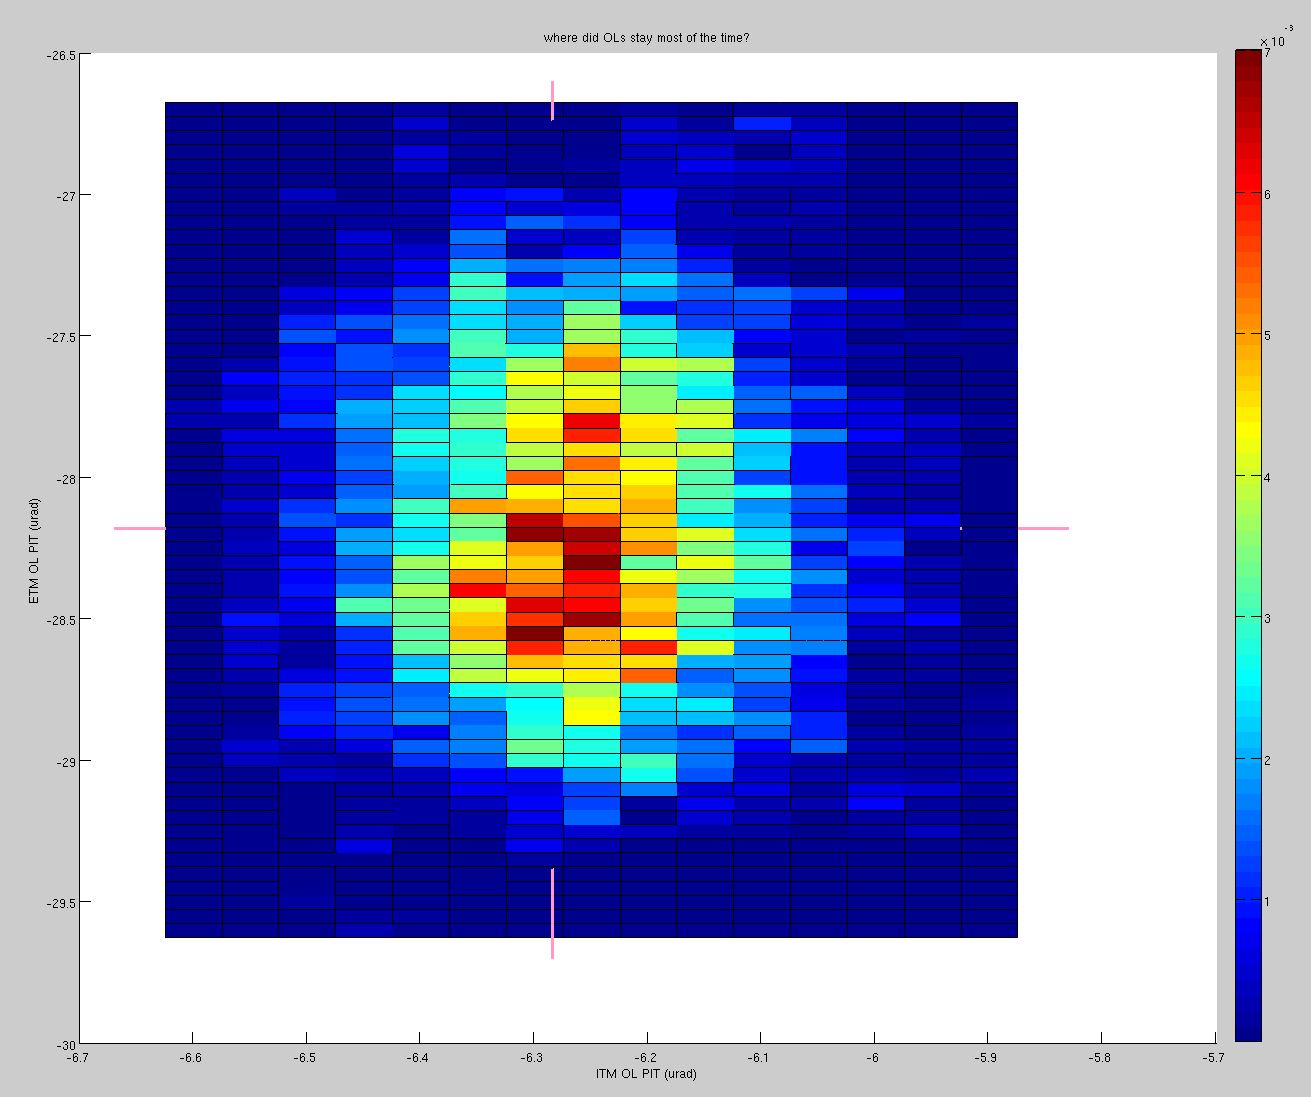
Plot 3: 2D plot of where the OLs were staying.
You cannot tell from plot 2 where the OL was staying the most, so here is the number of data points in each cell divided by the total number of data points. Adding everything on this map together you'll get 1.
On average EX=-28.12, IX=-6.28.
Conclusion:
- Thin band on 00 mode area, elongated along the white (soft or common) line, shows that the problem is along the pink line (differential or hard) due to cavity geometry discussed before by people.
- In order to stay locked on 00, both ITM and ETM should be within 0.3 urad pk-pk or somethibng, otherwise you'll drop out of the locking range along the pink line.
- The DC alignment was not optimal despite dither alignment. [ITMX, ETMX] could have been centered around [-6.4, -27.2 urad] (instead of [-6.28, -28.12]). Not sure what to make out of this, as the dither servo was going on and off each one second.
- A factor of 2 or 3 improvement will make ITM great, but ETM needs more (but note that the data was when it was bad).
Note that this is dependent on RF sideband frequency.
Note the bogus or inconsistent sign convention of OLs.
For ETM, when the optic tilts down (increase in PIT slider), OL PIT increases, while for ITM OL PIT decreases.
That's the reason why the hard (differential) mode is parallel to the line ETMX=ITMX.