hugh.radkins@LIGO.ORG - posted 17:56, Friday 07 February 2014 (9924)
ITMY ISI X-Tilt Decoupling (CPS_Align)
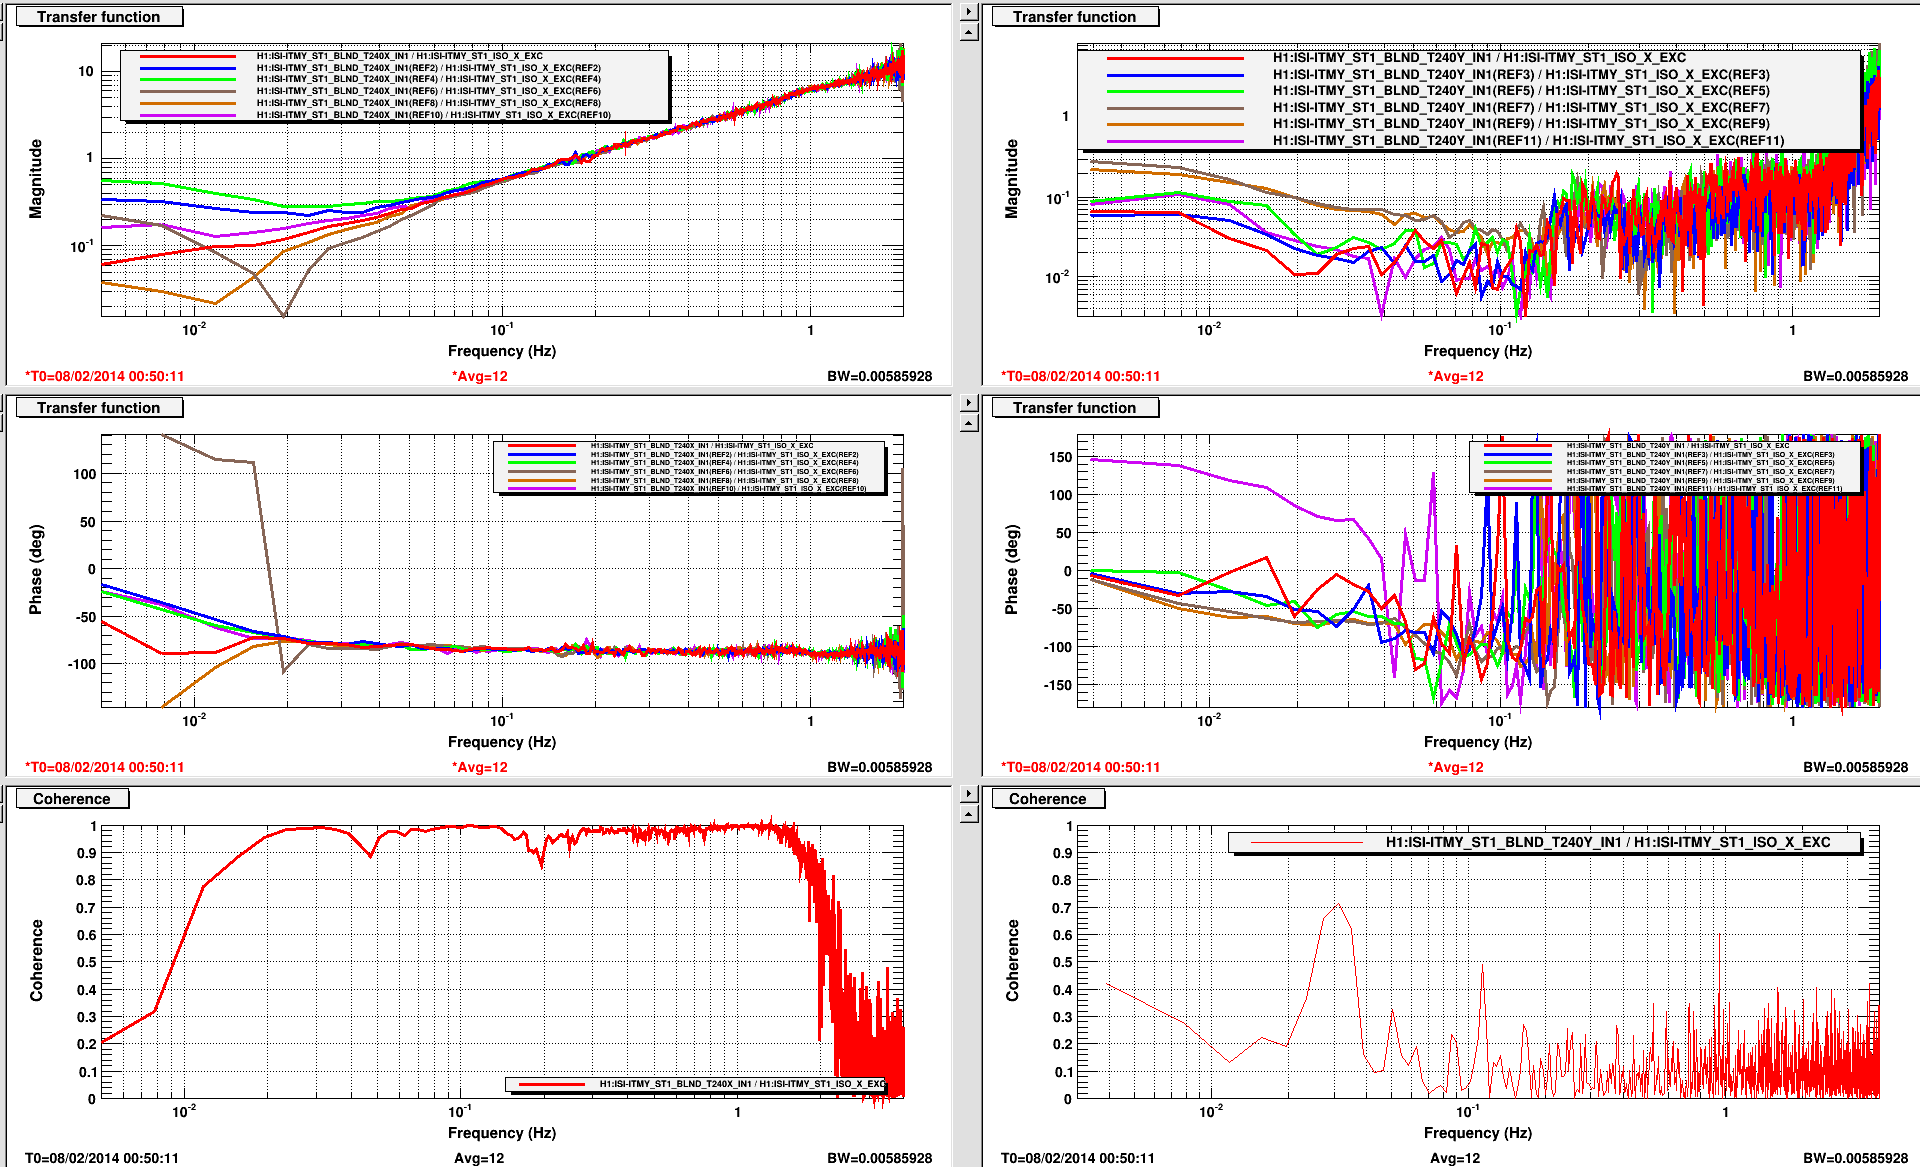
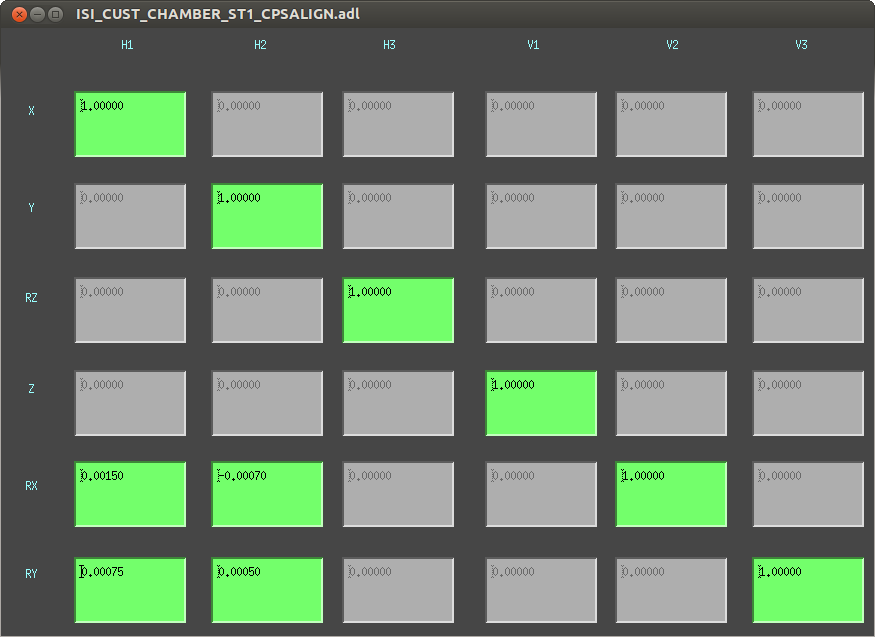
See attached for test progress and final result (Red Traces). The values for these corrections are 0.0015 & 0.00075 for XtoRX & XtoRY respectively.
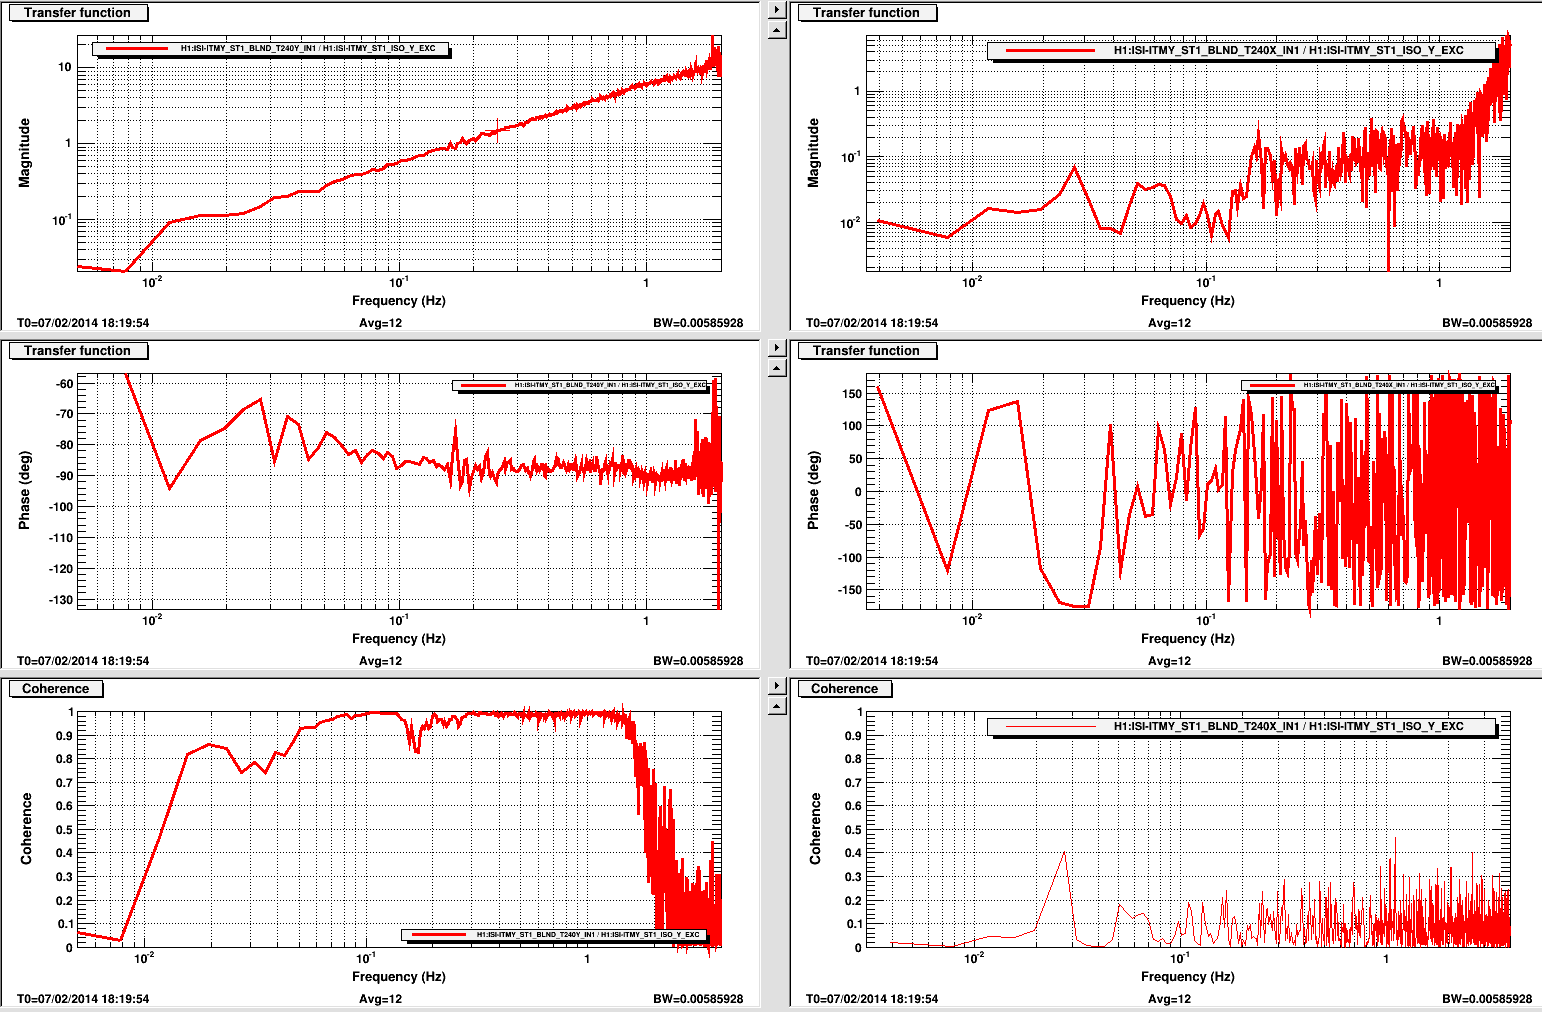
The values for ITMY Y-Tilt are -0.0007 & 0.0005 for YtoRX & YtoRY. The second plot is for this drive axis. The plot isn't as busy or interesting but the results are slightly better in the cross term.
I'll attach the MEDM to just cause I can.
I'll try to get measurements to show the results that Rich & I have gotten on the other ISIs over the this frenzied week.
Images attached to this report