Filing a late report, last week I measured the resistance of the strain gauge on the PSAMS for ZM5 suspension in HAM7 chamber. This is to investigate the inconsistent behavior (voltage drop/open loop issues) of the strain gauge attached to the PSAMS on ZM5 - details posted in LHO alog 90783.
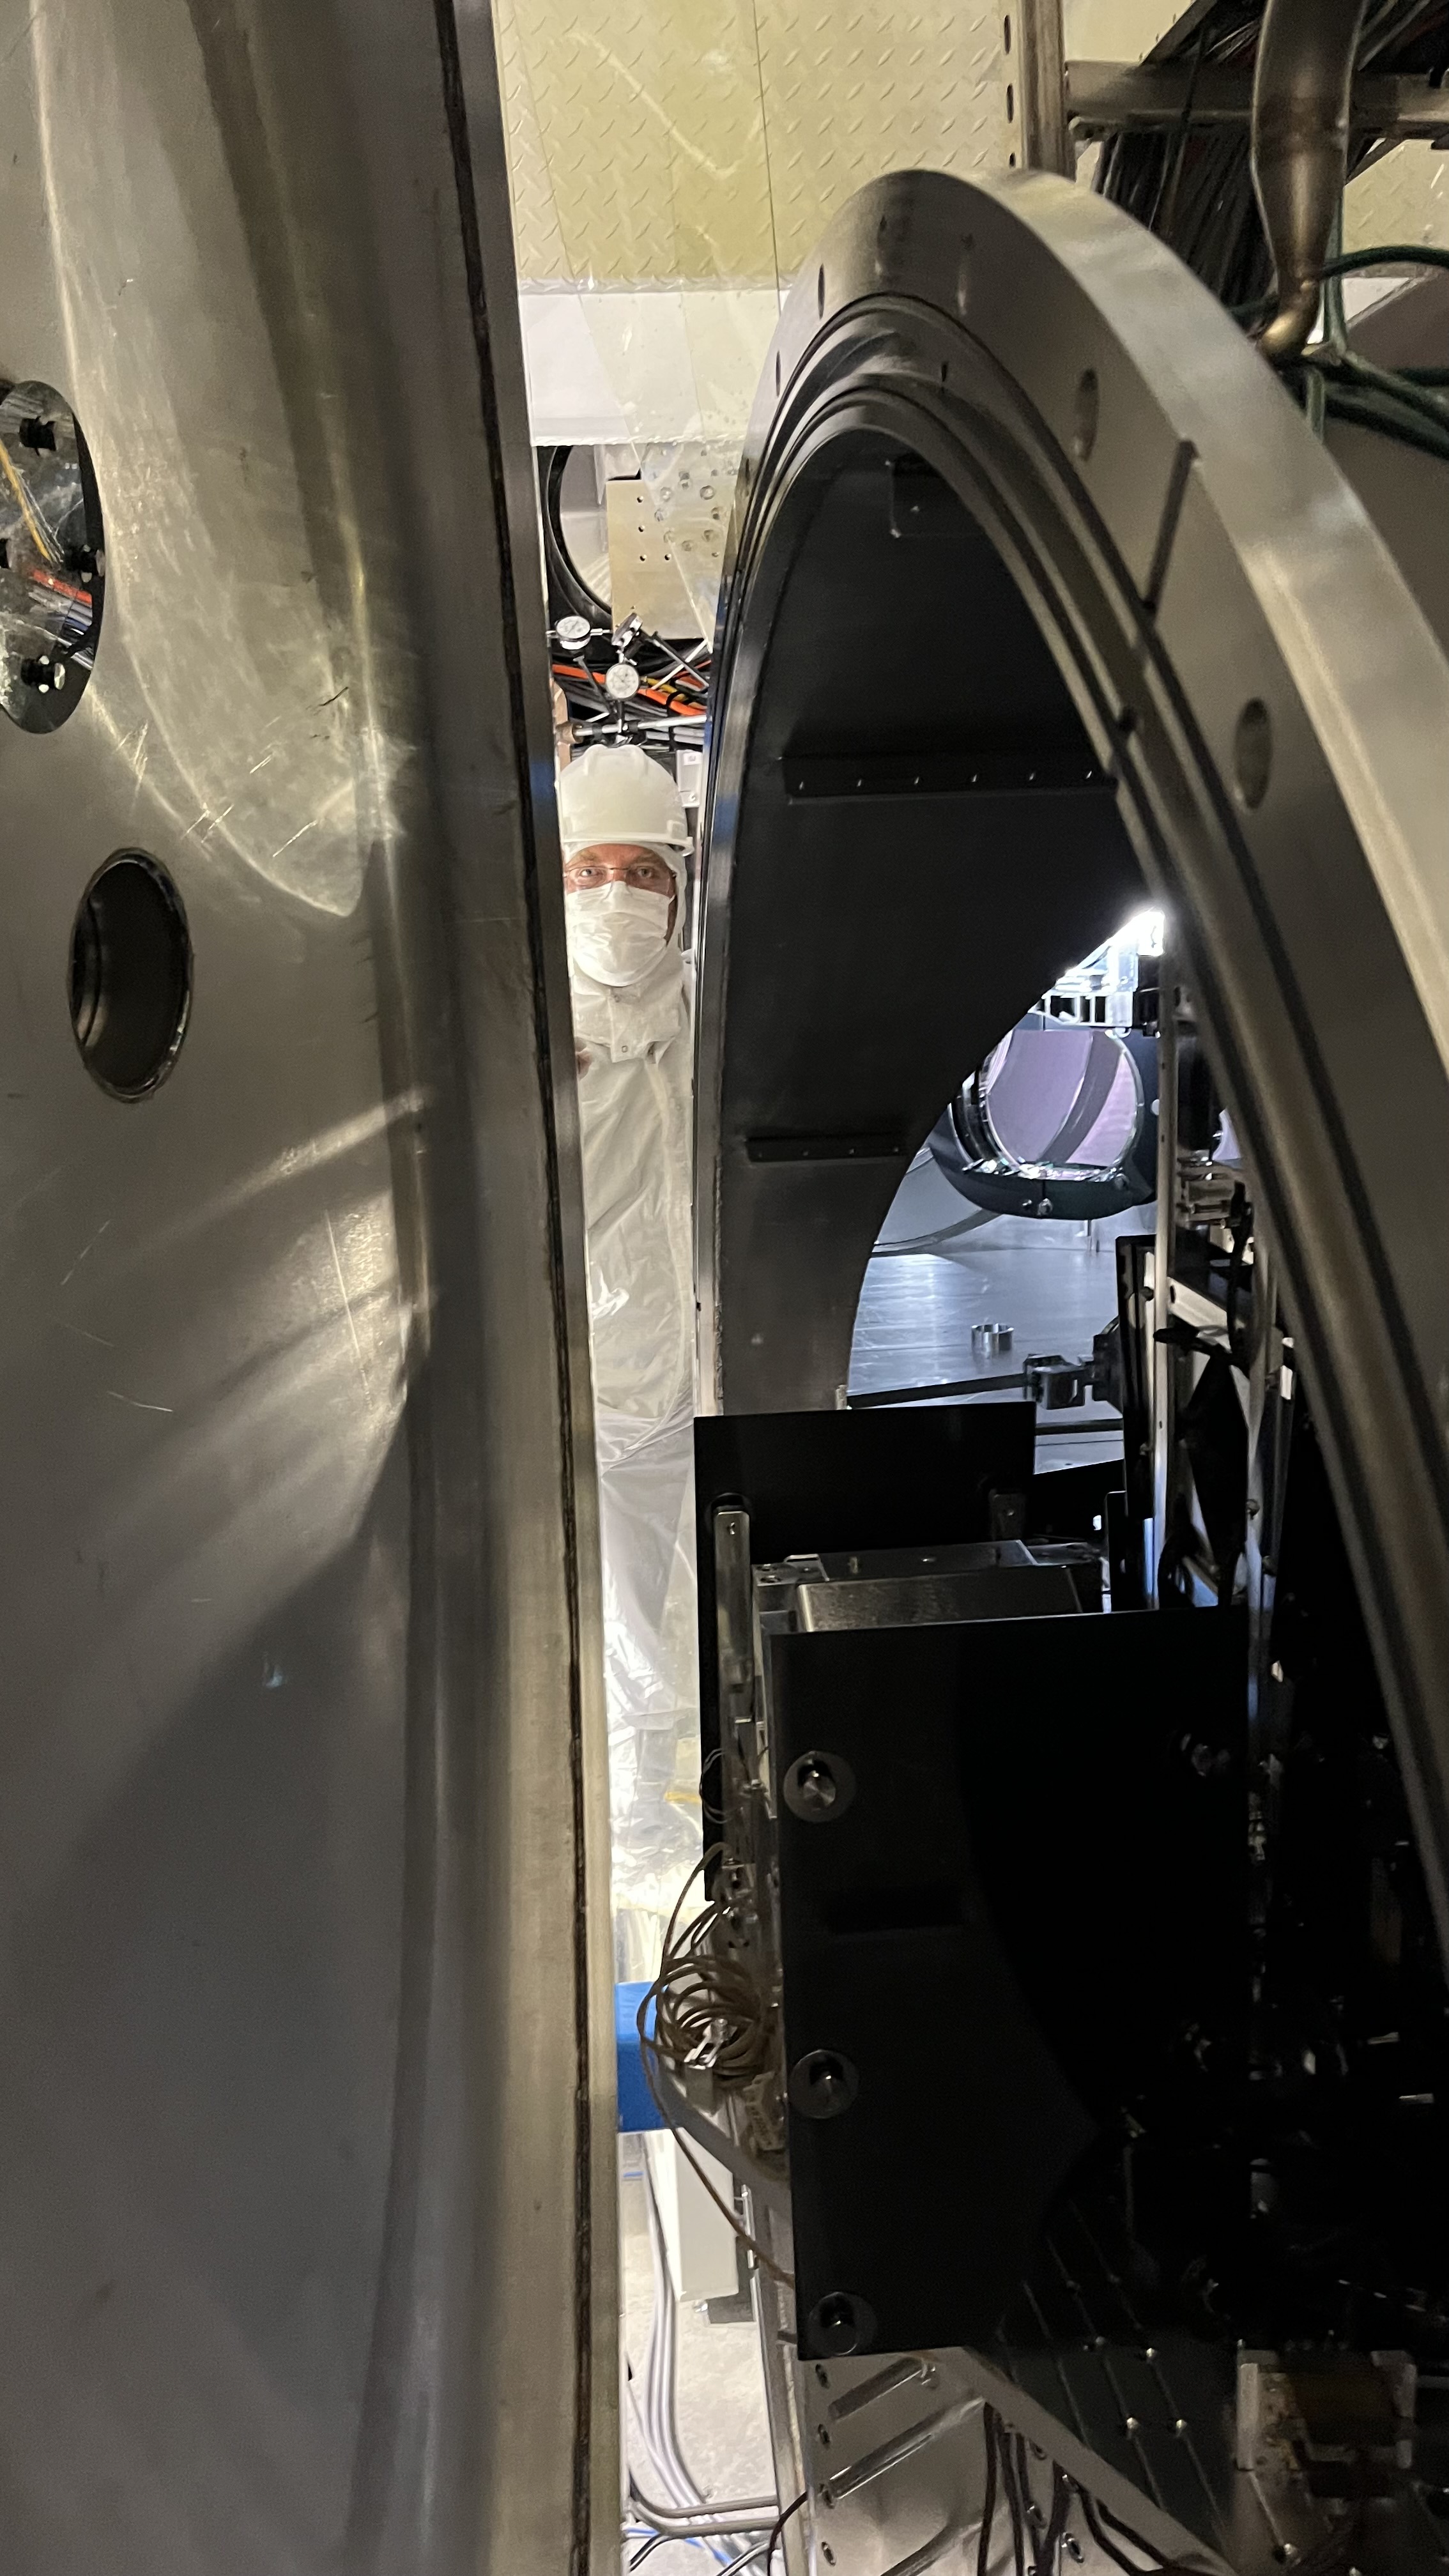
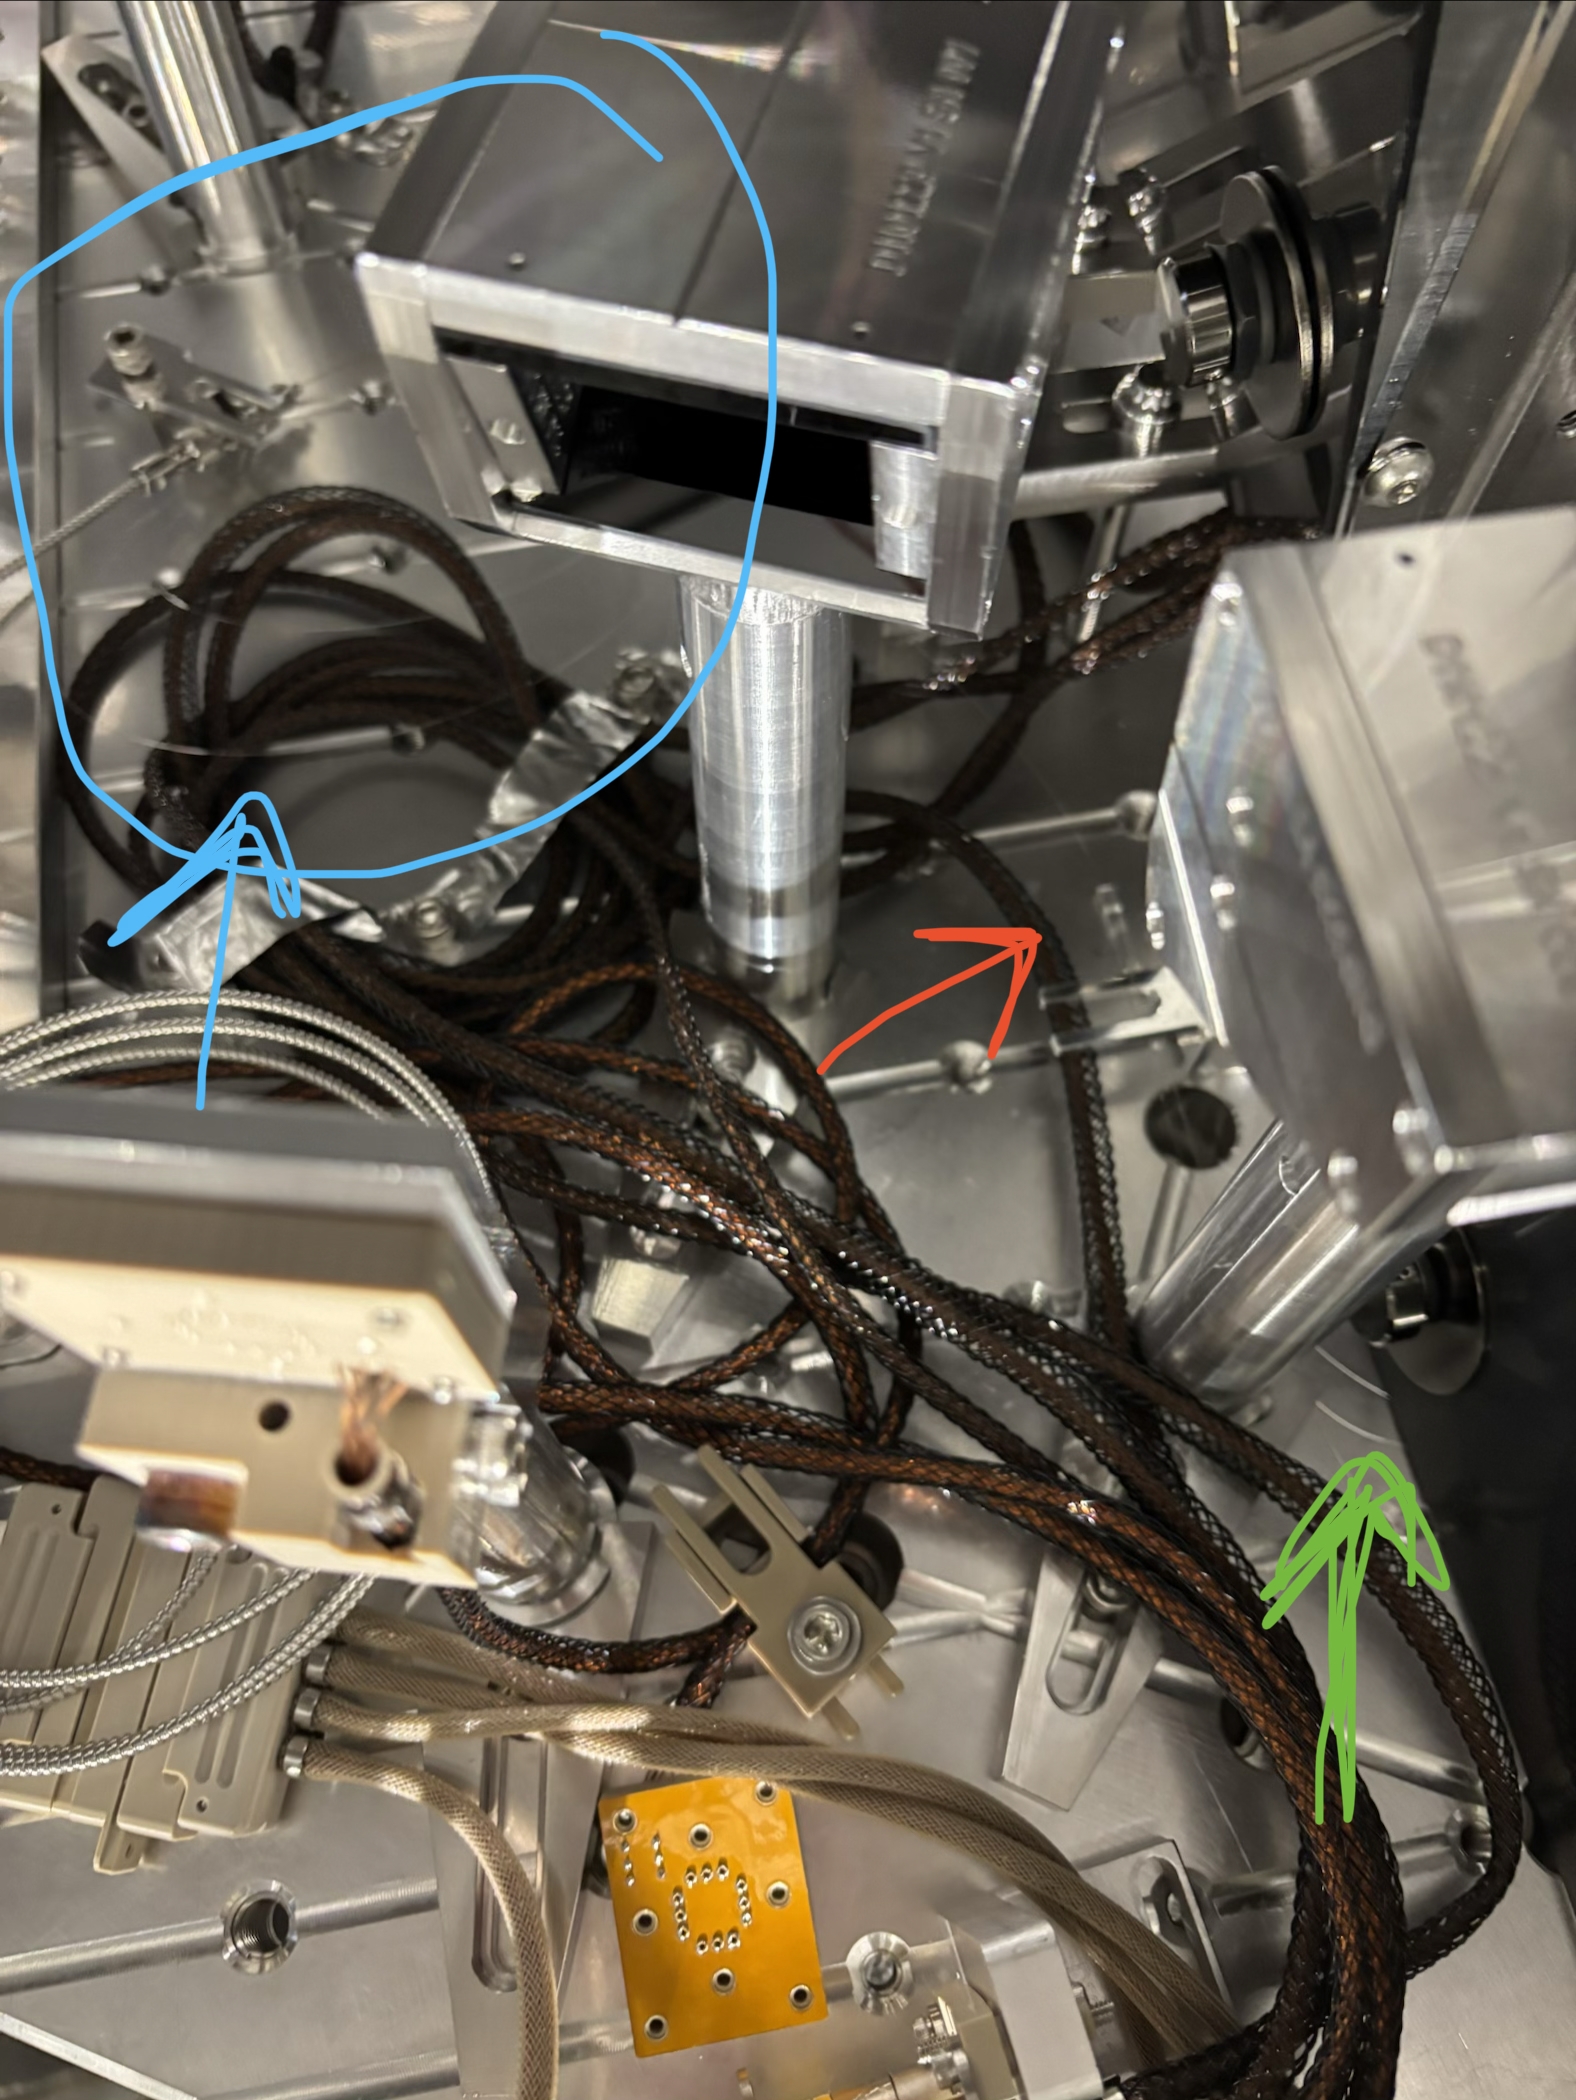
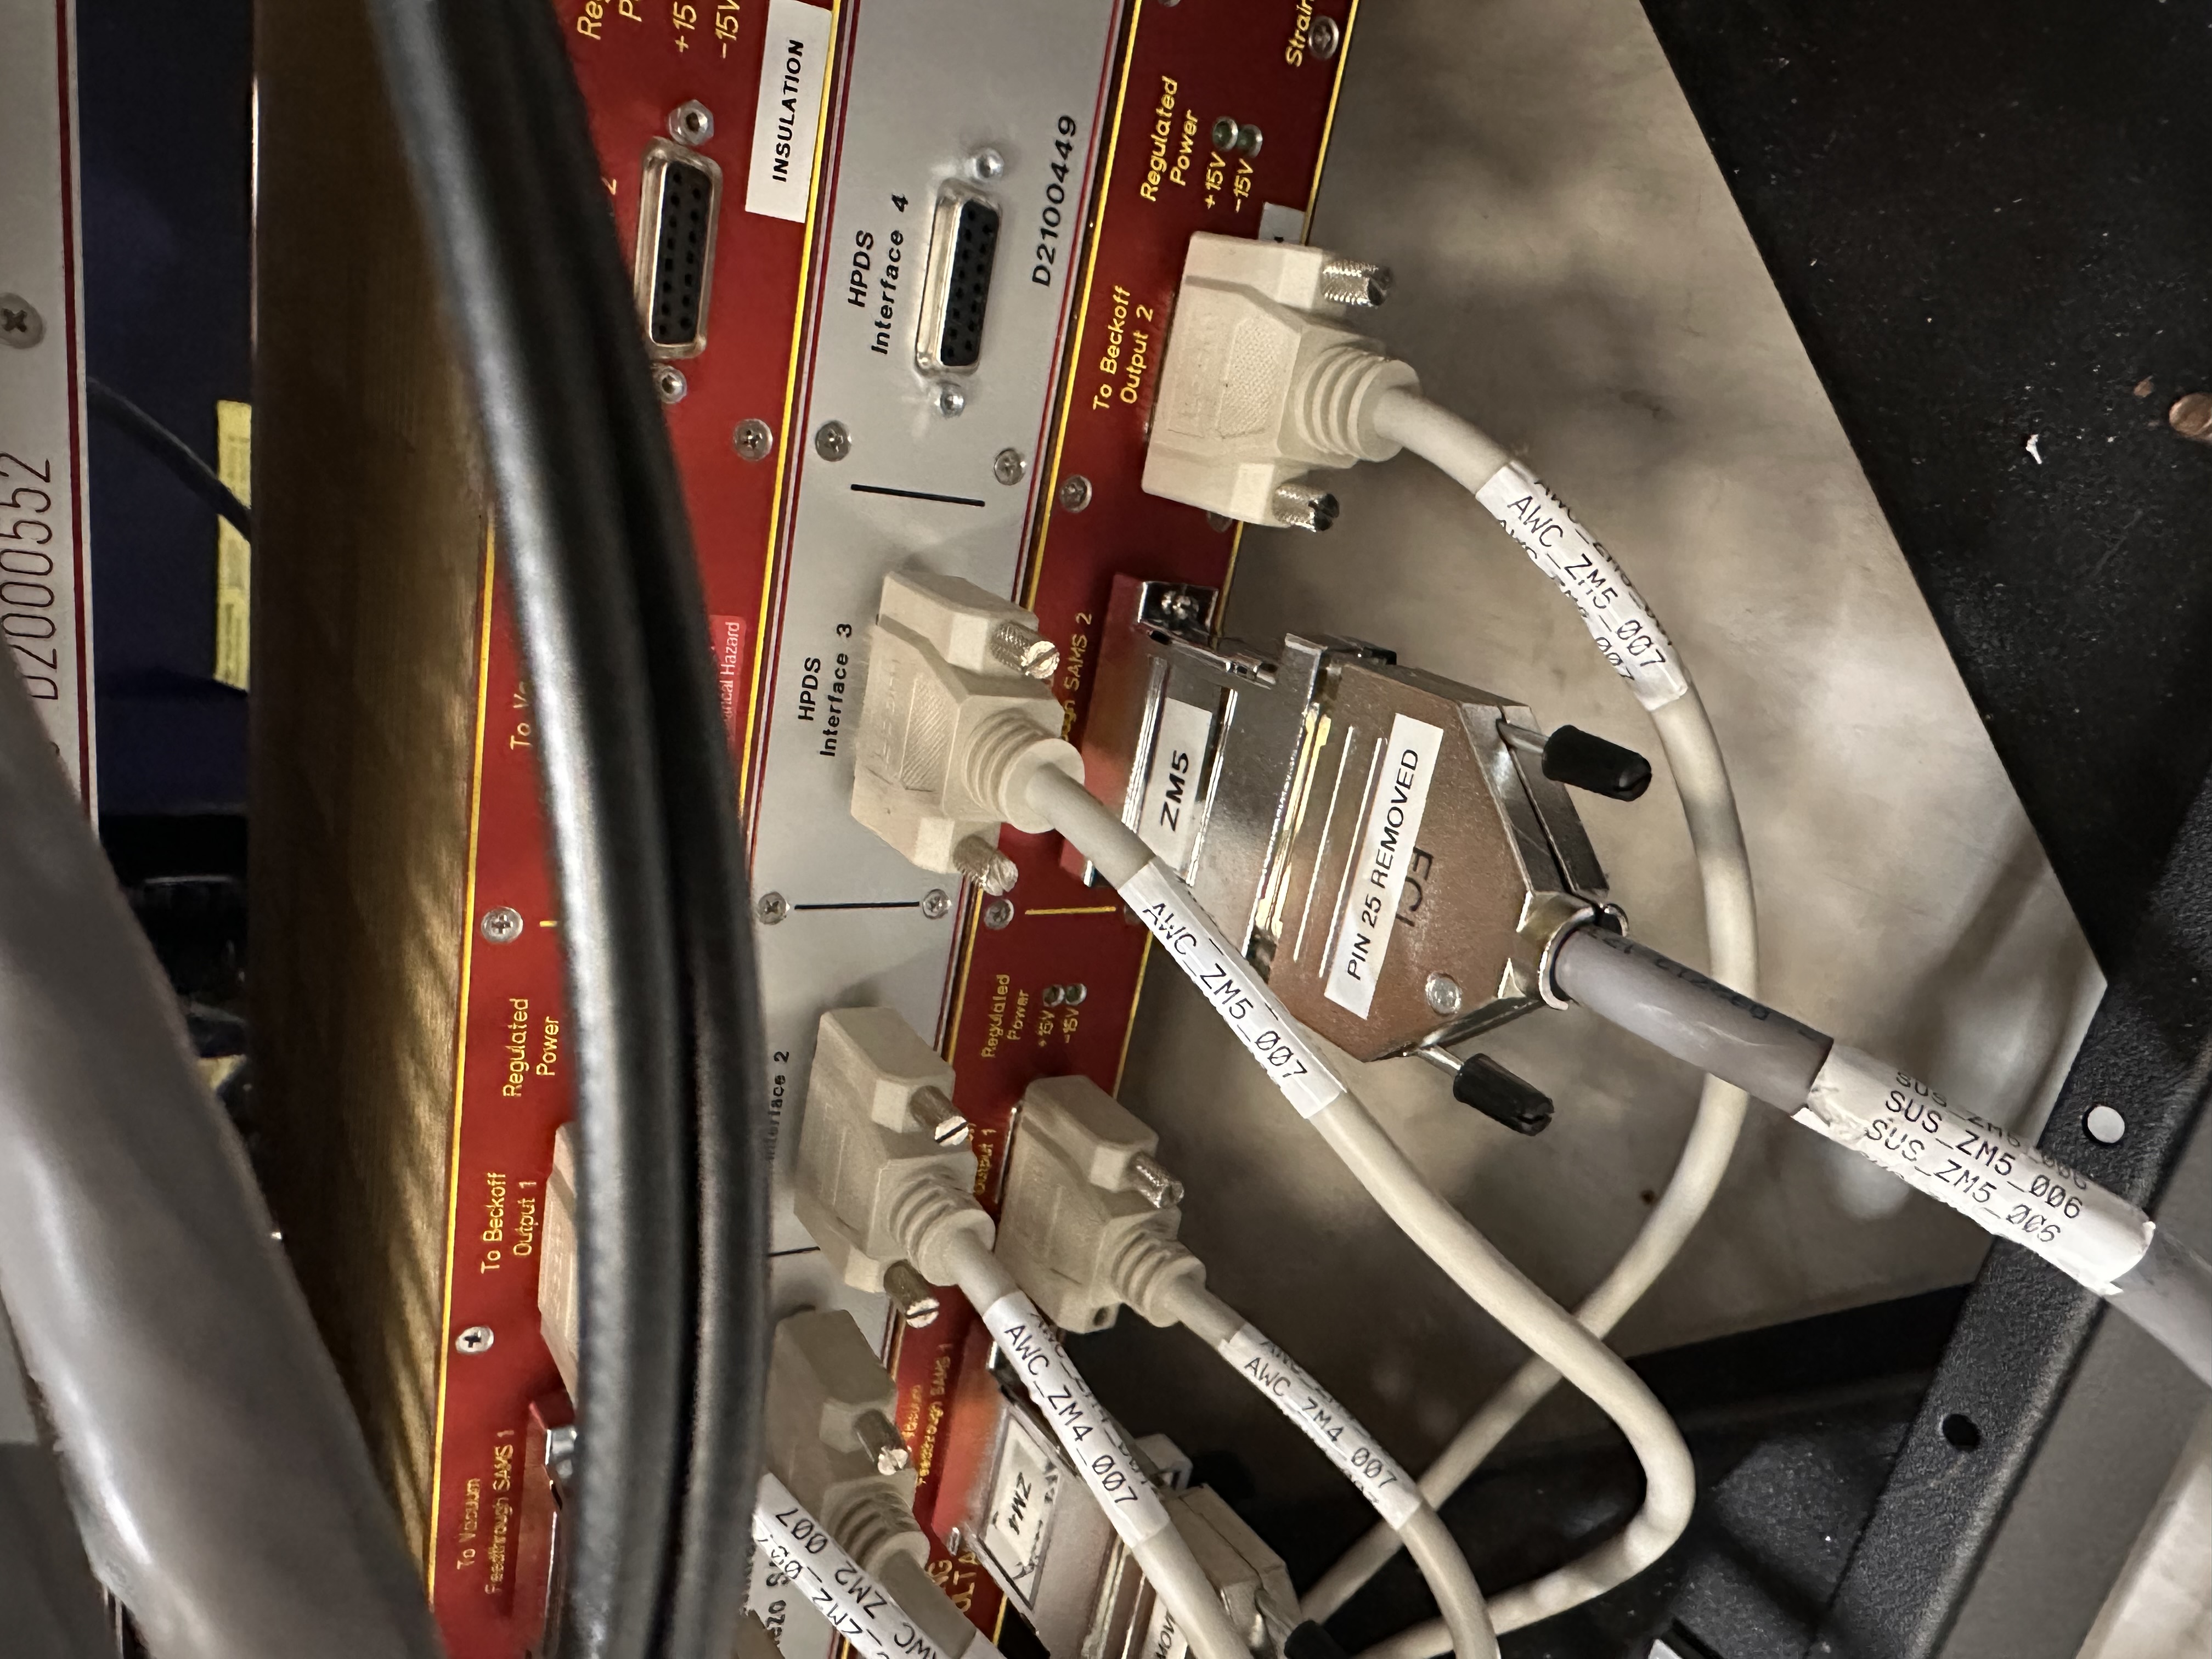
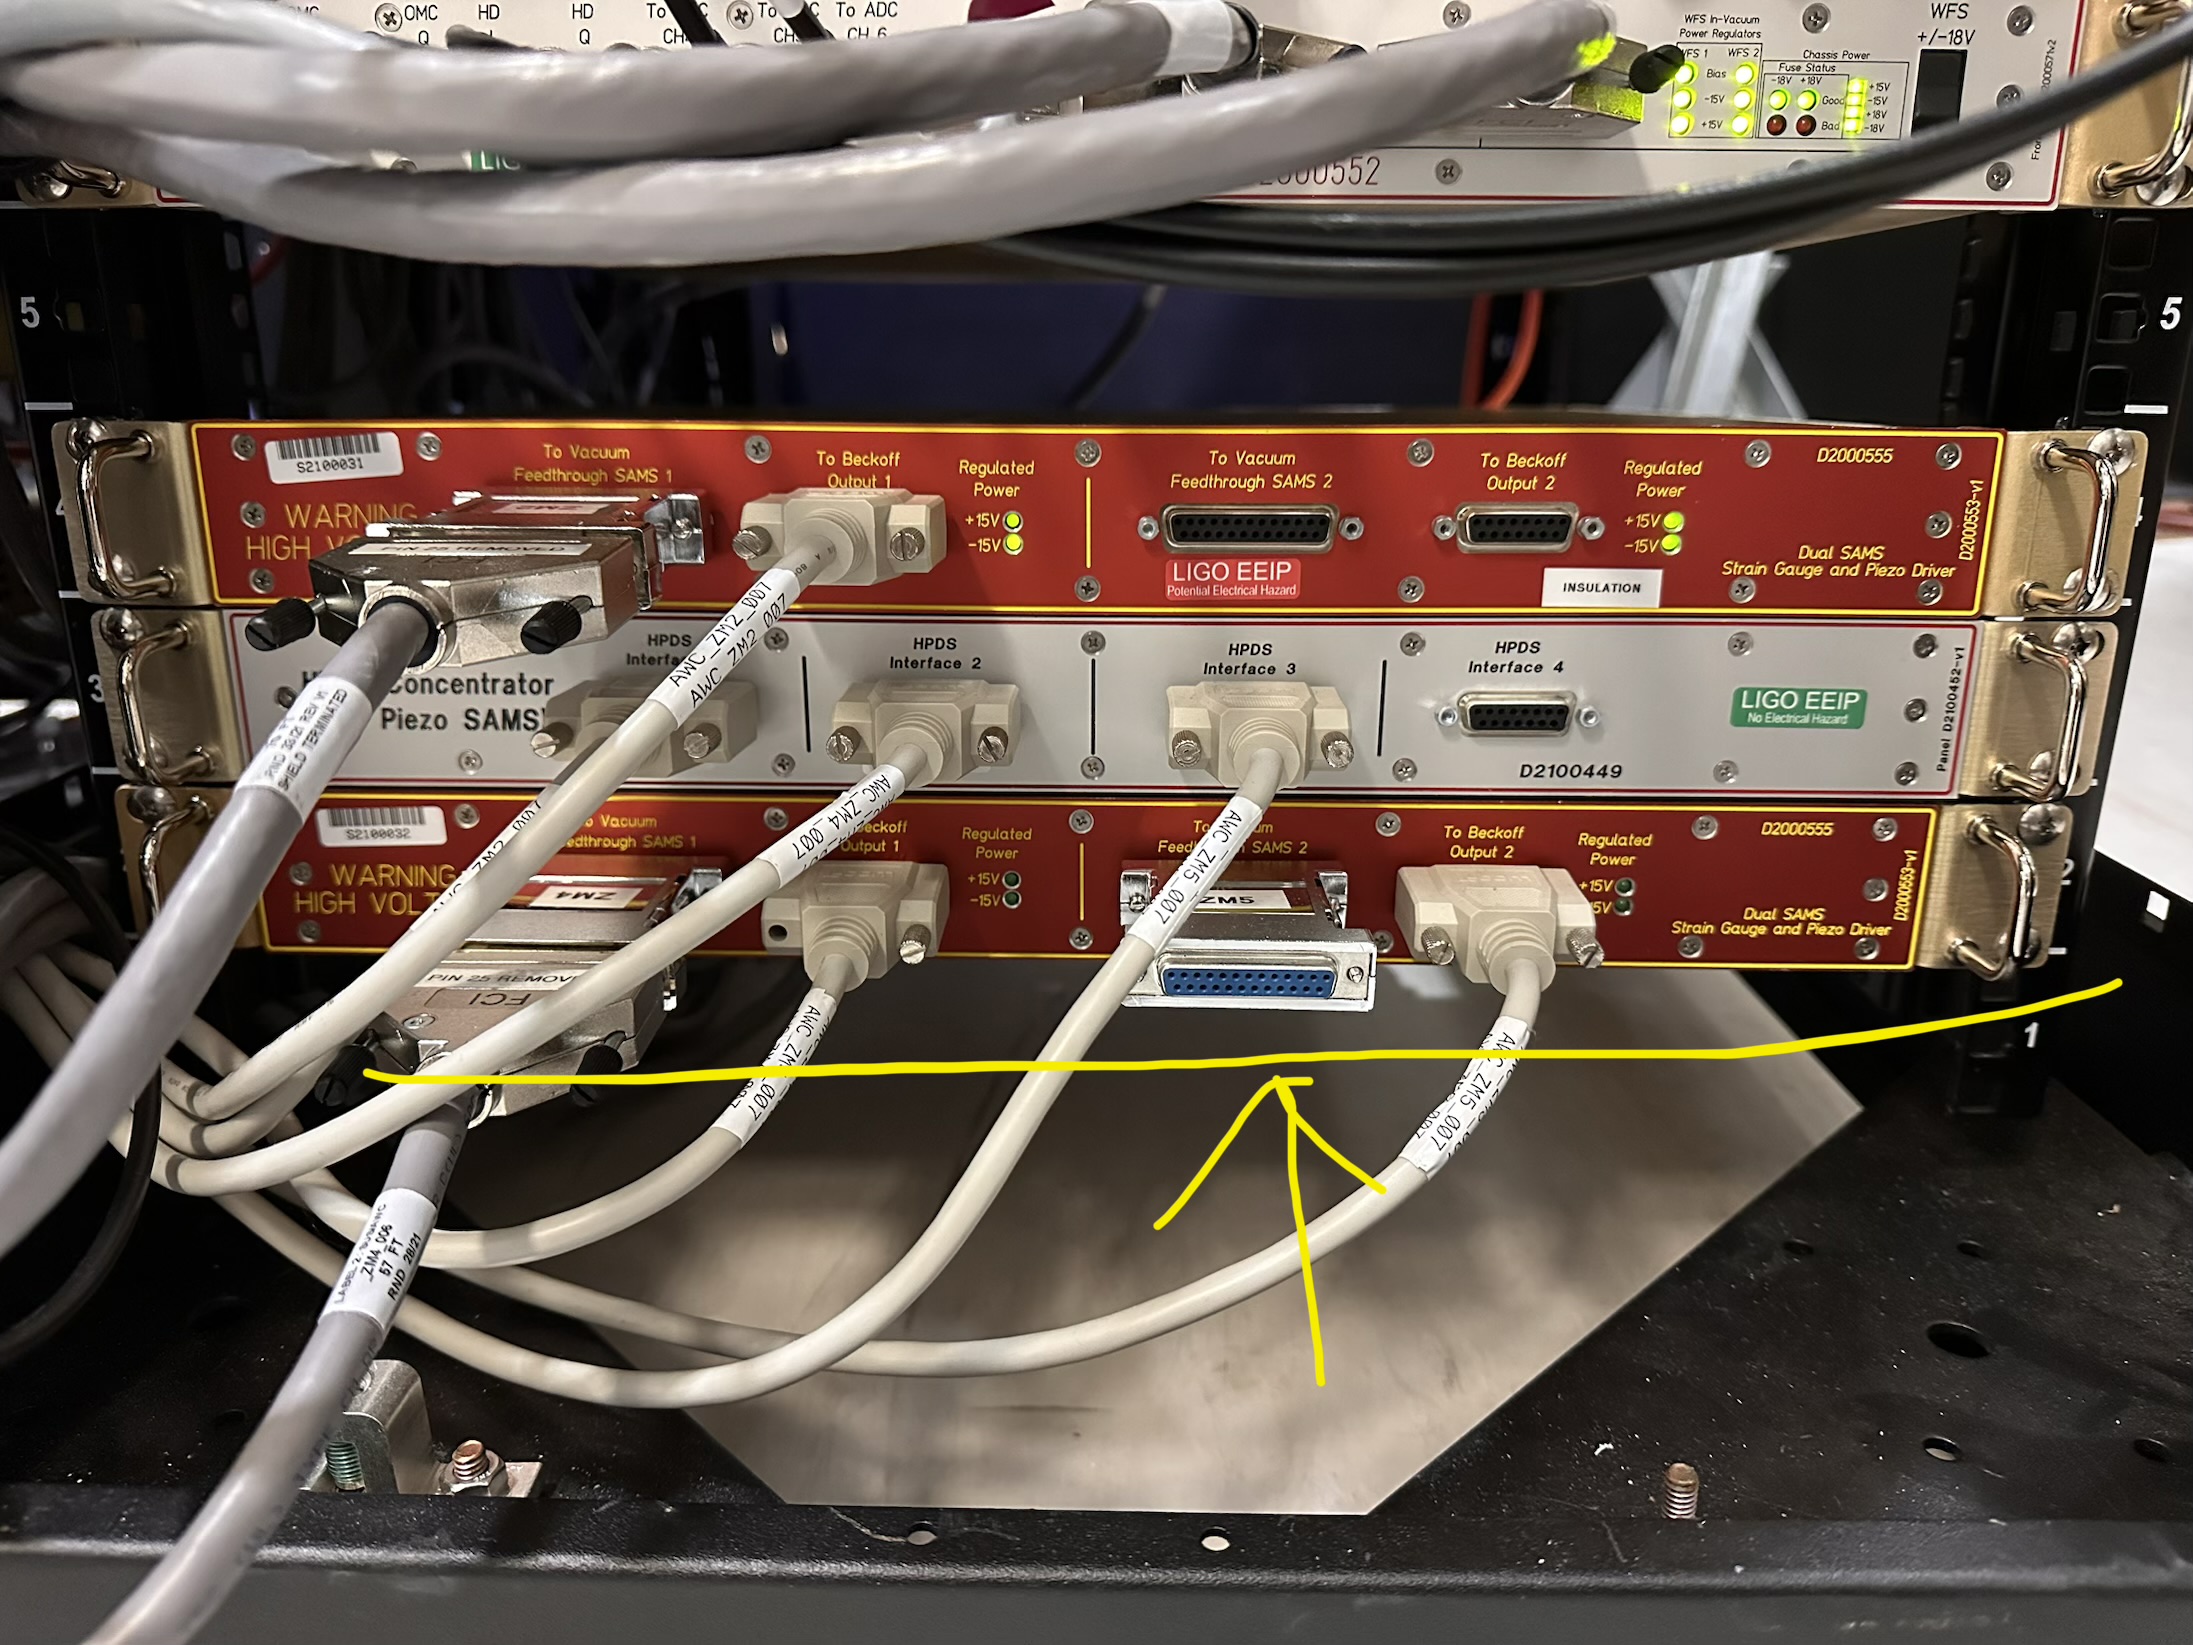
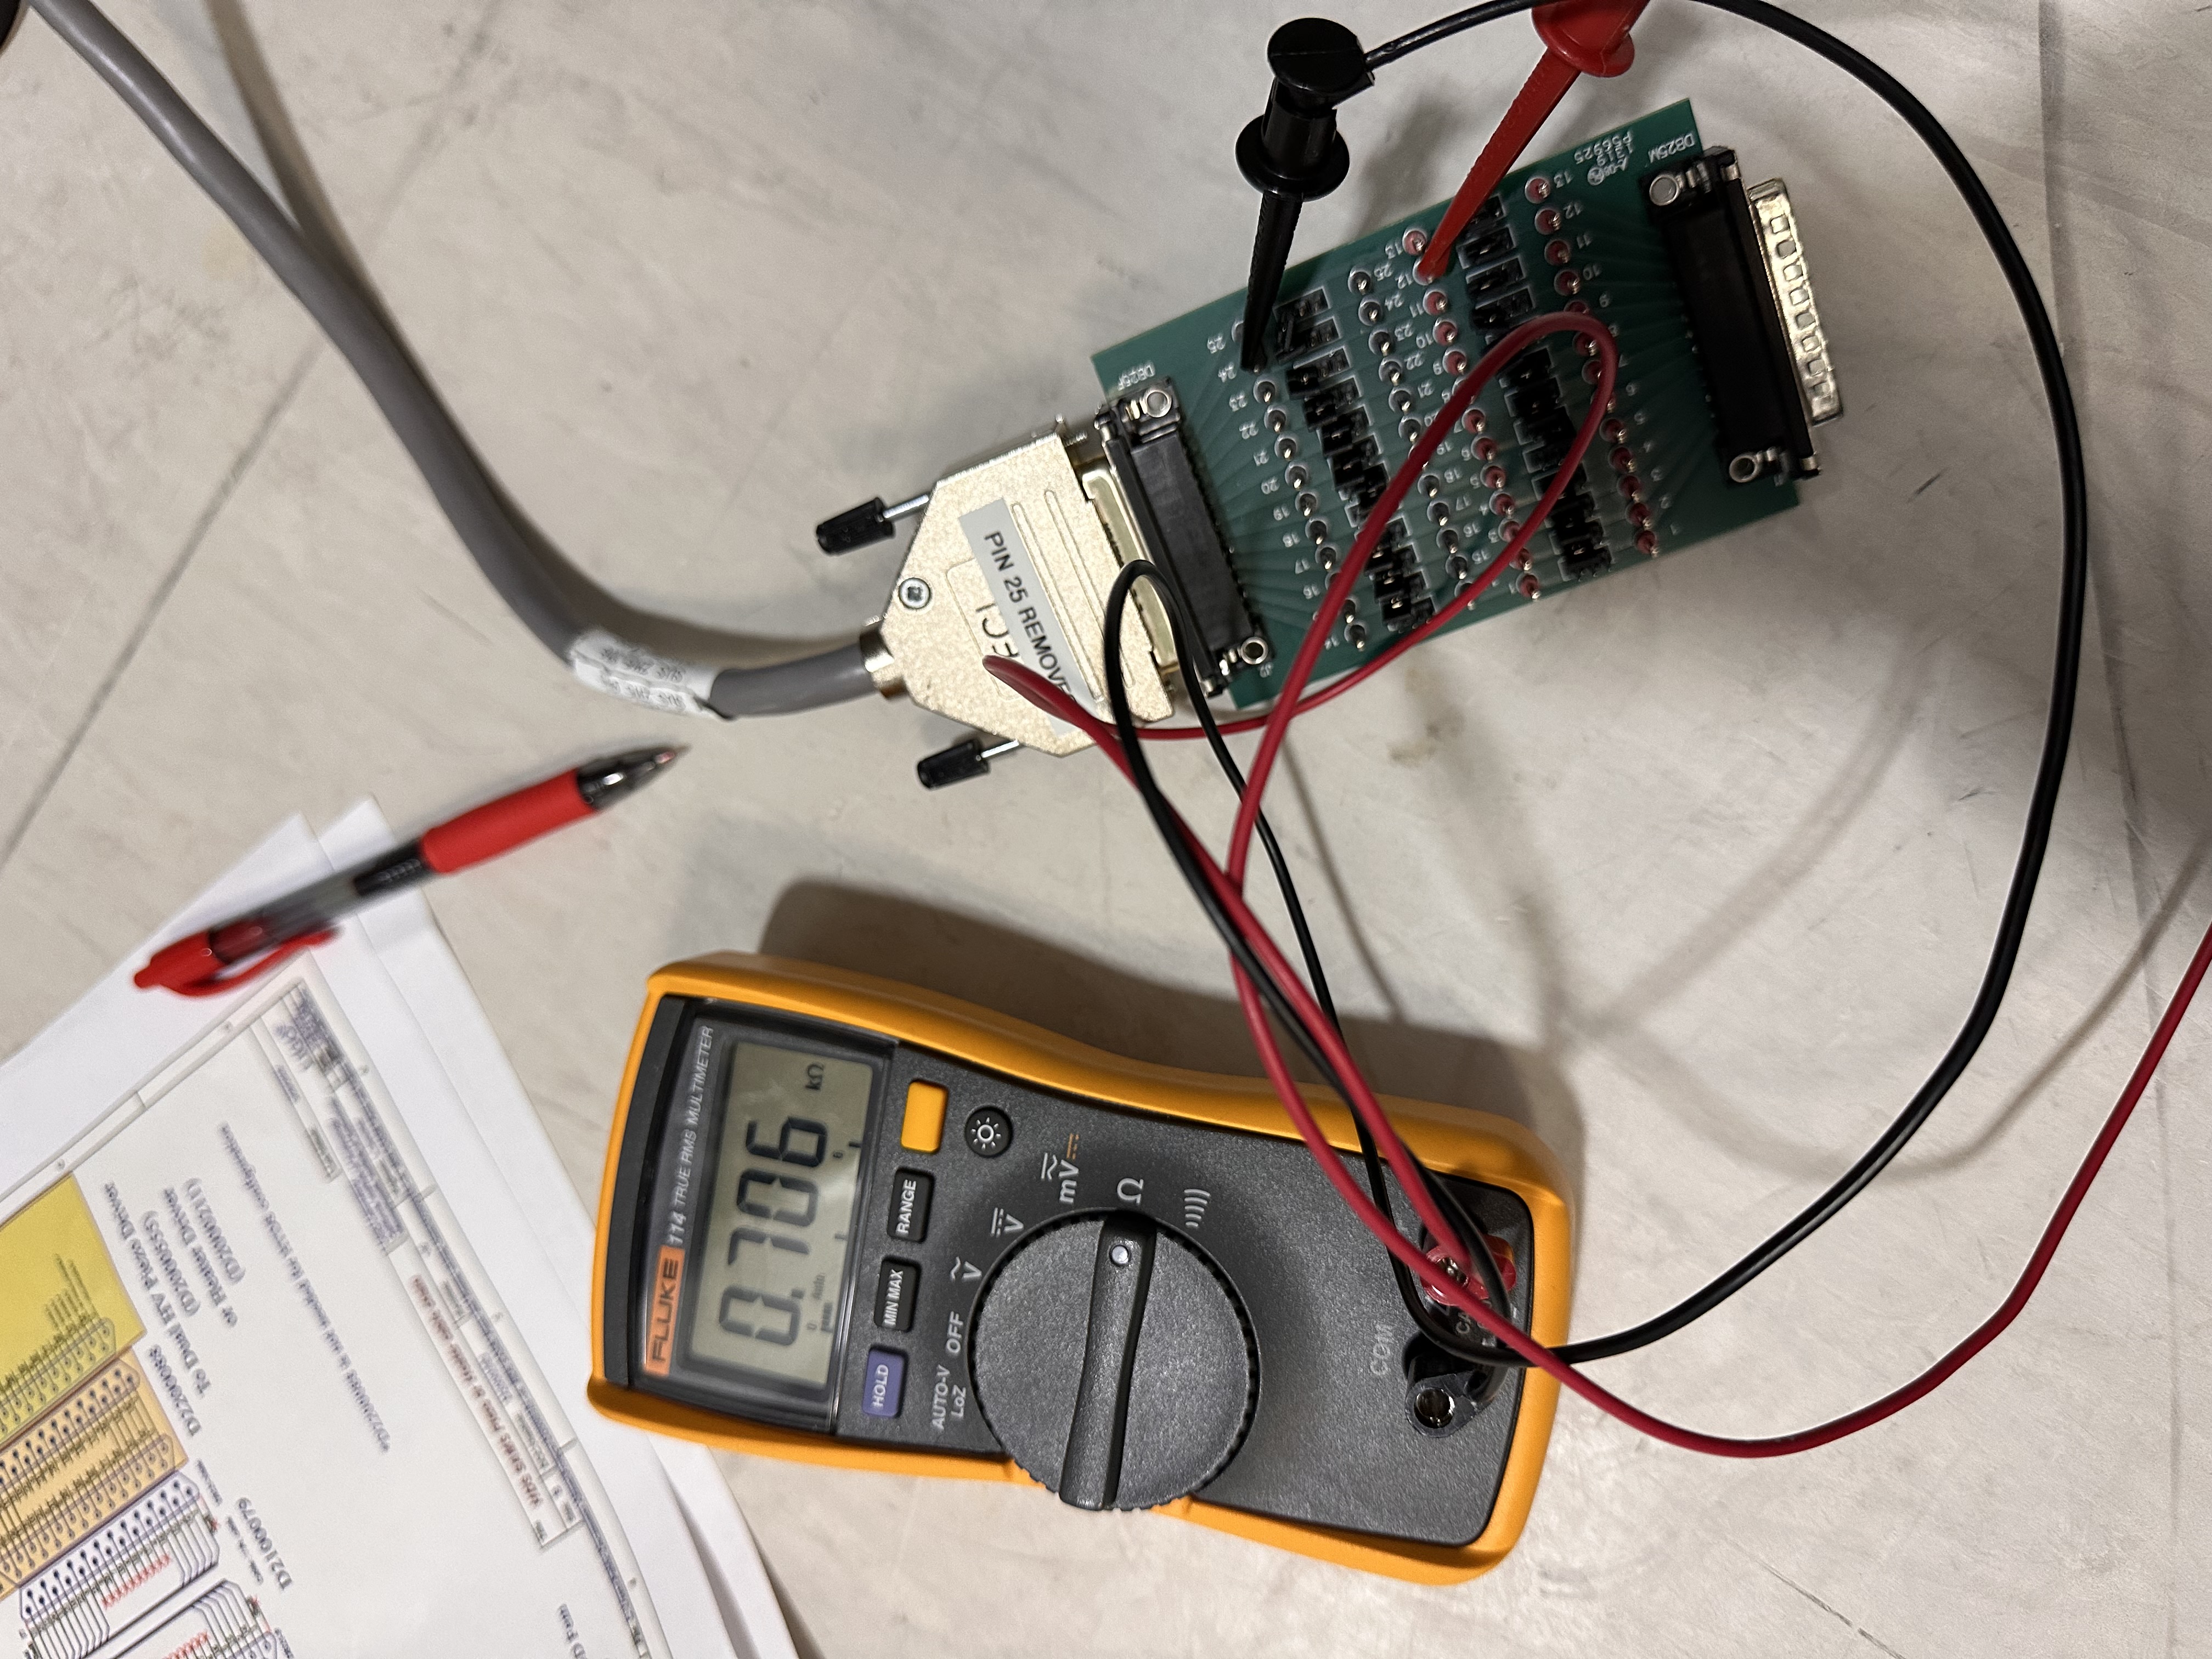
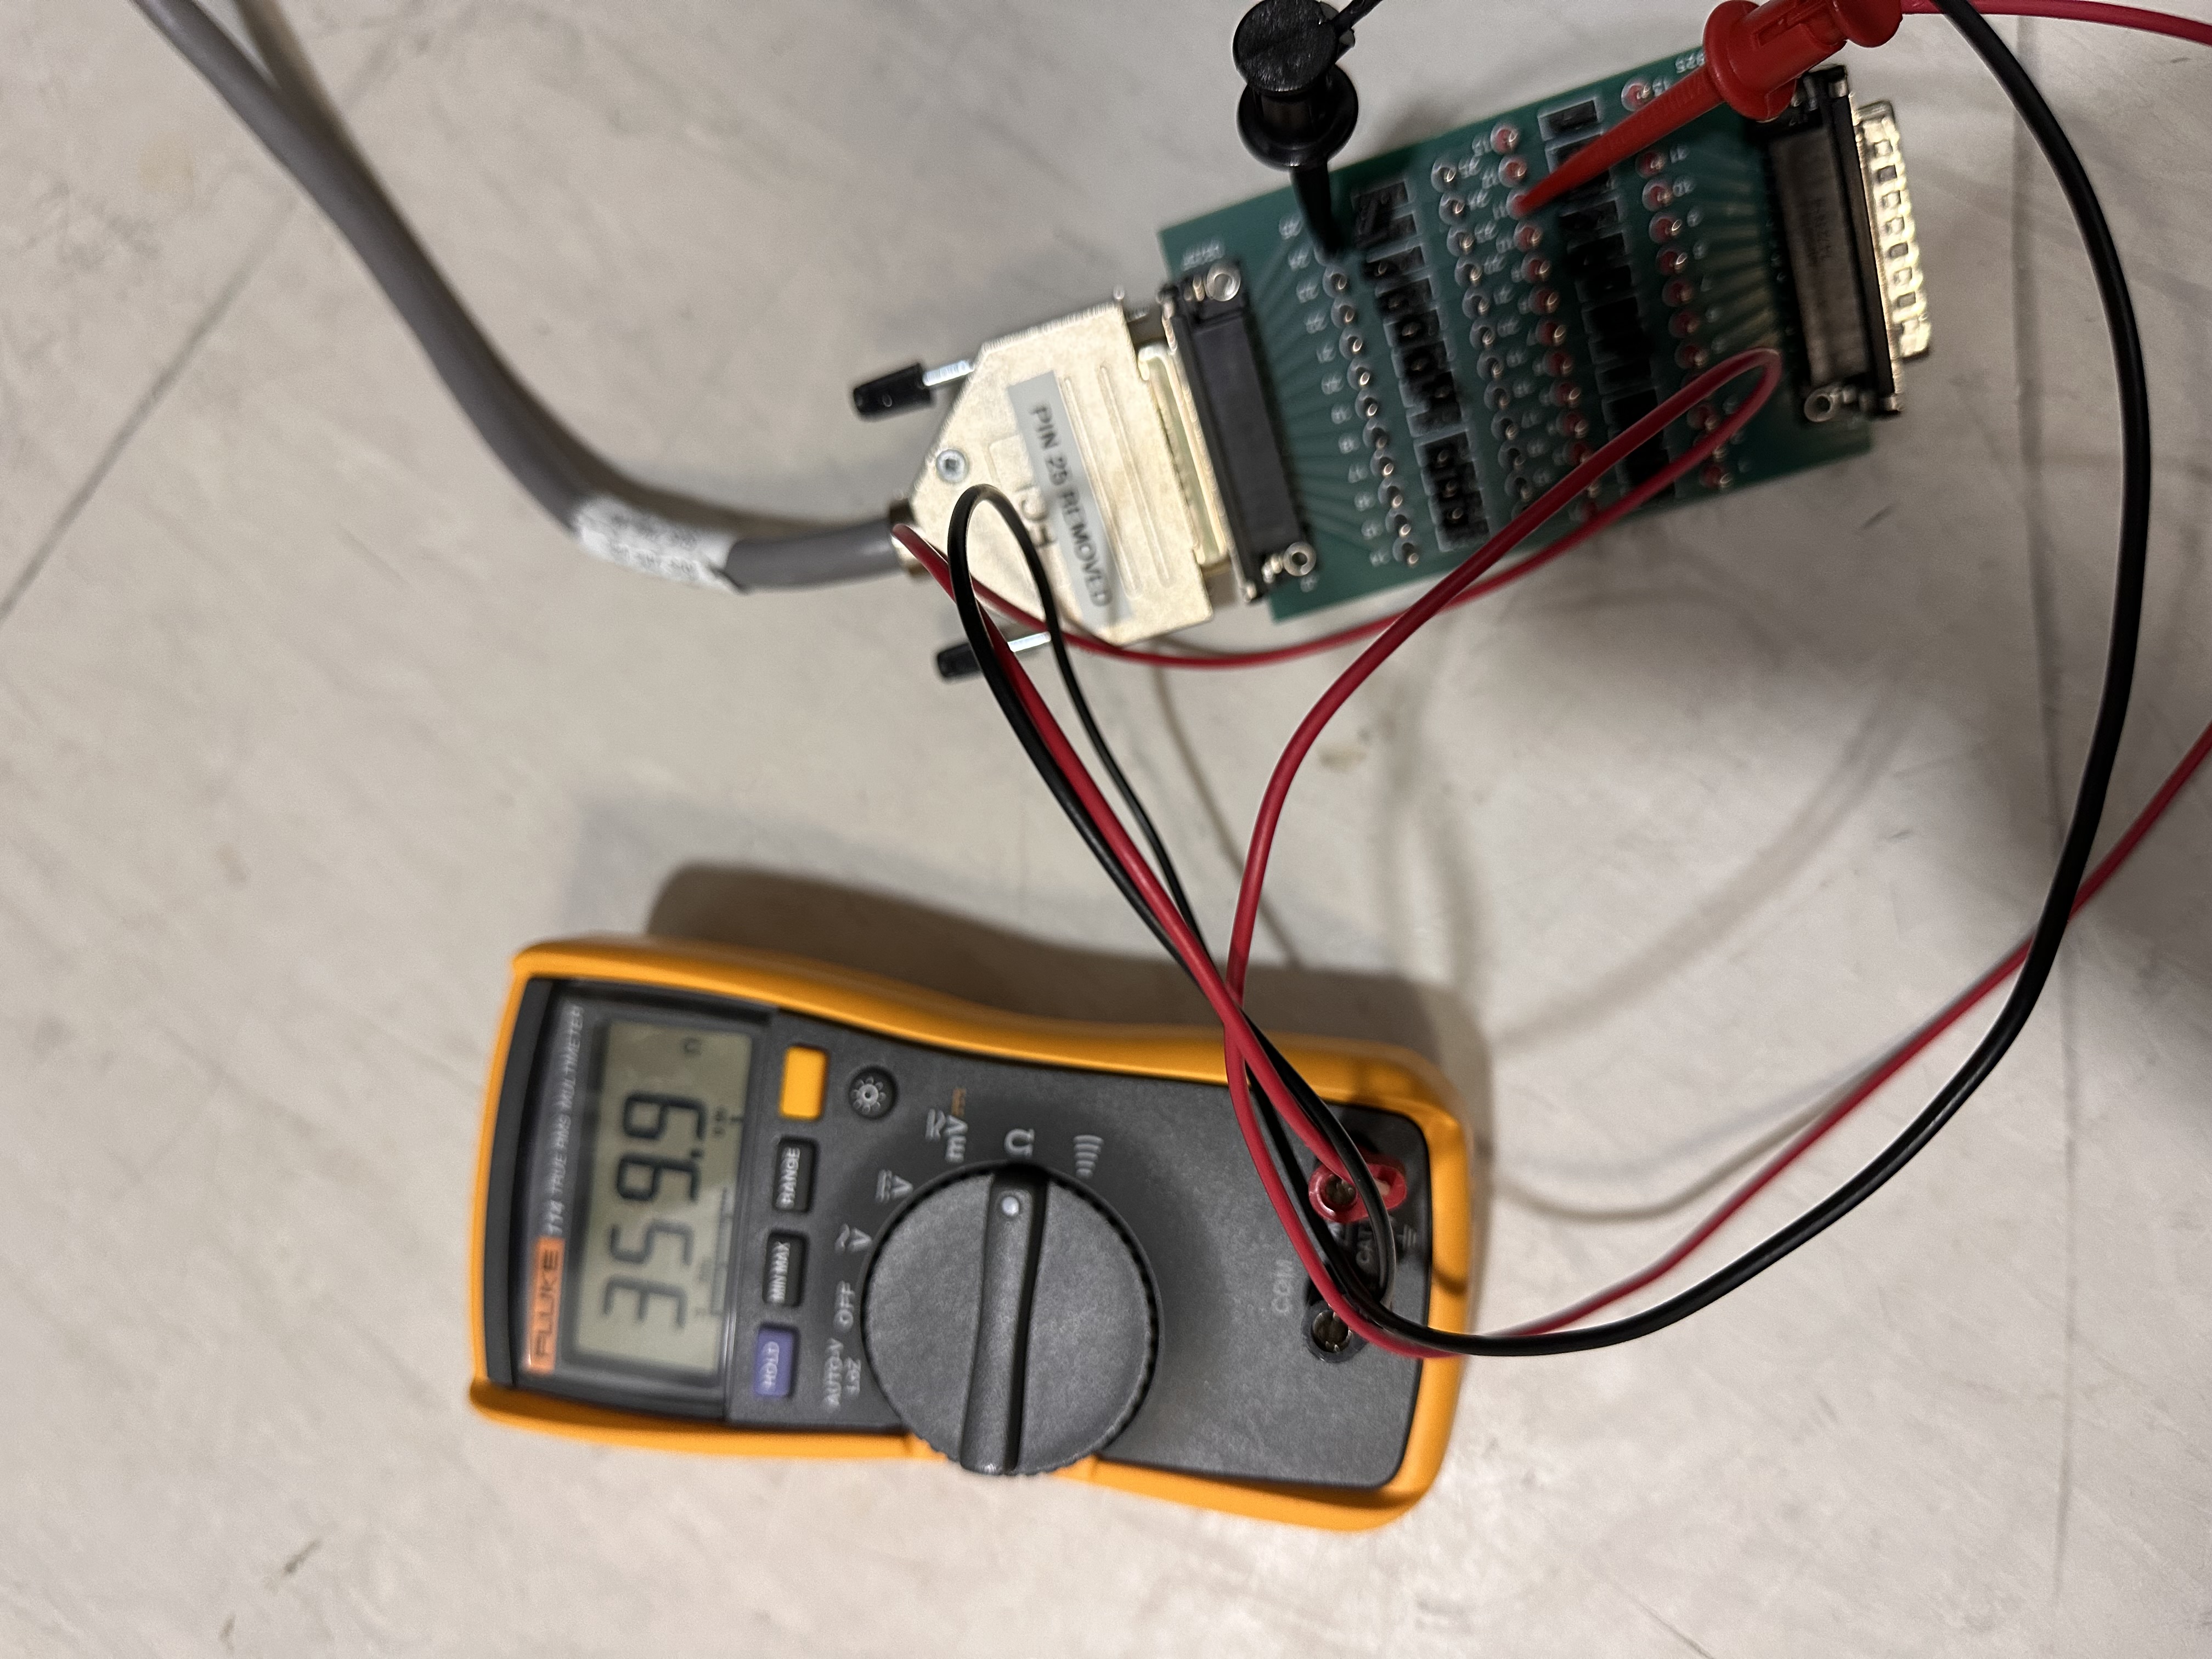
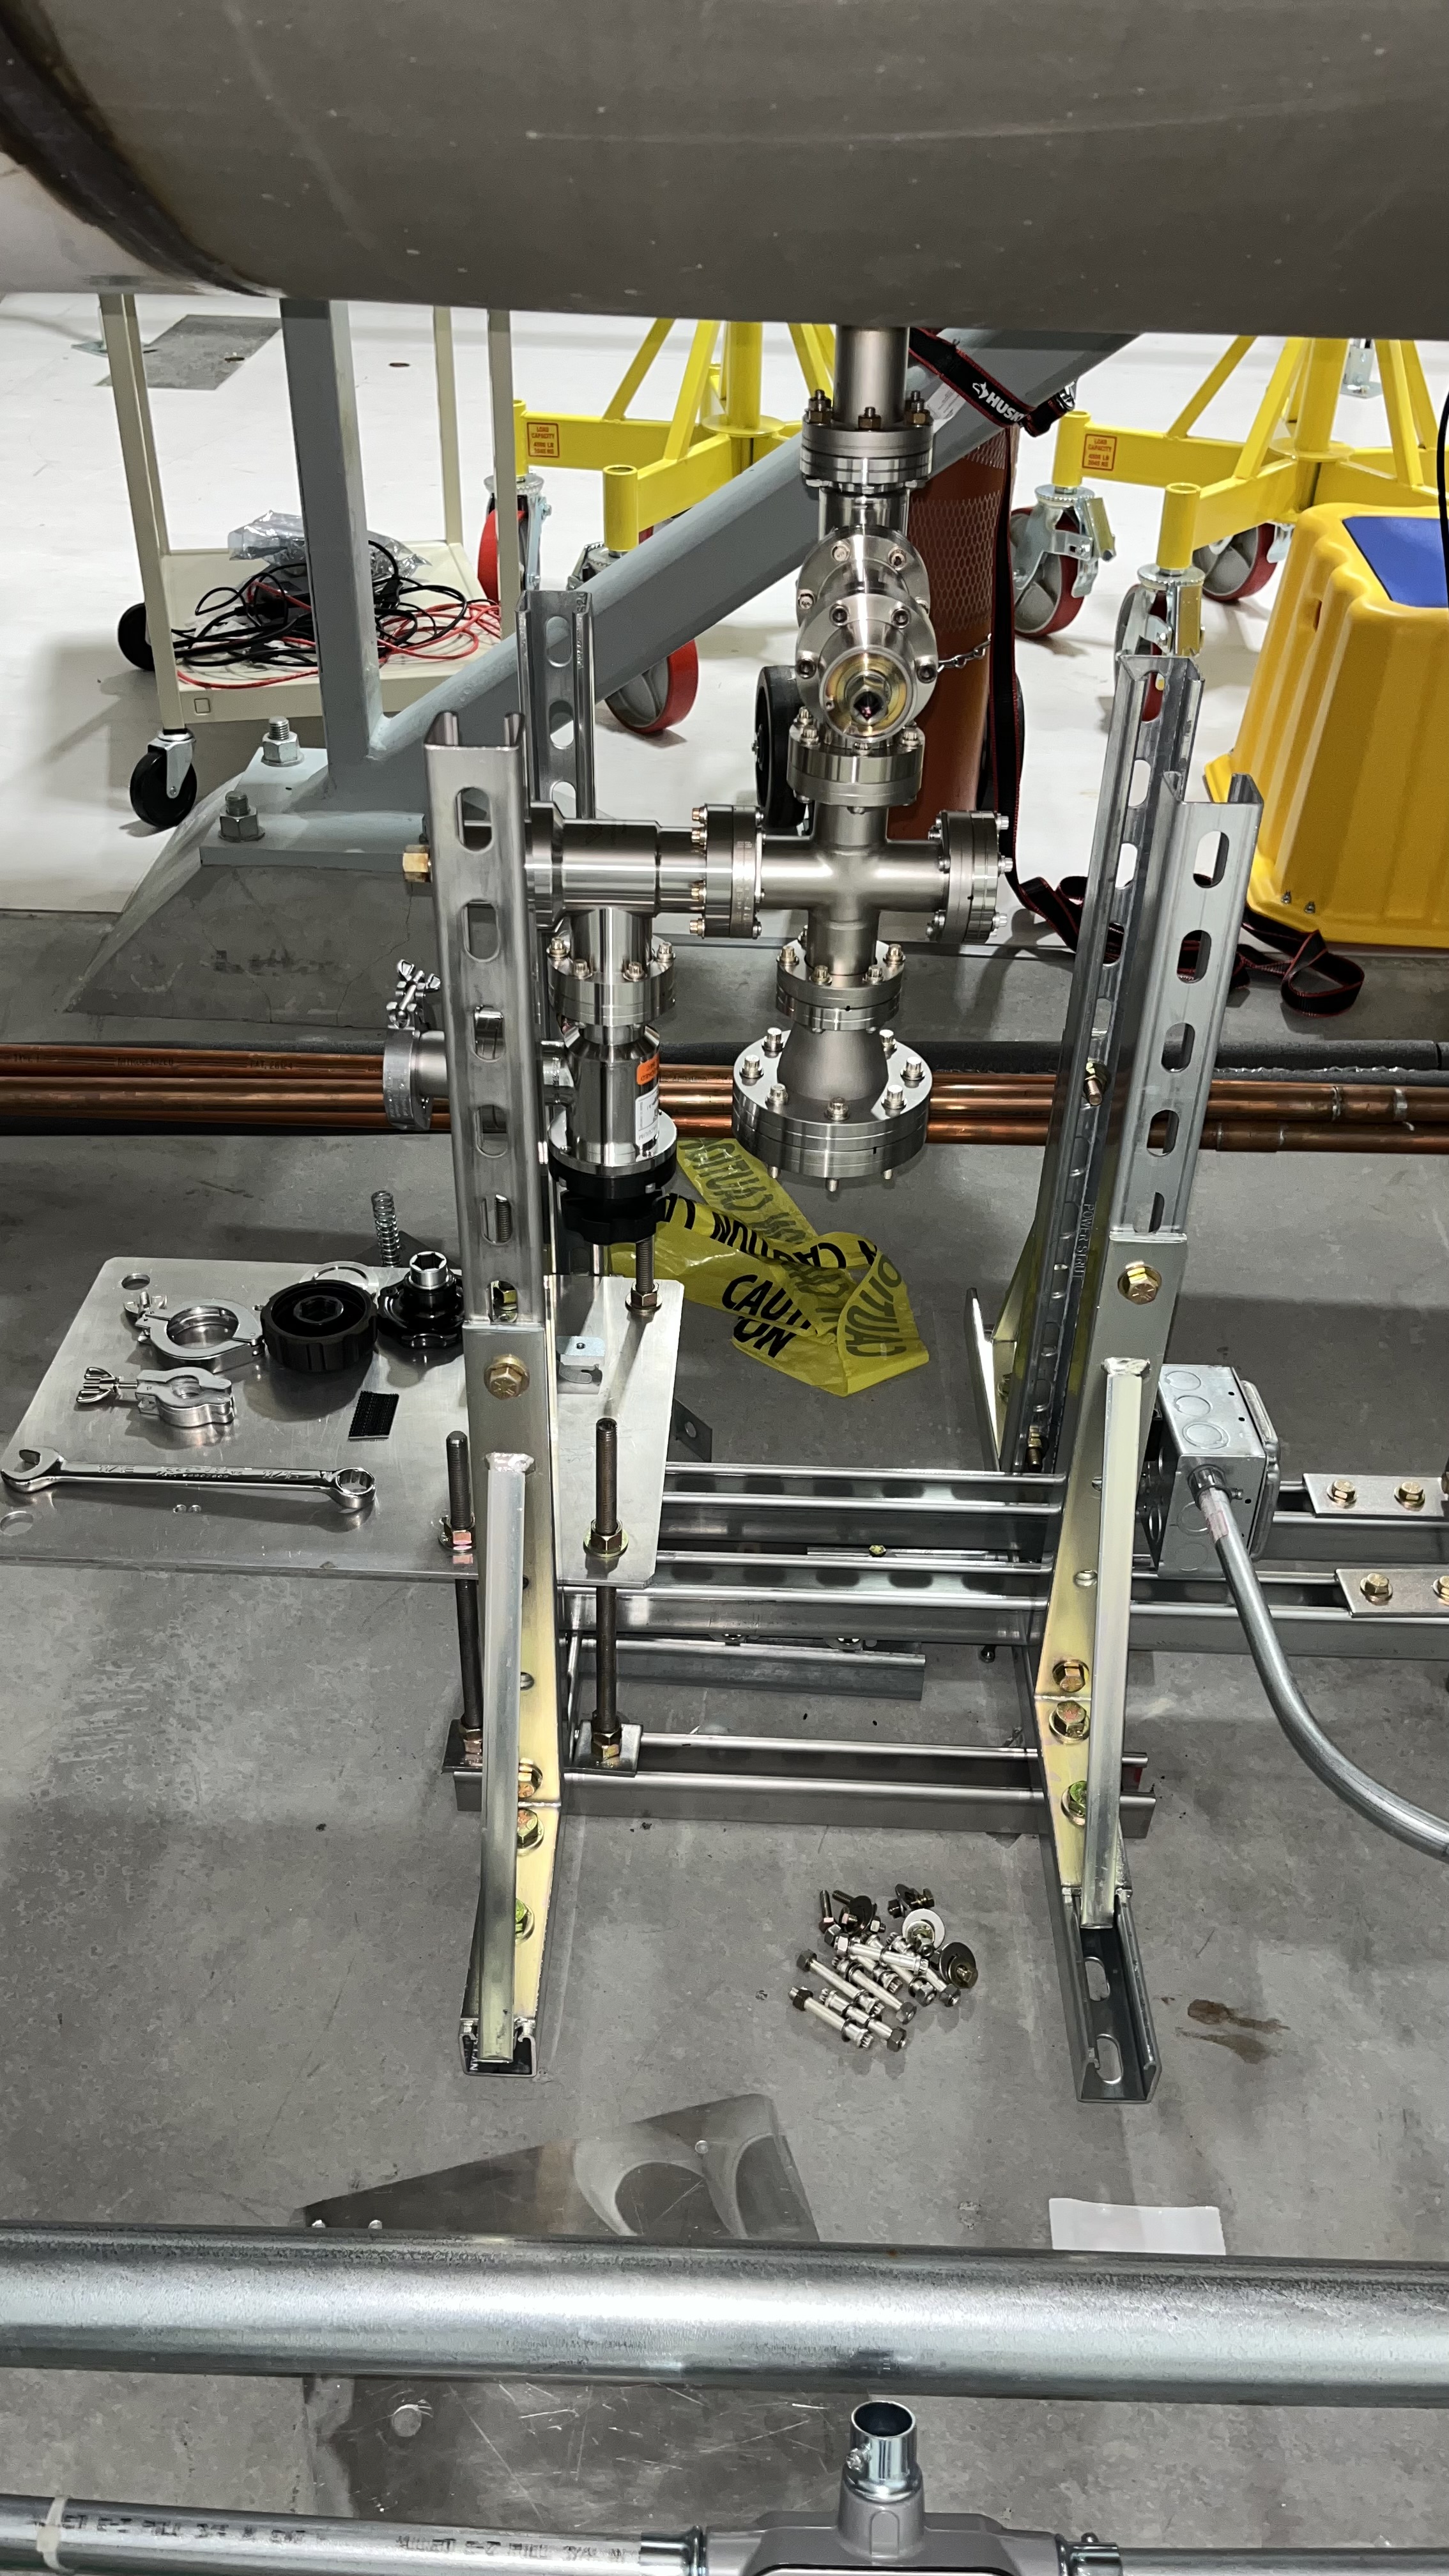
To measure the resistance of the strain gauge and confirm if anything is broken, I decided to check it chamber side (on the racks in the LVEA). To locate the chassis in the LVEA I referred to the A+ SUS HAM 7 (sush7) System Wiring Diagrams (D2000202_V12), page 04 (ZM5, M2 PSAMS). This document pointed me towards SQZ-R1, Slot U2, where the chassis D2000555 was located. At first, I switched off the chassis and then unplugged cable no 6 which was connected to the JIG Box (J8-Metal PCB Jumper Box DB25 Male female). Then I connected a breakout board to cable no 6. For measuring the resistance of the strain gauge, I looked into D2000383 to find the correct pins (Camille Makarem (CIT) also talked to the vendor and sent me the pin number, as given in E2500225). This is as follows,
700 Ohms between Ex+ and Ex-
350 Ohms between signal+ and Ex-.
From the pinouts in https://dcc.ligo.org/LIGO-E2500225, this should be
700 Ohms between pins 1 and pins 3/2
350 Ohms between pins 6 and pins 2/3
Chamber side this comes to be pin 12 & 25 and pin 11 & 25. Using a multimeter, I got the following readings,
Pin 12 & 25 = 706 Ohms (looks good)
Pin 11 & 24 = 360.5 Ohms (looks good)
The chassis was powered on after the measurements were complete and cable 06 reconnected to the JIG box and secured using two screws (which were missing). The above measured numbers are as per the strain gauge manufacturer. However, It could be possible that the soldering is coming off and giving us open loop sometimes, if not all times. We will continue to investigate this issue and if we are not able to fix it then the plan is to replace it with a spare unit. A spare ZM5 PSAMs unit is currently being prepared by Camille Makarem and should be shipped to LHO within a day or two. We will then start working on swapping out the faulty unit with spare one, in-situ.