Ryan C and I made a few changes today to help speed up the automation. Most notable changes:
TITLE: 04/28 Day Shift: 15:00-23:00 UTC (08:00-16:00 PST), all times posted in UTC
STATE of H1: Observing at 135Mpc
QUICK SUMMARY:
LOCK #1:
LOCK #2:
LOCK #3:
LOG:
|
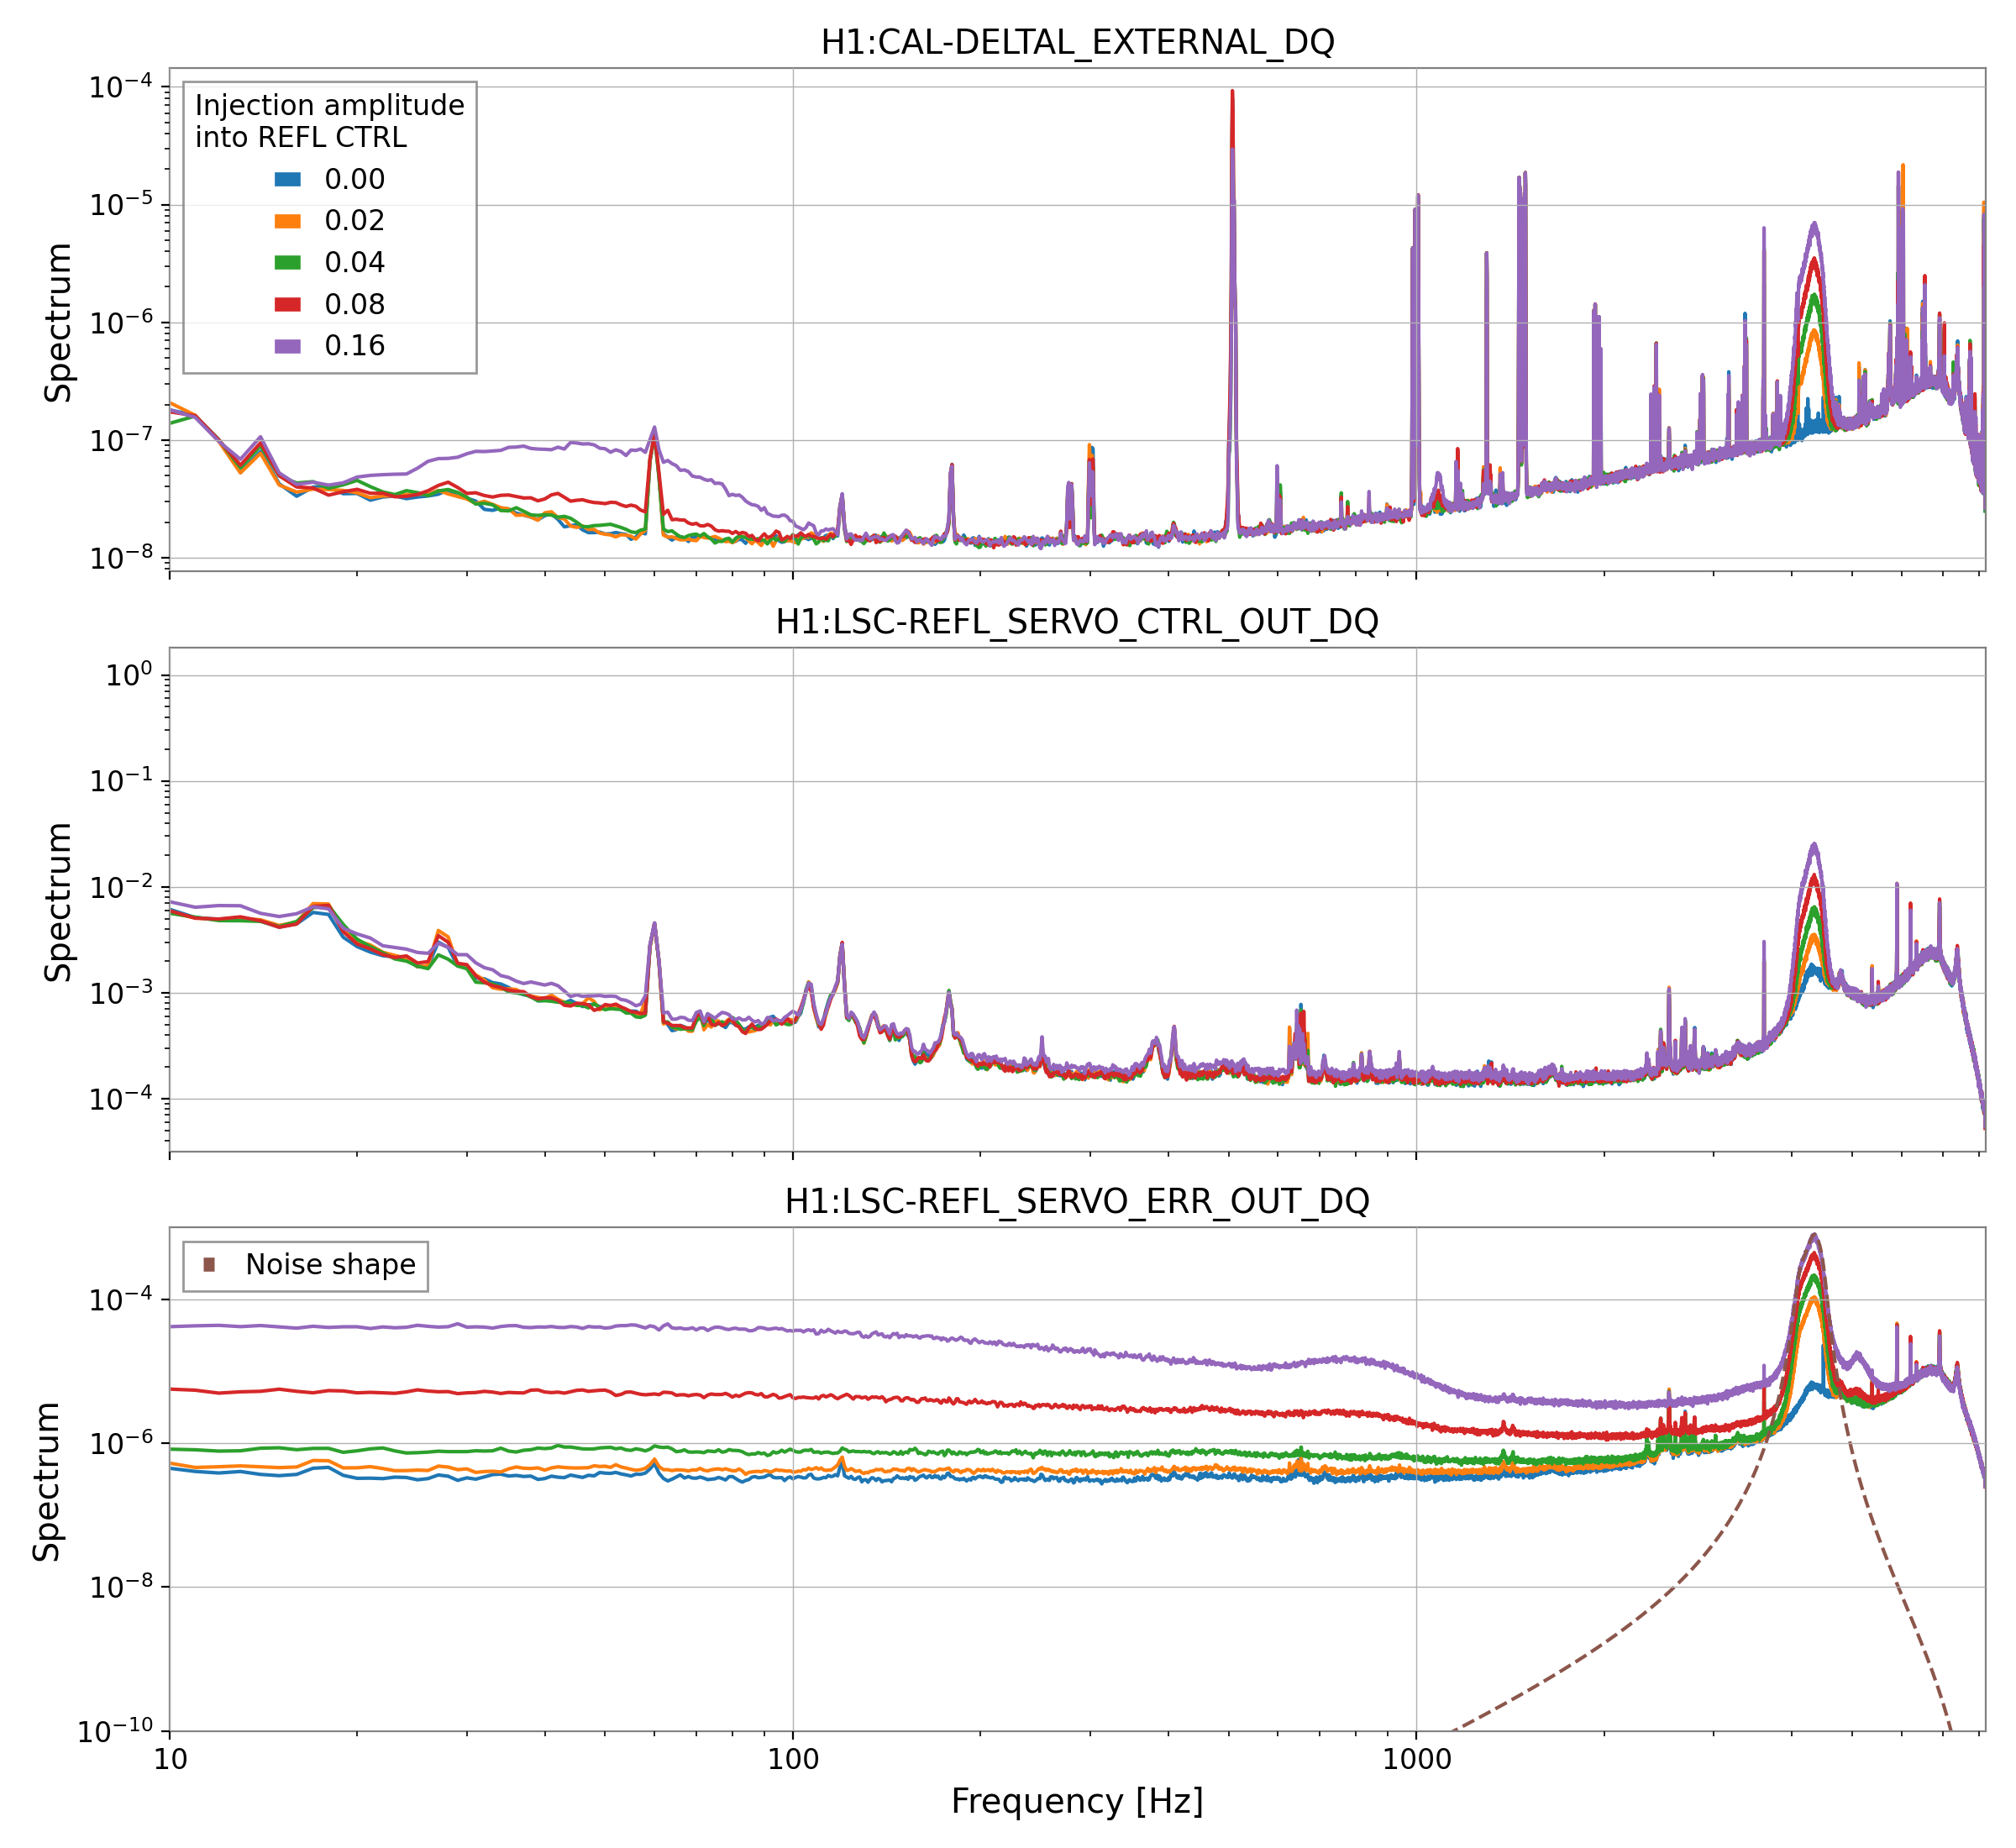
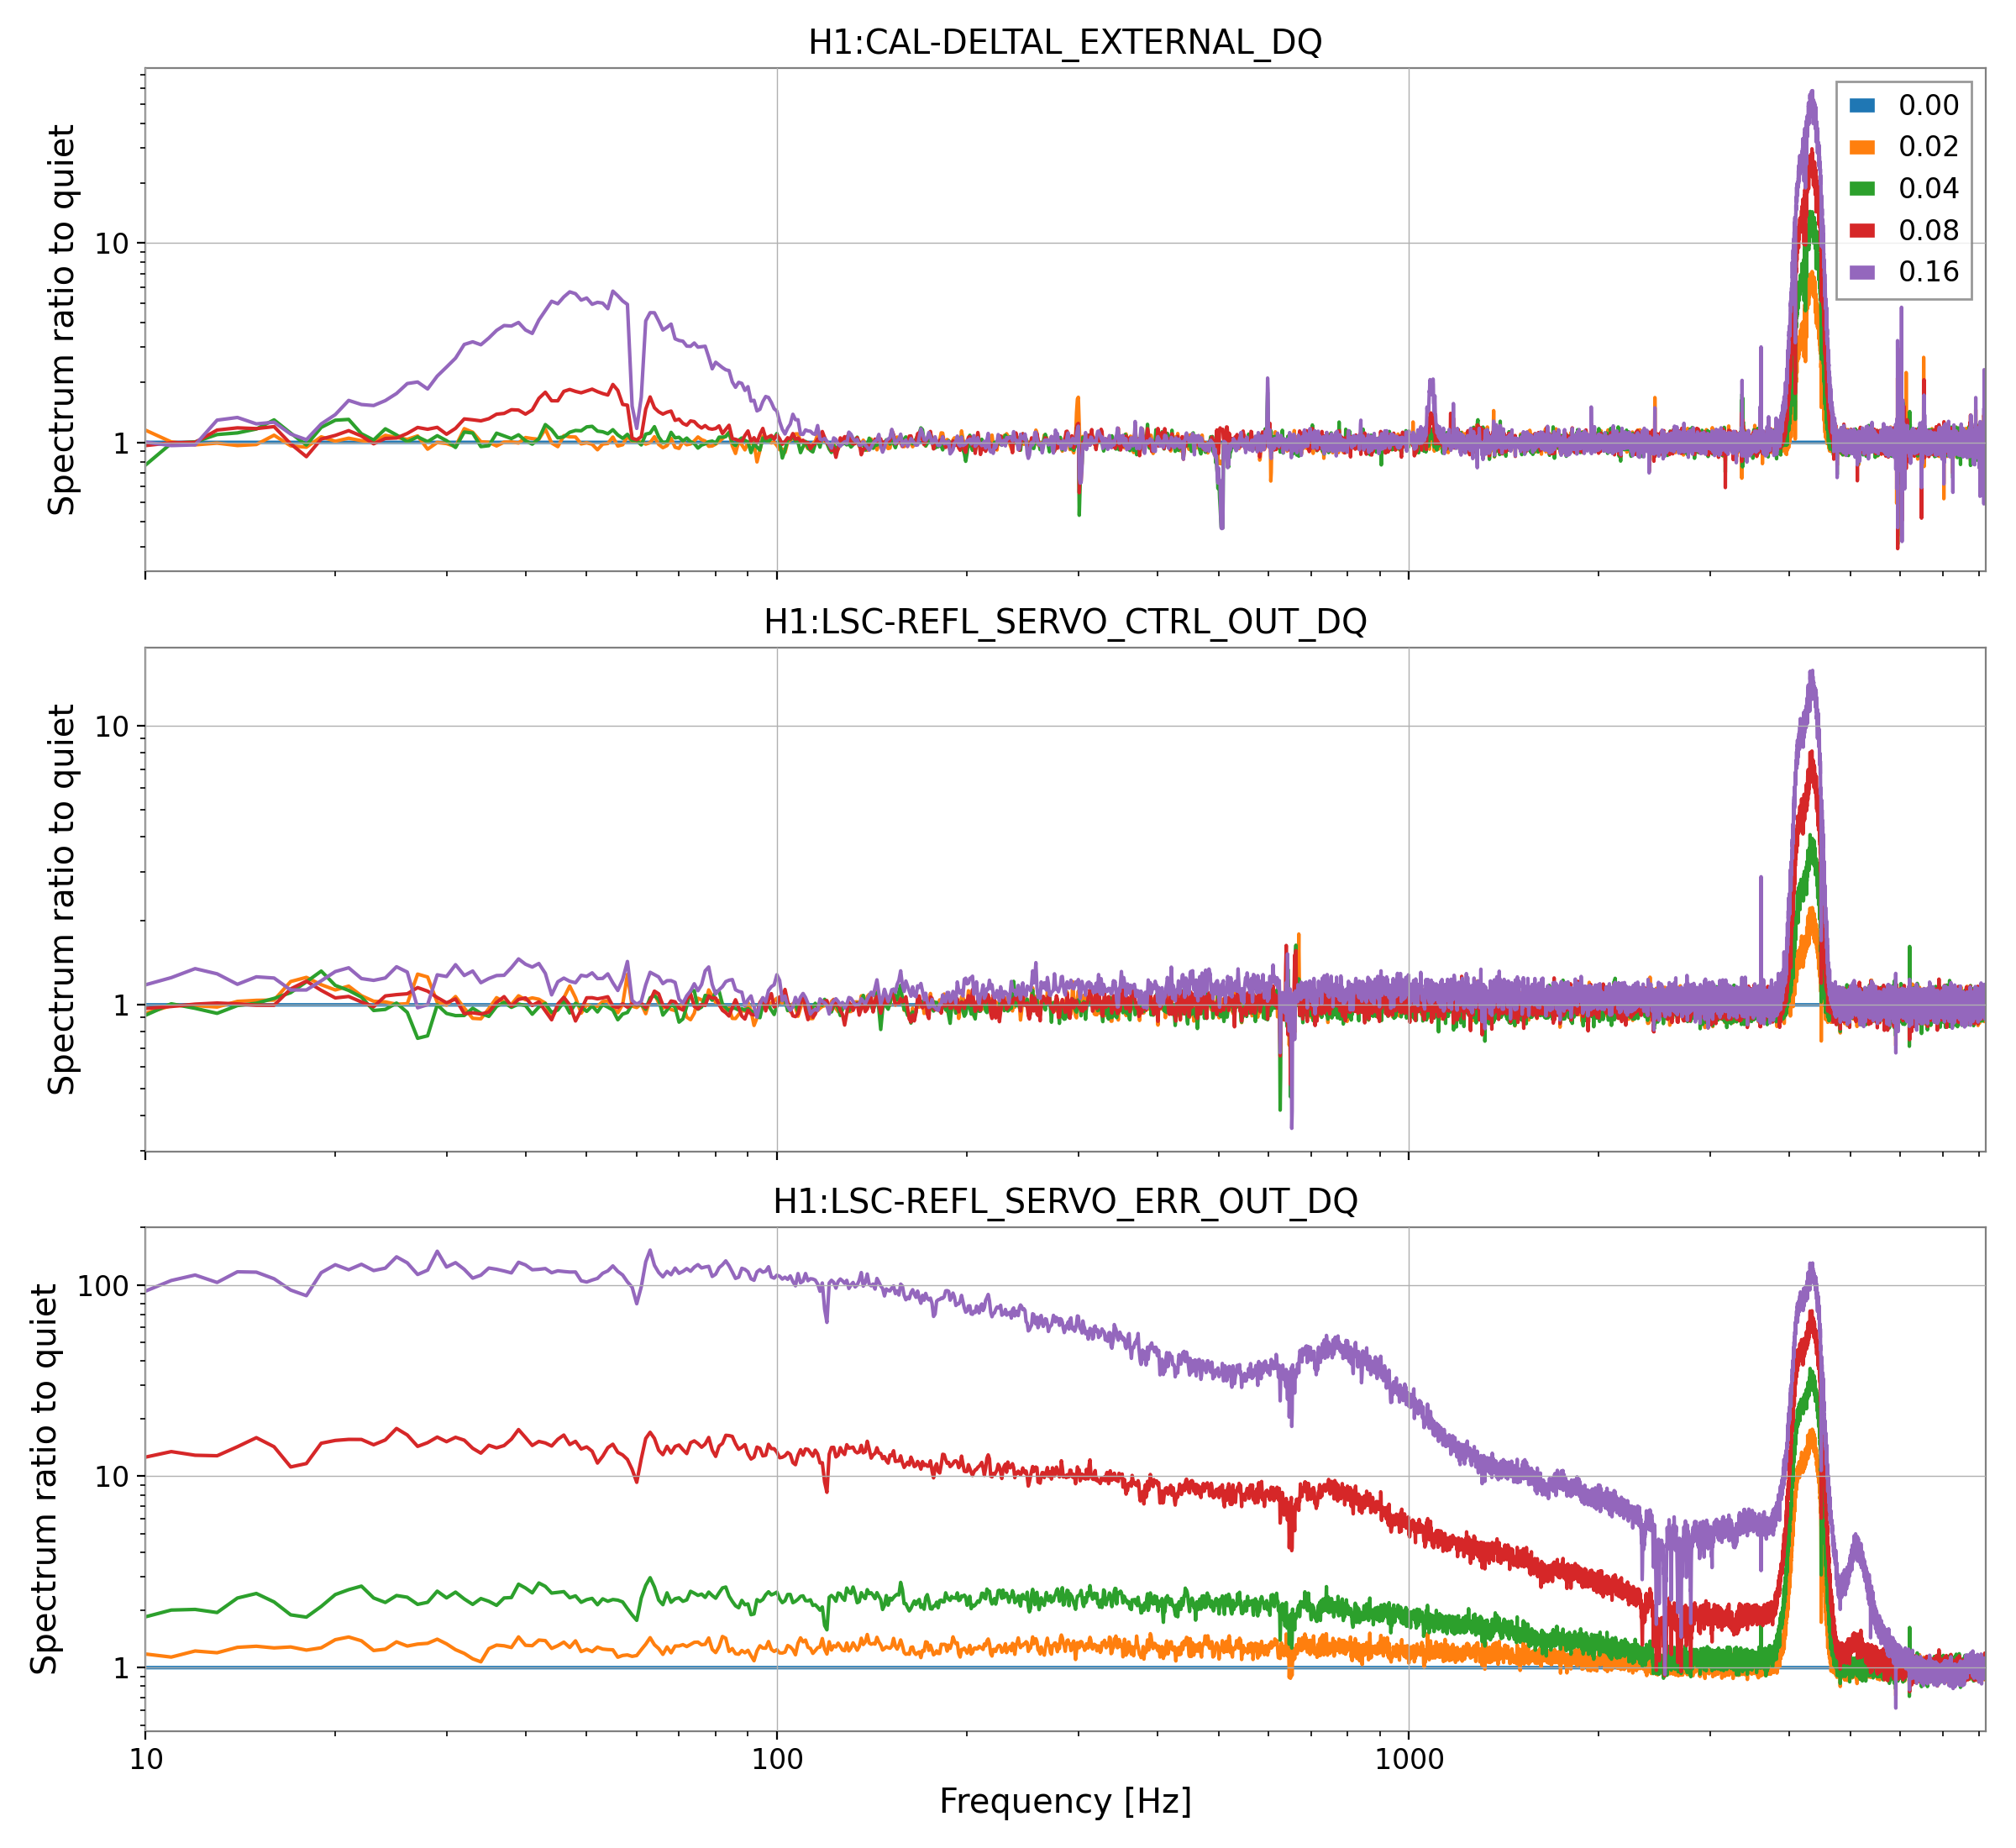
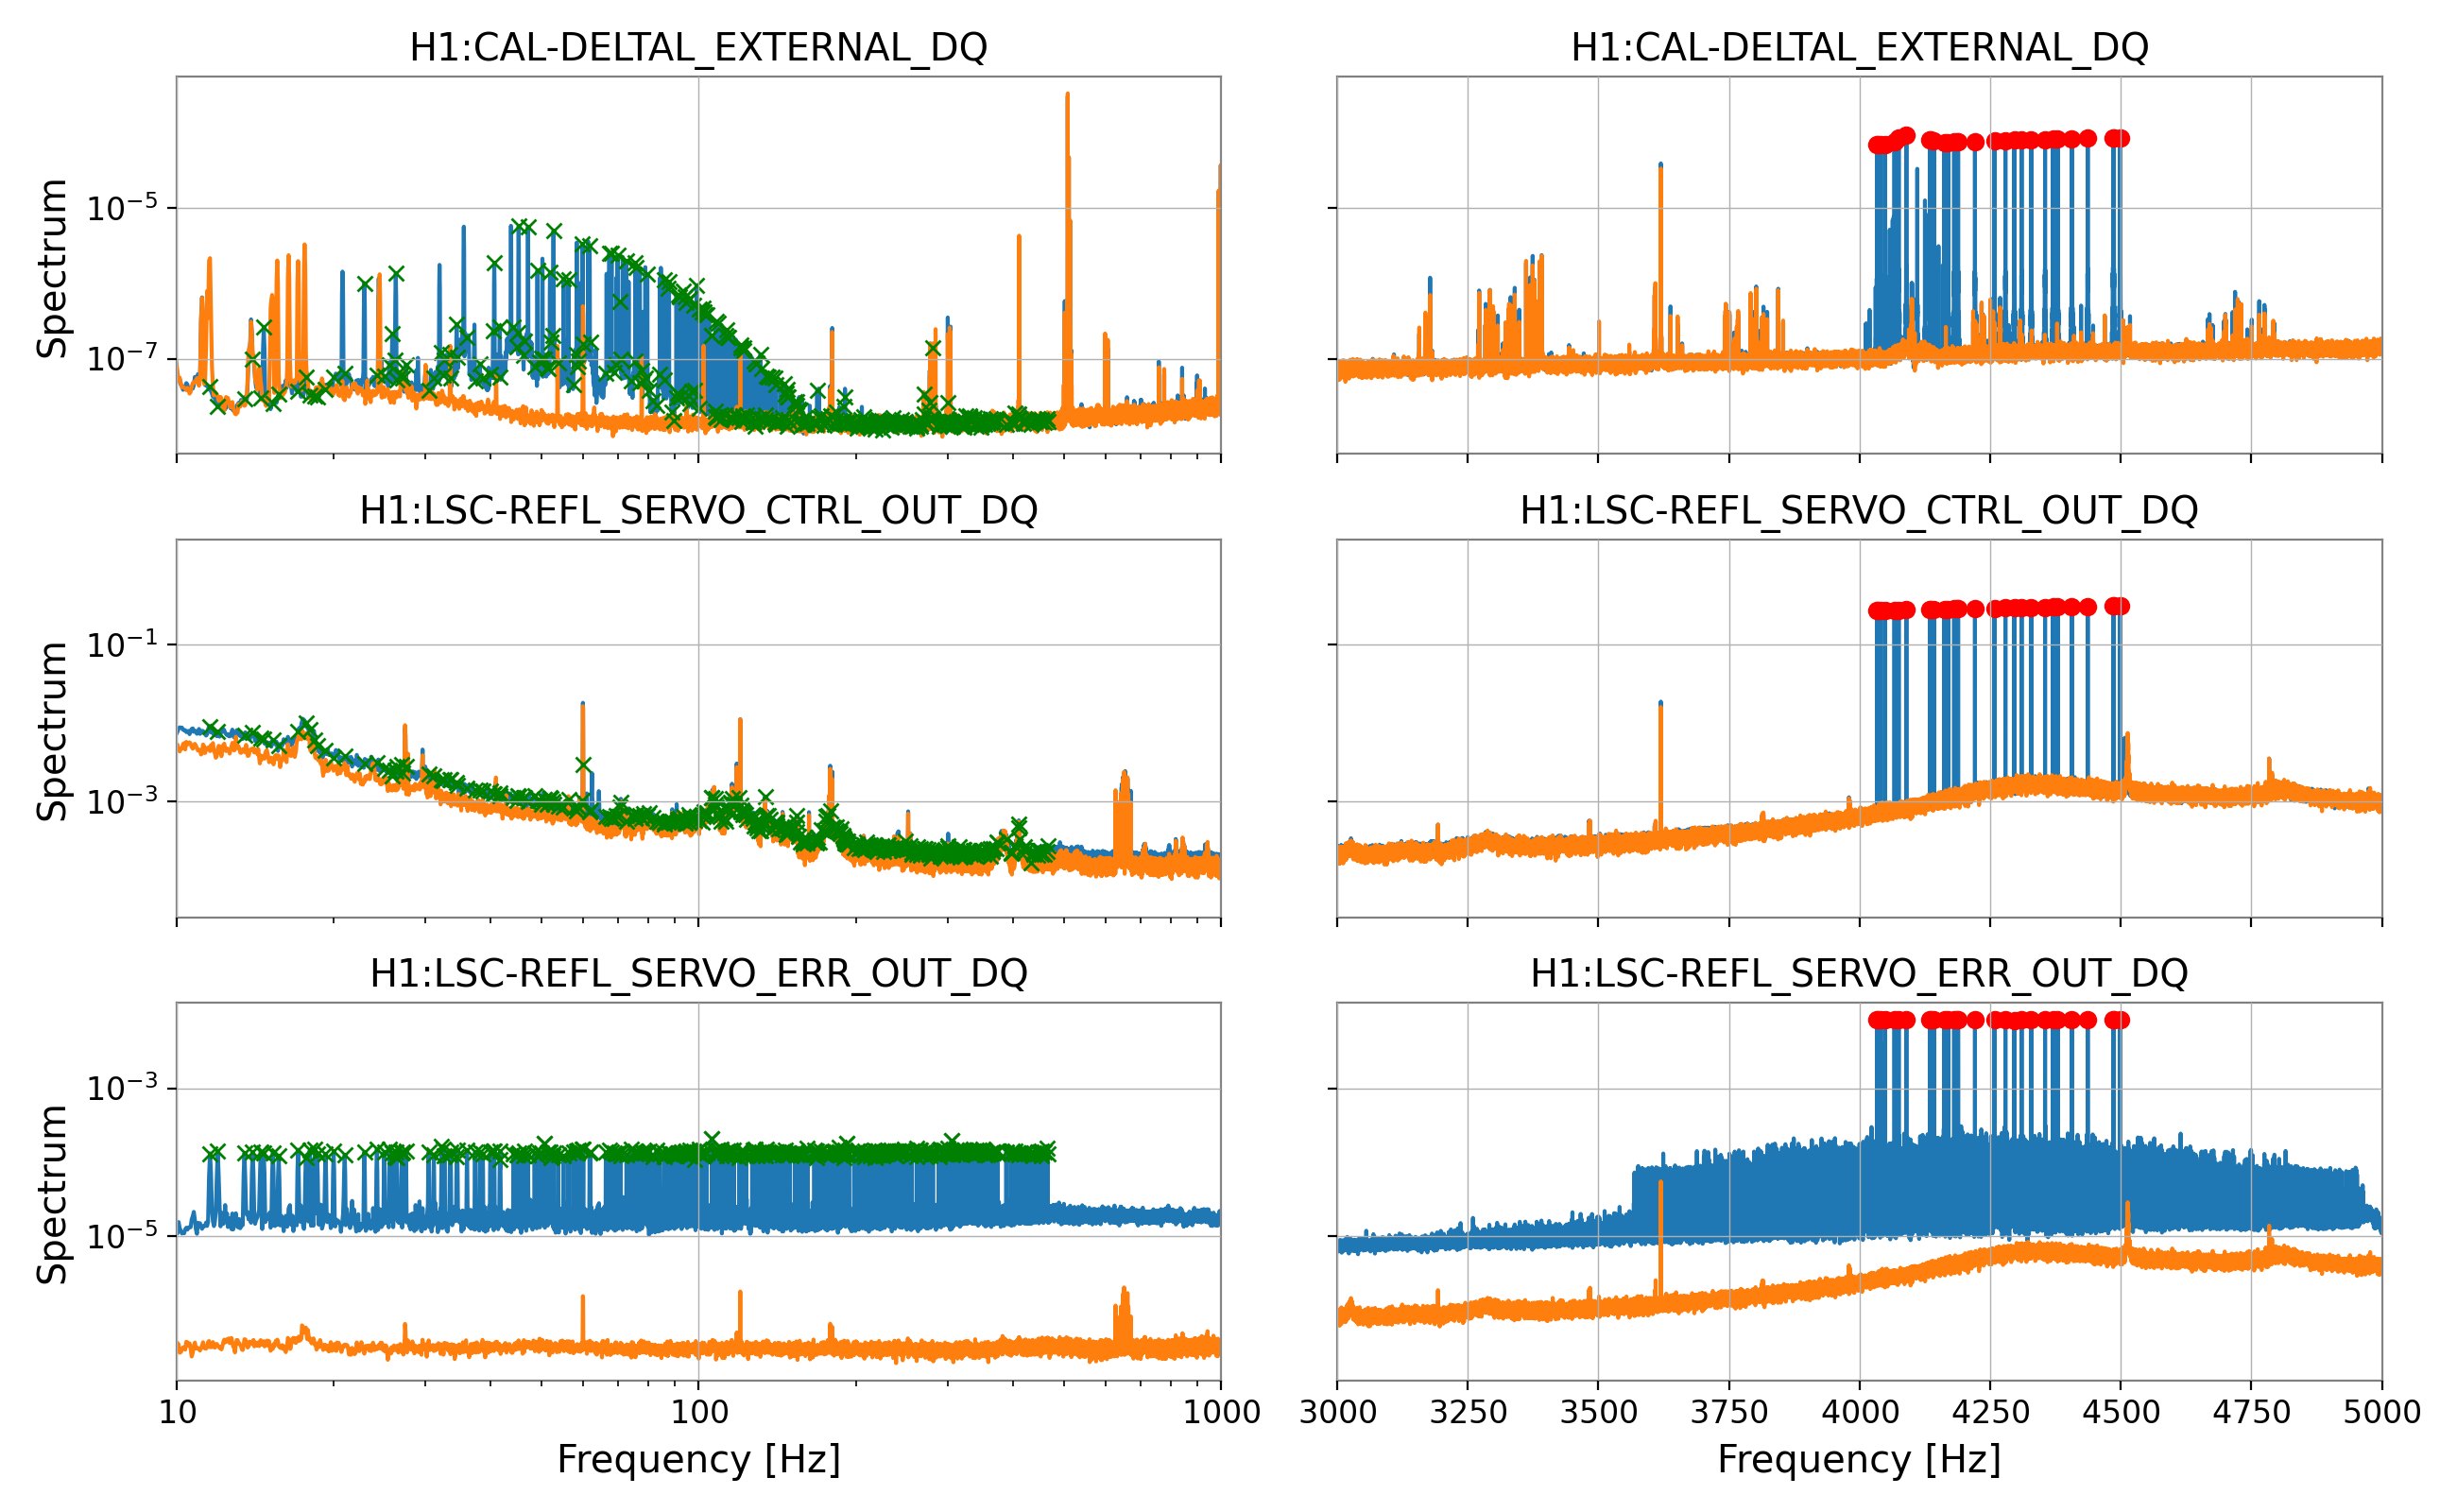
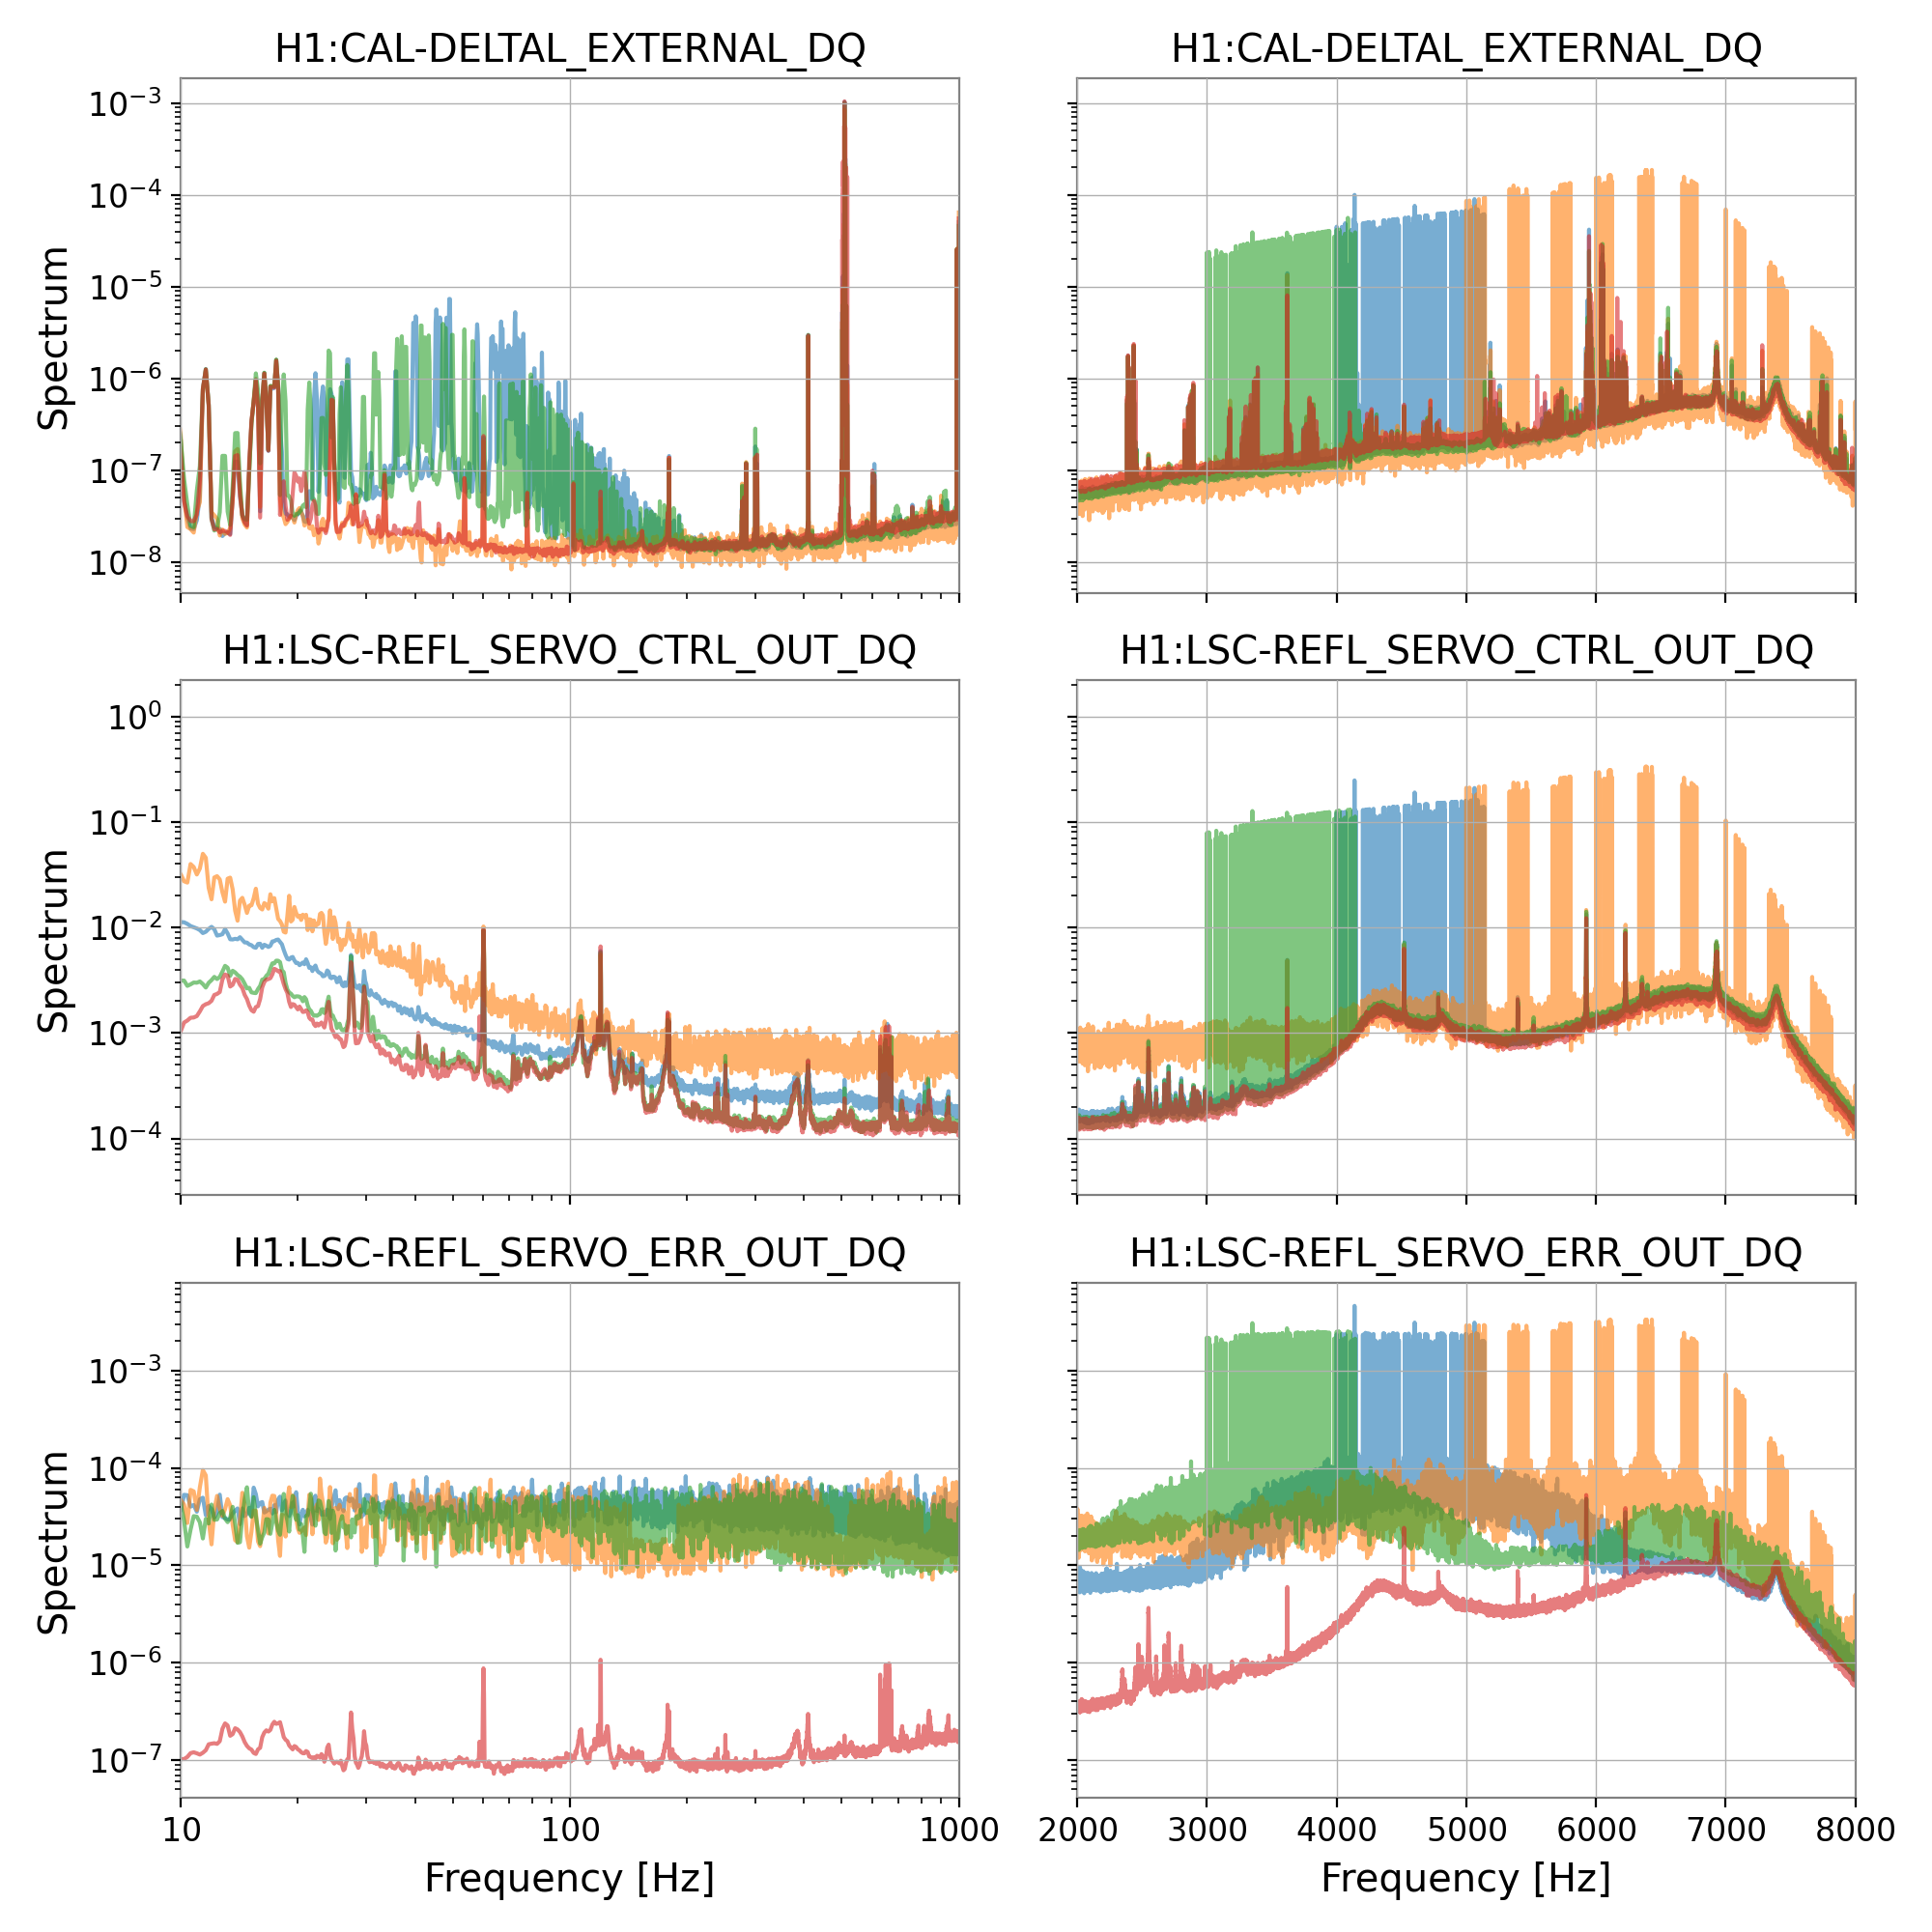
We've known for a while that when we inject laser frequency noise, we see significant downconversion in DARM, together with the expected linear coupling. In particular, when injecting band-limited laser frequency noise in the kHzs region, we see noise in the 100s Hz region getting worse.
Over the past few days I did a few noise and line injections to characterize this coupling. A more detailed analysis will follow, but here are some observations:
The first two plots attached show the effect of injecting noise that mimicks the shape of the 4.3 kHz bump visible in CARM. The first one shows the spectra, the second plot shows the ratio to the quiet time. It's clear that the 100 Hz bump in DARM scales quadratically. It also seems that the downconversion effect is not large enough to be worrisome at this level.
The third plot shows what happens when I injected several lines at high frequency. The red dots shows the lines I injected, while the green Xs shows all the differences in the frequencies. All excess lines in DARM and REFL ERR are marked with a green X, so we see that the coupling is quadratic and does not involve any other line.
The last plot shows that line injections at frequencies outside the 4 - 4.5 kHz band don't produce significant downconversion in DARM.
In a follow up analysis, I plan to model the quadratic coupling from REFL to DARM, and build a noise projection.
4.1 kHz is the OMC dither line. LHO alog 44874 Keita did some nice work in the past on the downconversion from frequency noise near the OMC dither. At that time we determined it was not limiting DARM. Is worth doing again.
The way this new guardian node was written, it doens't reach it's nominal state until 6 hours into the lock. This would stop us from getting to Observing during that time even if we ignored the node because it's managed by ISC_LOCK, who wouldn't return OK until all of its subordinates are also OK. To get around this I got rid of the nominal Thermalized state and made the nominal state Servo_PRCL_Gain. I have this state returning True almost always now as well.
Something I noticed with this node when we were unlocked was that it would jump between states nonstop until we got to a higher state in the locking sequence. I removed the jump transitions causing this and added into ISC_LOCK to request IDLE at Prep_For_Locking and then also a request of Servo_PRCL_Gain at Lownoise_Length_Control.
This node and ISC_LOCK will need to be reloaded on lock loss.
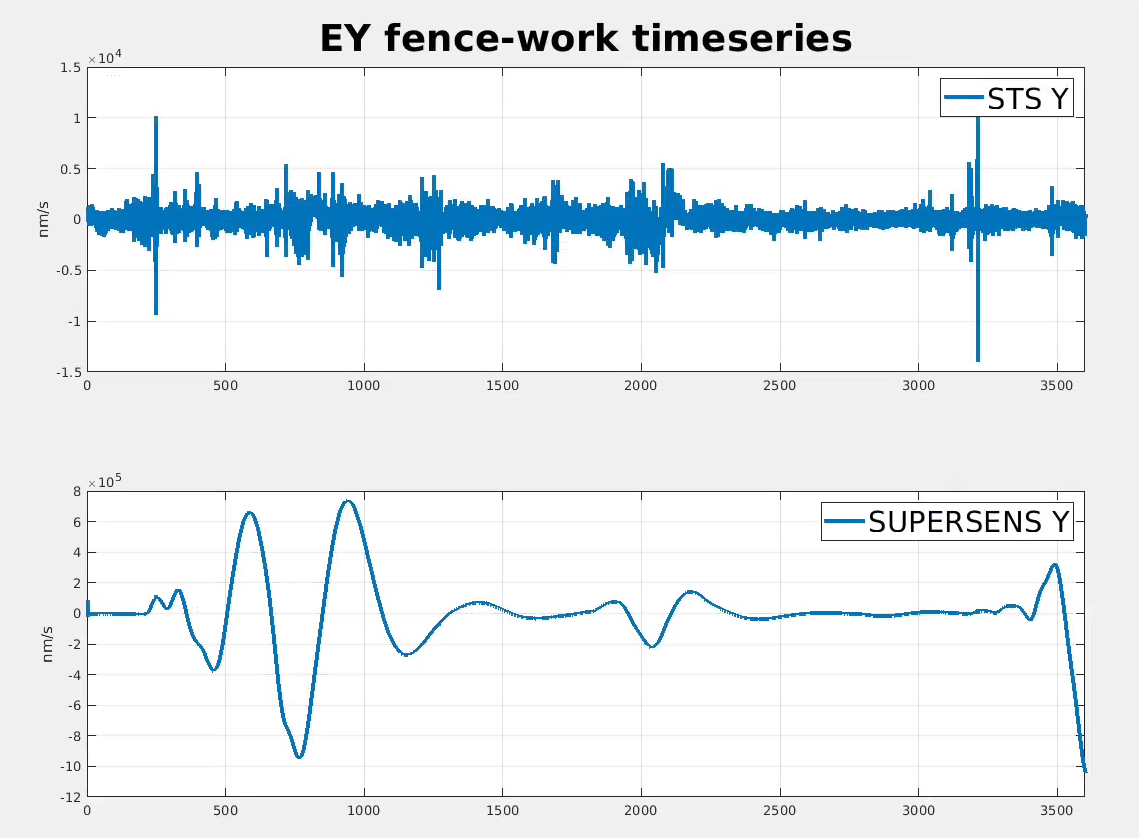
Last week, during the wind fence work, the operators had been manually changing the stage of the sensor correction, BRS subtraction of the STS and asking fence work to pause while the IFO relocked. This week, I came up with a new sensor correction filter that has allowed us to work on the fence without turning sensor correction off at EY.
First plot is a time series showing the ETMY STS (top trace) and ETMY STS- BRSY (bottom) supersensor. The STS alone sees some extra noise, but it's not bad. The supersensor however sees a lot of extra signal from the BRS getting rung up.
Second plot are the asds for these time series. All of the extra signal for this time is mostly contained below .1 hz. Signal above that is still good.
Third plot compares the nominal filter and the filter we've been running during fence work. Top plot shows the filter magnitudes in nm/nm (I'm leaving out the integrator needed to actually use the filter), the new 1/2hz filter has much more roll-off below .1hz bottom shows (1 - filter(in nm)), which is an estimate of the subtraction we should get with these filters. The nominal filter does a better job with the microseism, which was the focus when I designed it, but that is not the problem we have right now.
Fourth plot shows the timeseries output of each filter for the STS-BRSY signal from the first plot. At low frequency the CPS signal is dominated by the sensor correction. The new filters output is something like 10-20x smaller for the kicks coming from the BRS. I haven't done a real detailed comparison of the table motion yet, but we've been able to both lock and work on the fence running the new filter.
So far to run this, we've been pausing the ETMY_ST1_SC guardian and manually selecting the filter "Bad_stuff" for the Y direction on the ETMY St1 sensor correction. I've been waiting to see how long it will take to string up the rest of the fence before trying to add new guardian states to automate the transition.
This switch over to different filters and sensor correction filter was eventually coded up into an MEDM screen button. See LHO:69608 for description of the details of that process.
Unfotunately turning off the cosmic ray power supply did not remove the intermittent 4.05 Hz bumps in DARM, even though all the CS signals that showed a large peak at 4.06 Hz are now clean.
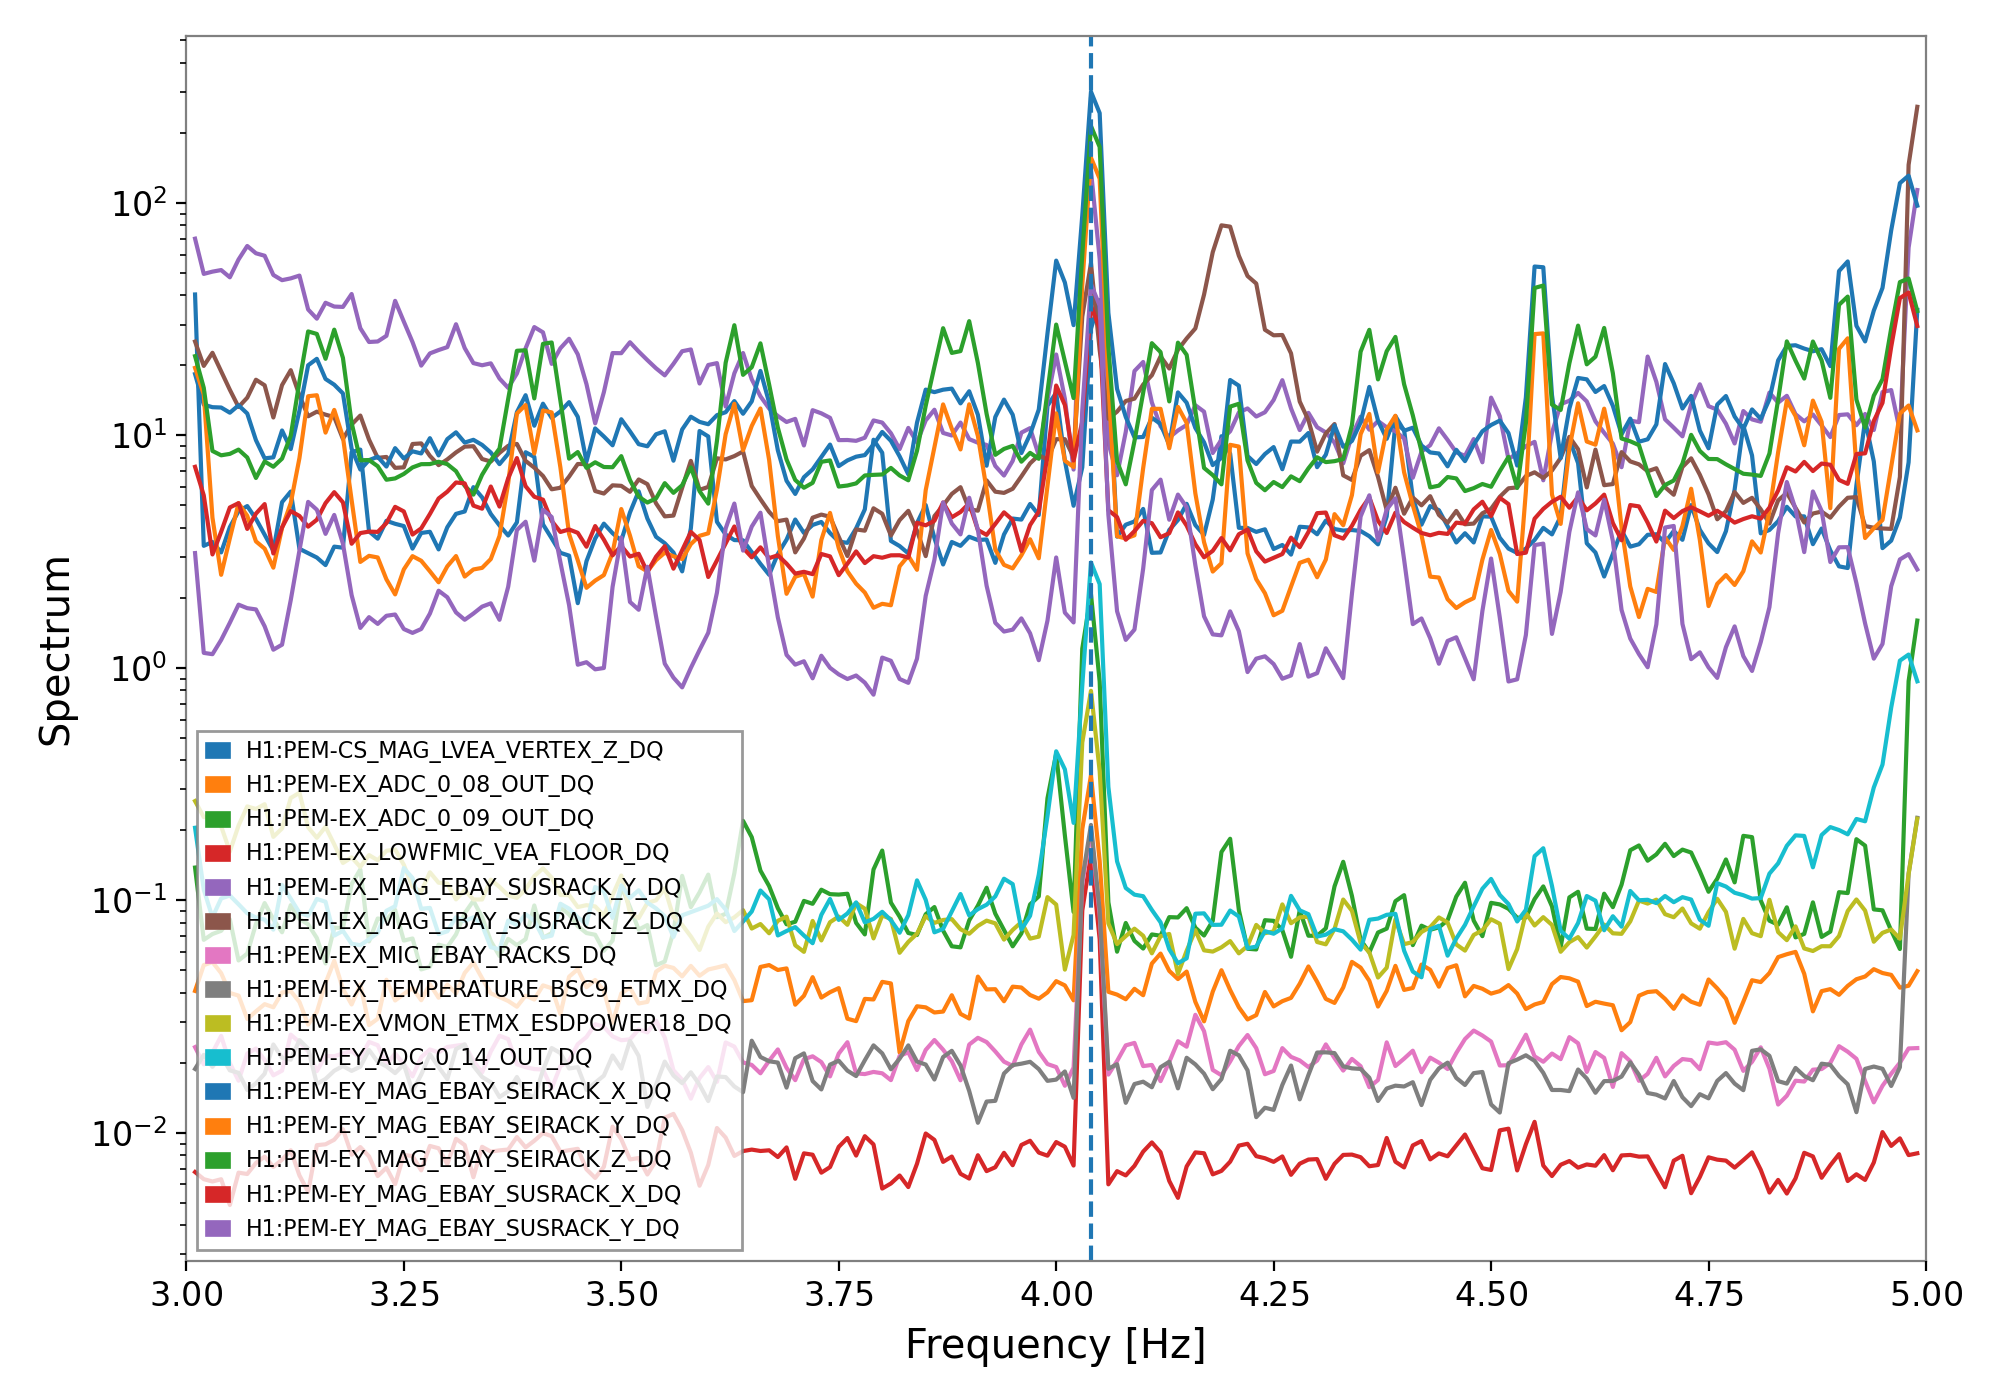
Looking again at all the signals that contain a peak around 4.05 Hz, we now have
H1:PEM-CS_MAG_LVEA_VERTEX_Z_DQ 4.050 Hz
H1:PEM-EX_ADC_0_08_OUT_DQ 4.040 Hz
H1:PEM-EX_ADC_0_09_OUT_DQ 4.040 Hz
H1:PEM-EX_LOWFMIC_VEA_FLOOR_DQ 4.040 Hz
H1:PEM-EX_MAG_EBAY_SUSRACK_Y_DQ 4.040 Hz
H1:PEM-EX_MAG_EBAY_SUSRACK_Z_DQ 4.040 Hz
H1:PEM-EX_MIC_EBAY_RACKS_DQ 4.040 Hz
H1:PEM-EX_TEMPERATURE_BSC9_ETMX_DQ 4.040 Hz
H1:PEM-EX_VMON_ETMX_ESDPOWER18_DQ 4.040 Hz
H1:PEM-EY_ADC_0_14_OUT_DQ 4.040 Hz
H1:PEM-EY_MAG_EBAY_SEIRACK_X_DQ 4.040 Hz
H1:PEM-EY_MAG_EBAY_SEIRACK_Y_DQ 4.040 Hz
H1:PEM-EY_MAG_EBAY_SEIRACK_Z_DQ 4.040 Hz
H1:PEM-EY_MAG_EBAY_SUSRACK_X_DQ 4.040 Hz
H1:PEM-EY_MAG_EBAY_SUSRACK_Y_DQ 4.040 Hz
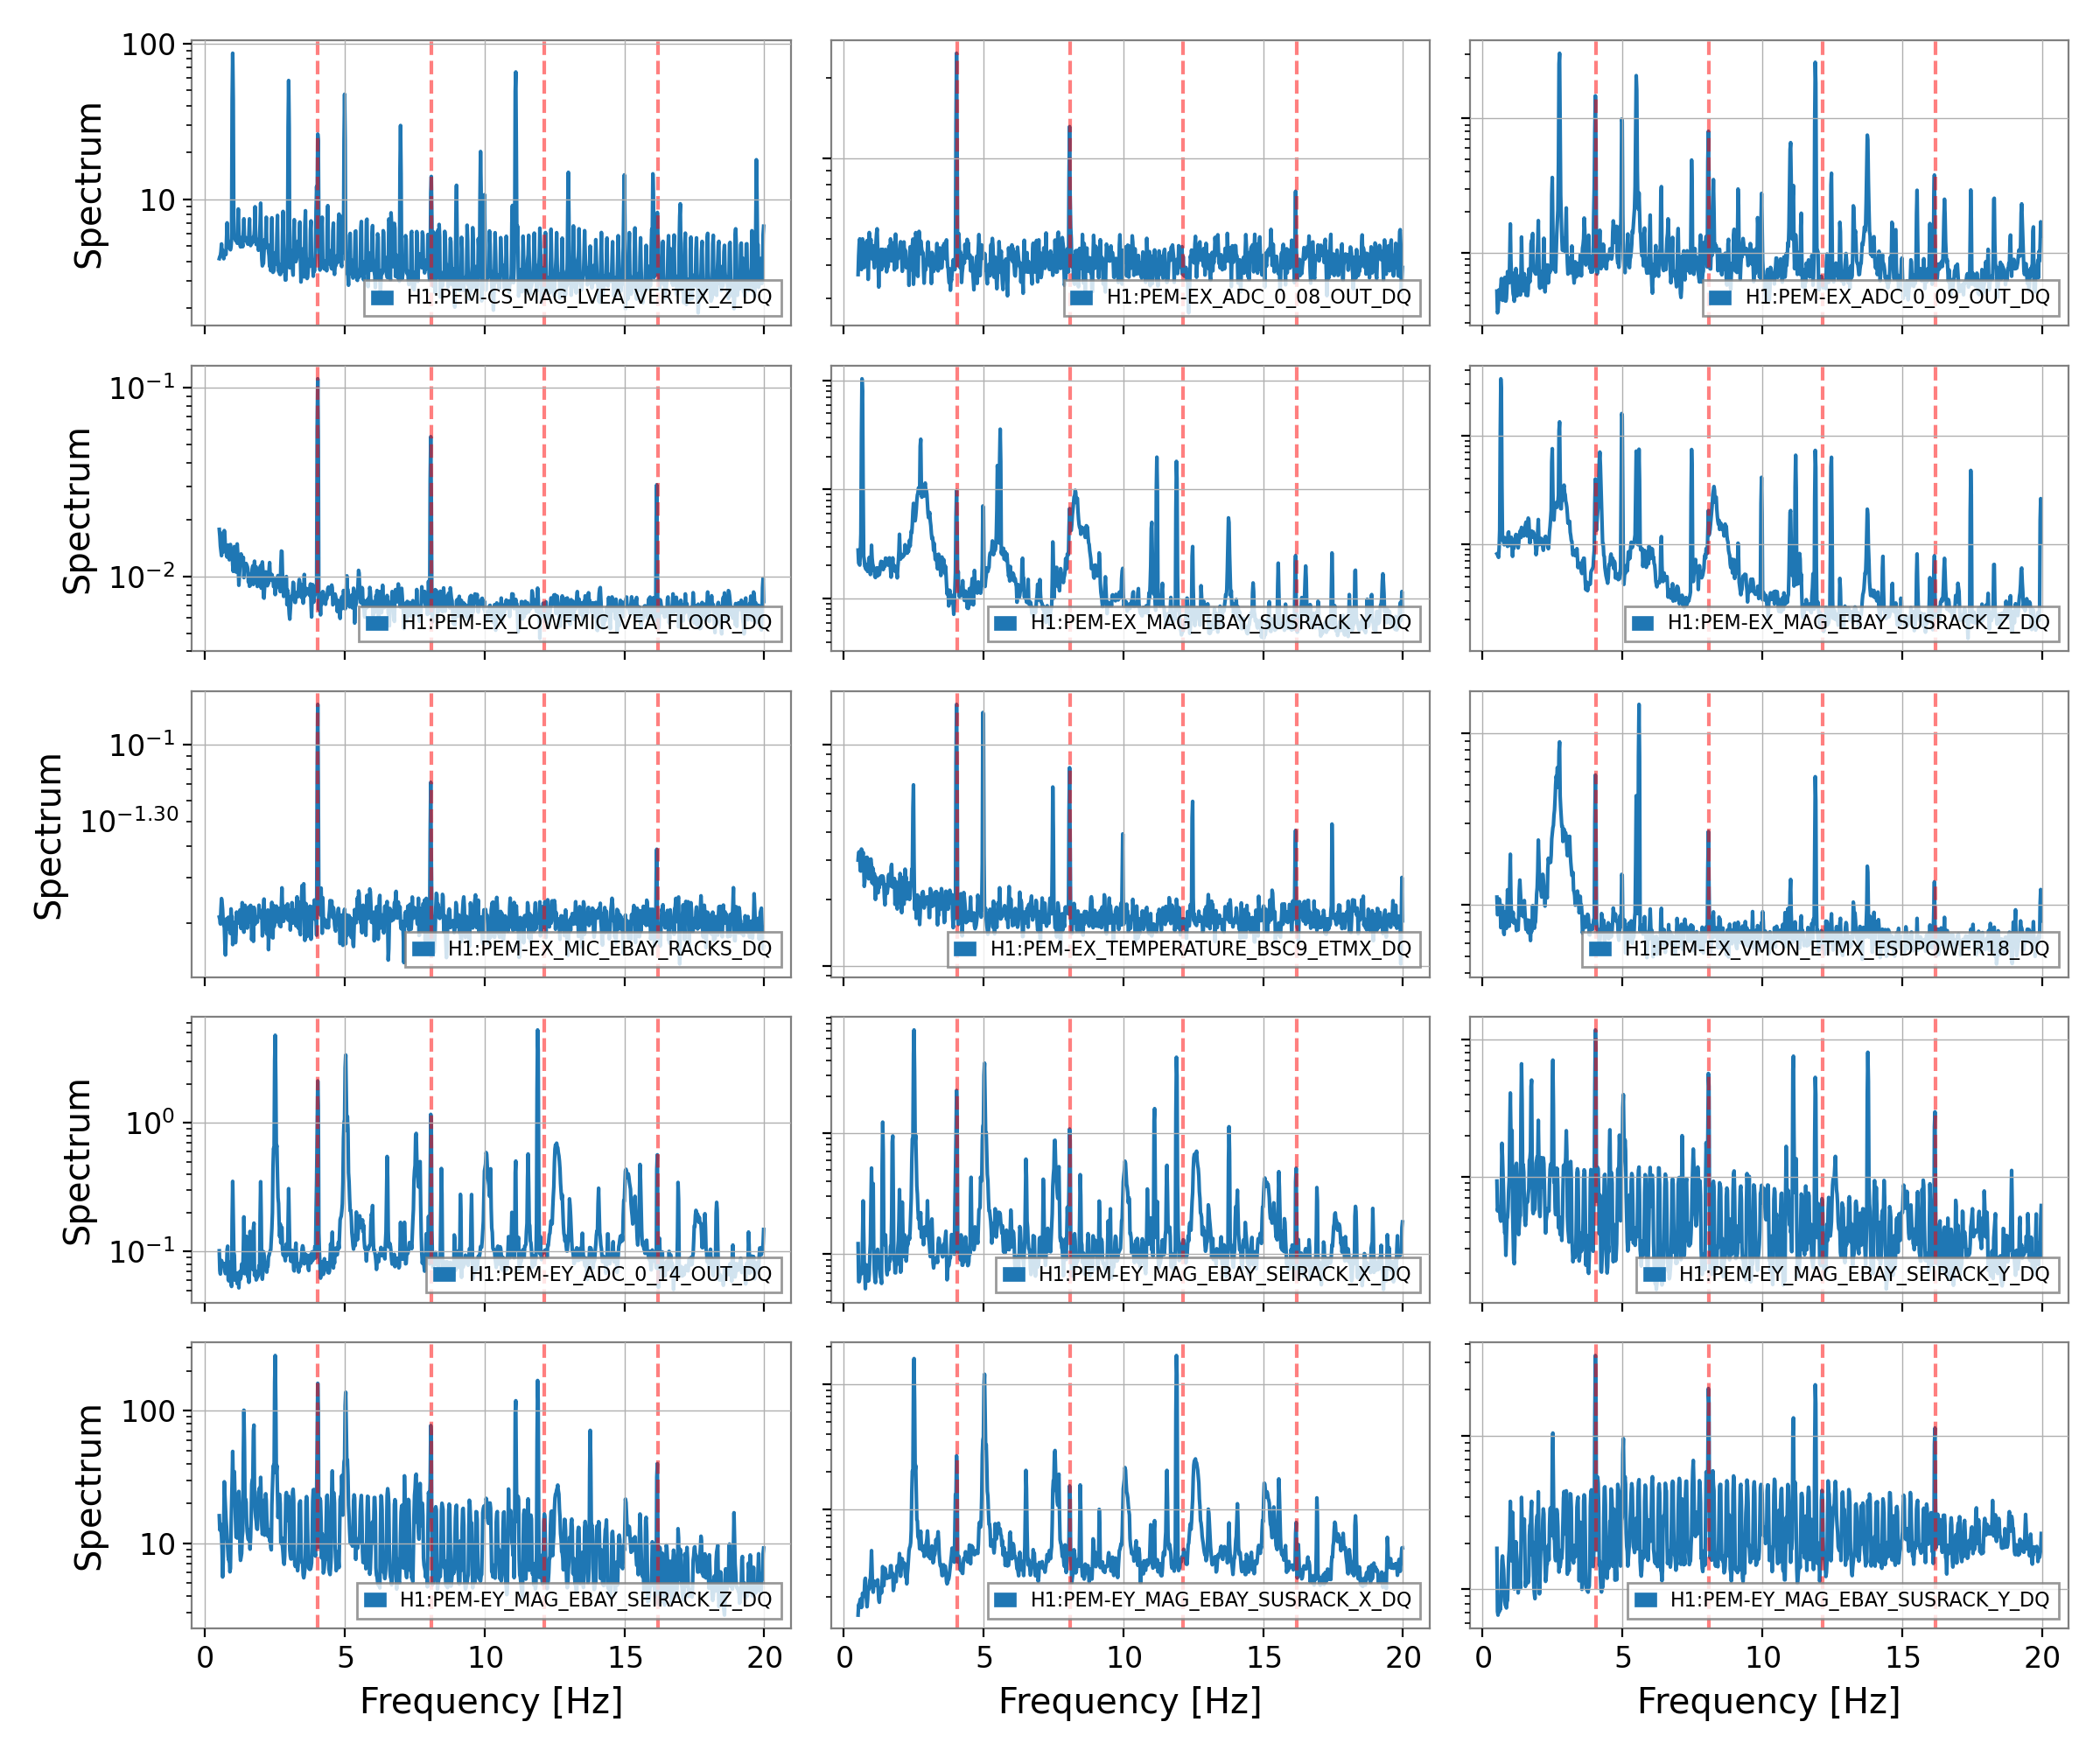
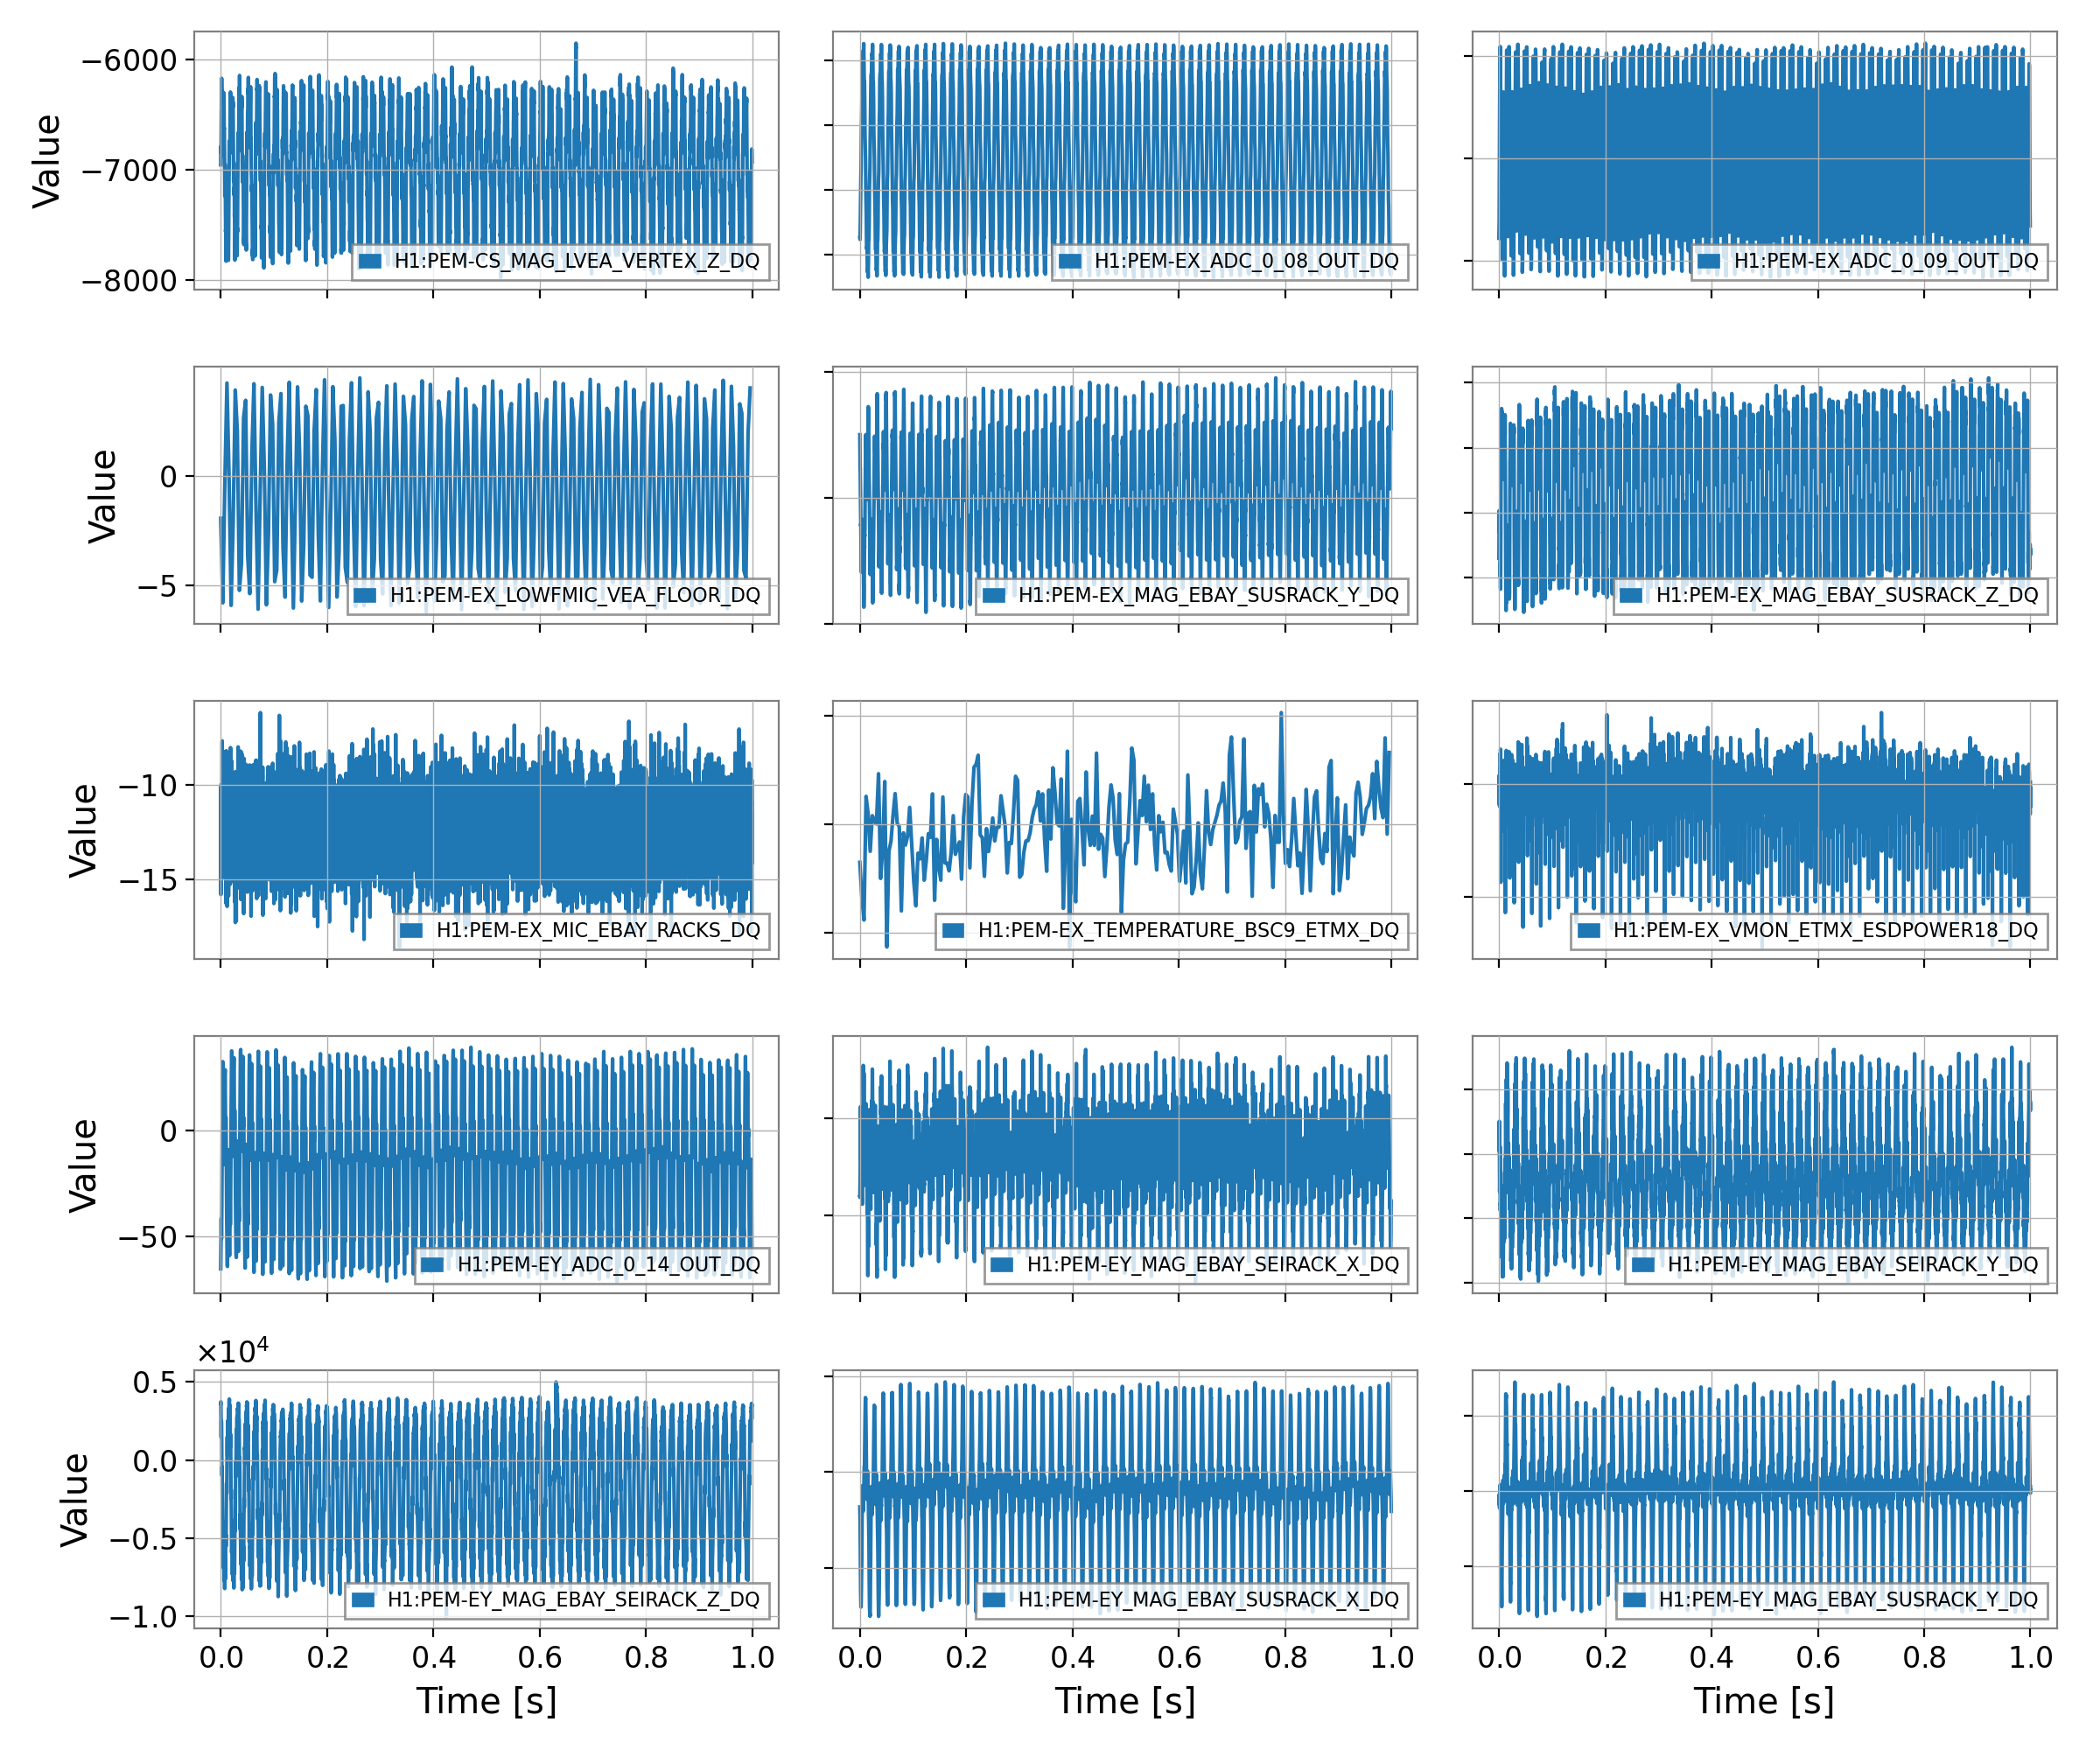
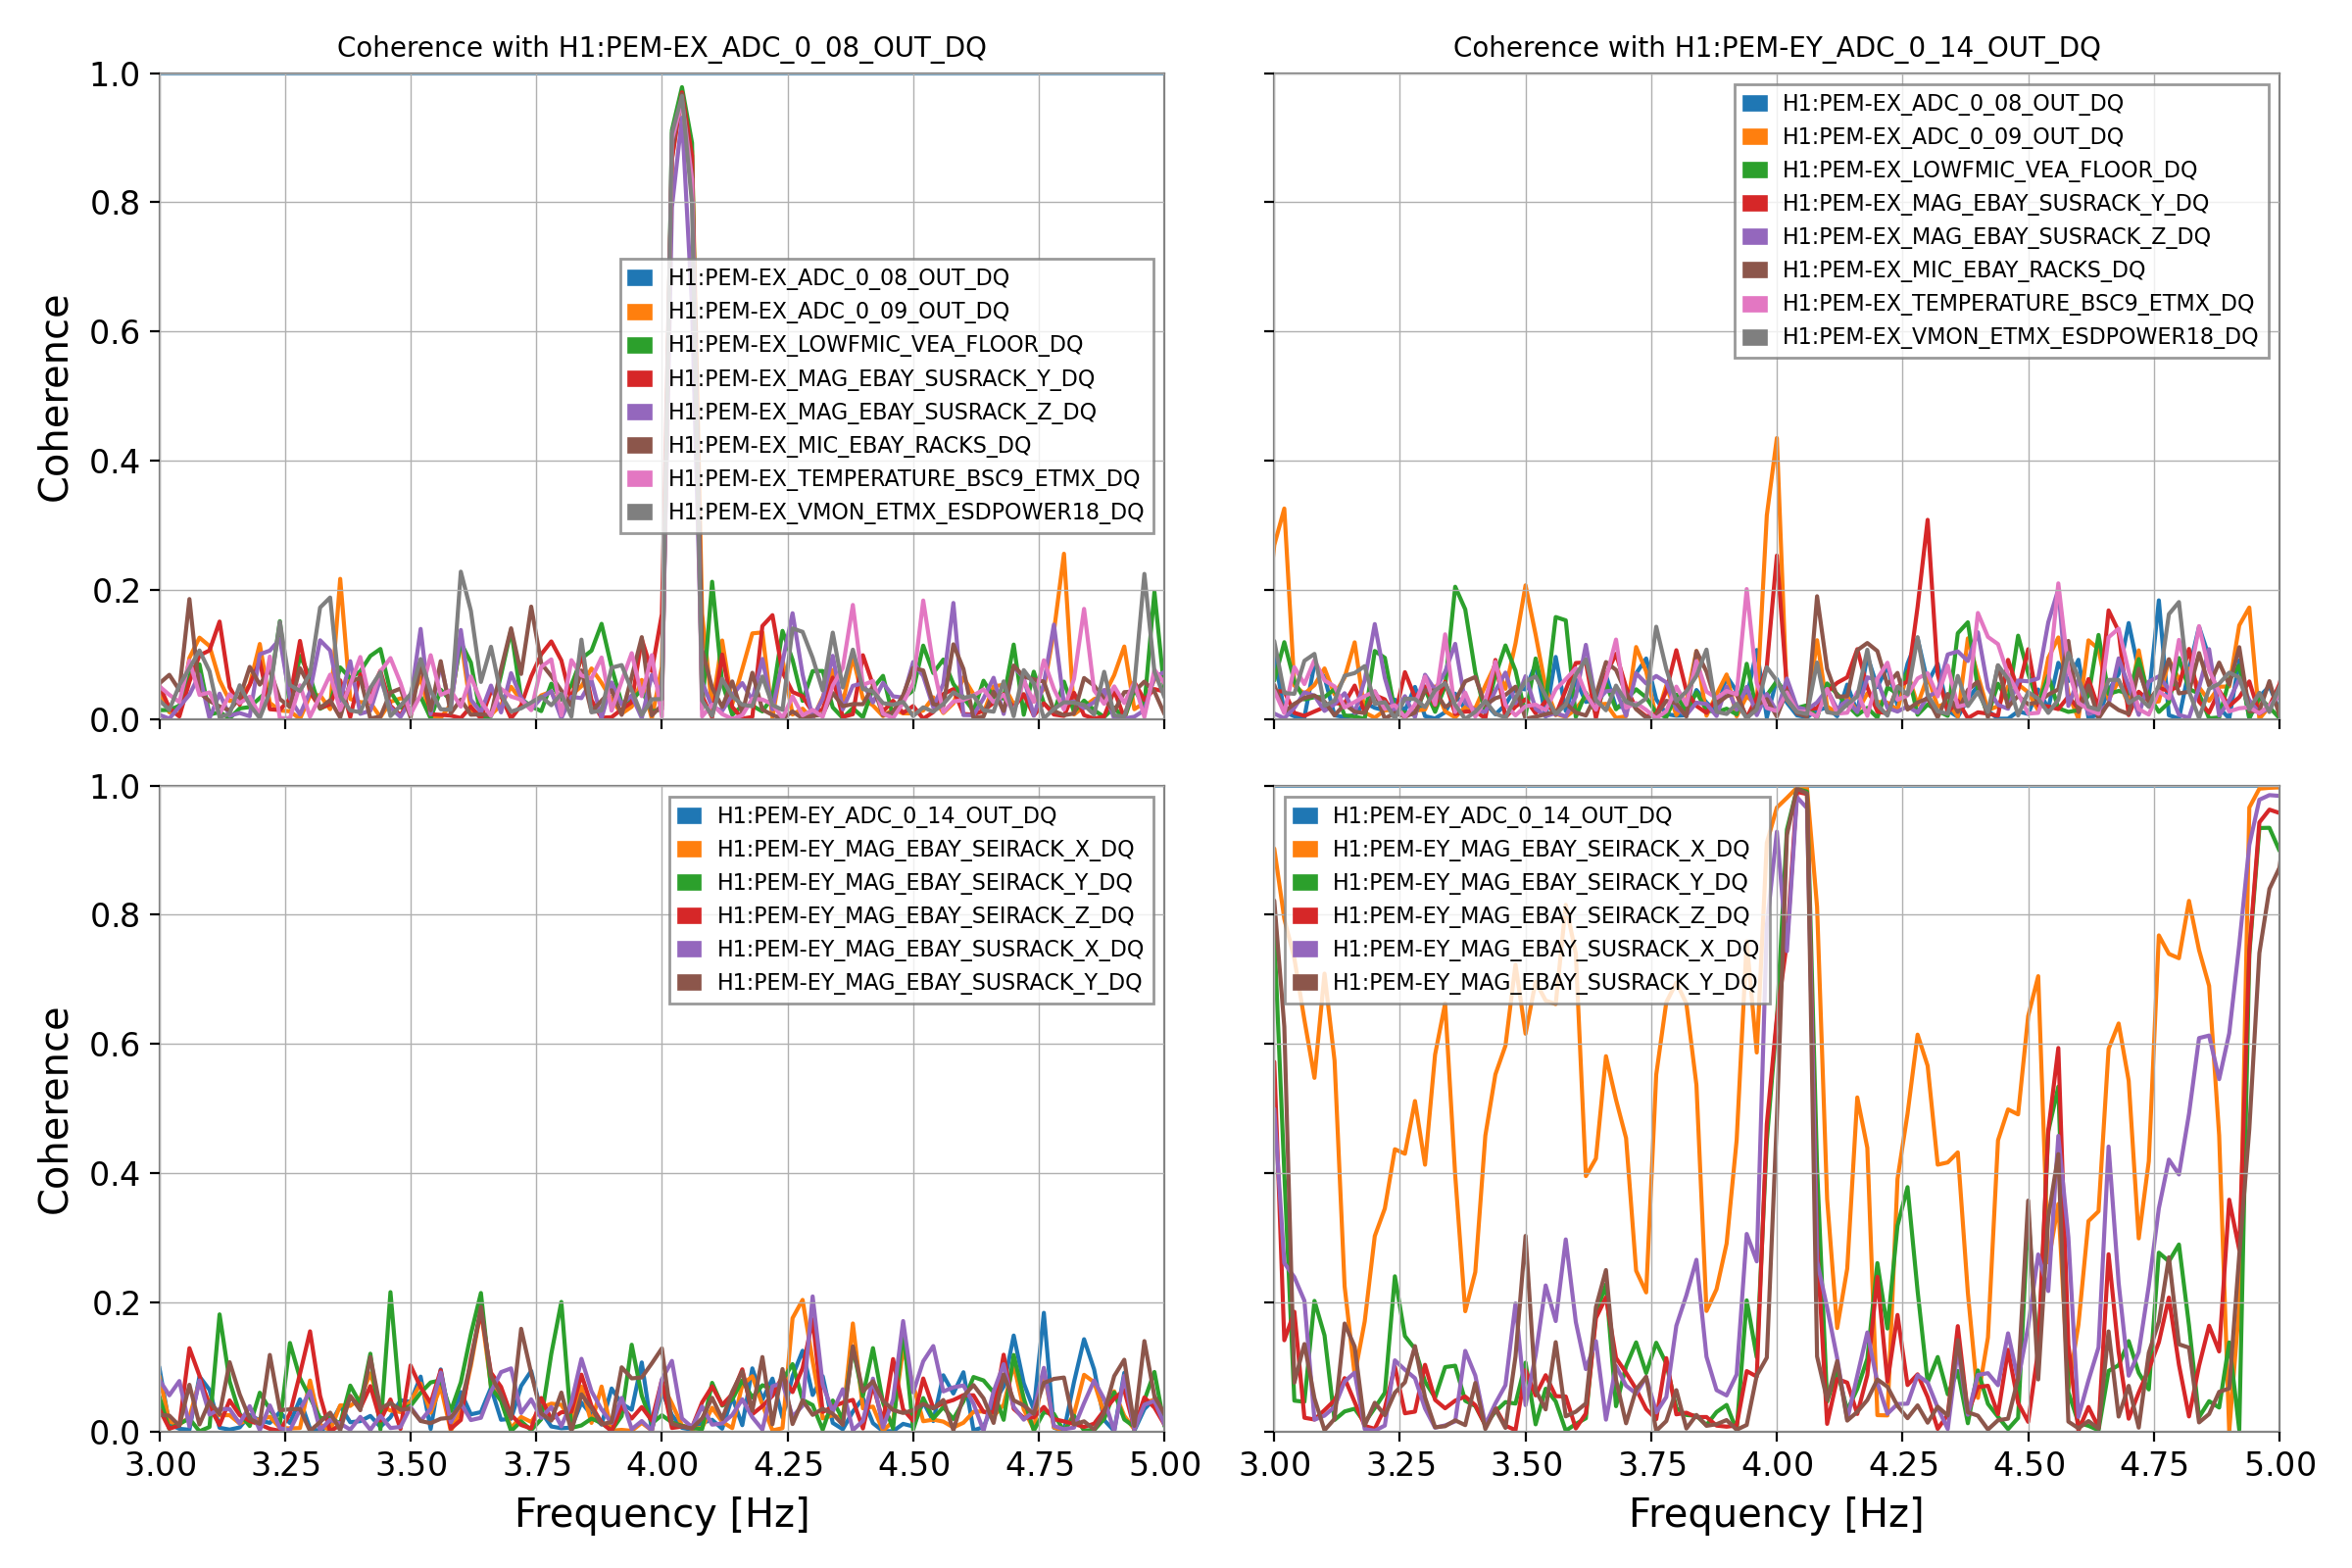
Attached plots shows spectra and time series. Although the frequency of all peaks is very close, EX signals are only coherent among themselves, and not with EY signals, and the other way around too. So it looks like at both end stations there is a source of 4.04 Hz that is local. Maybe a clue? Still, we don't have evidence that those sources are related to the DARM noise.
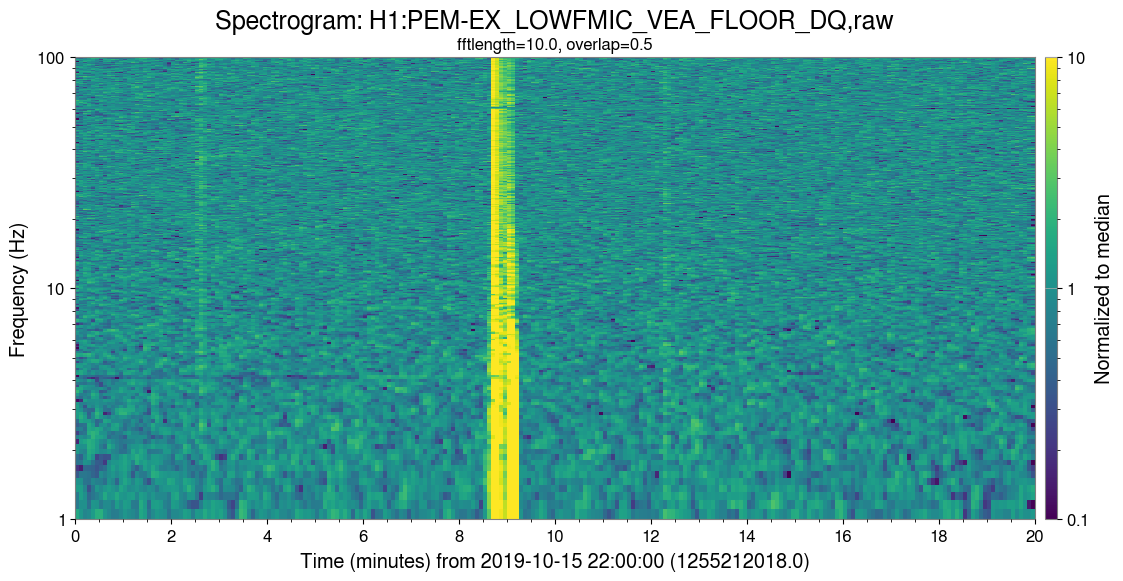
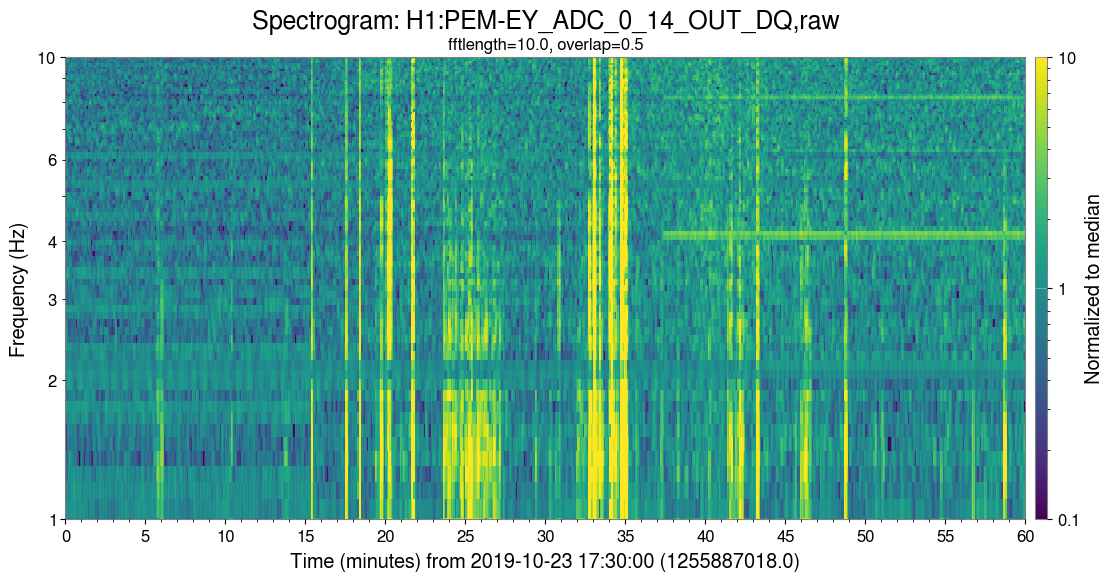
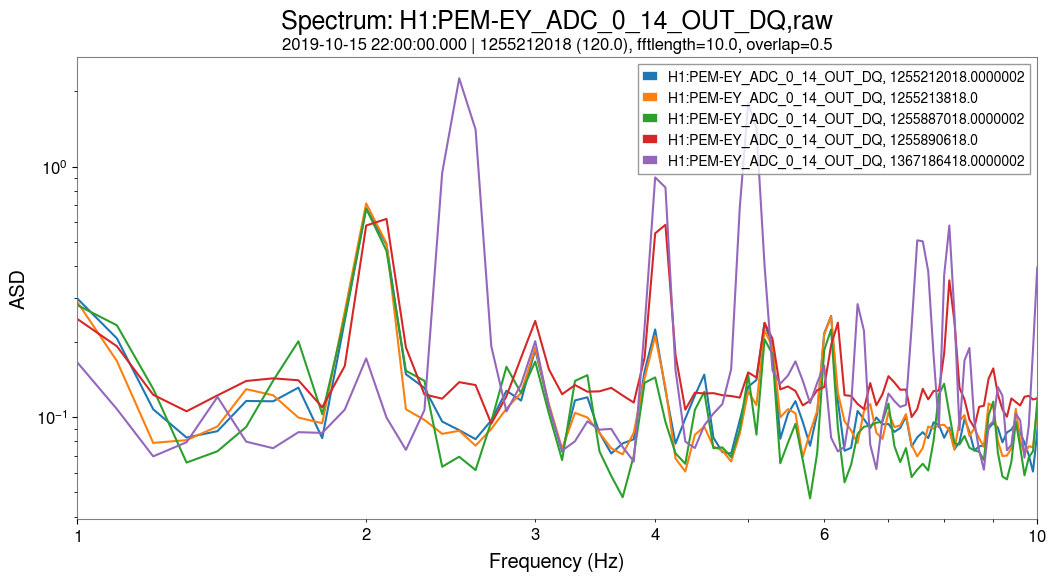
To help track down the source of these lines, I've been investigating the time this feature appeared in these channels. The two channels that were the first to have this feature are H1:PEM-EX_LOWFMIC_VEA_FLOOR_DQ and H1:PEM-EY_ADC_0_14_OUT_DQ, which both have had a 4 Hz line present since October 2019. The exact time of appearance for each is:
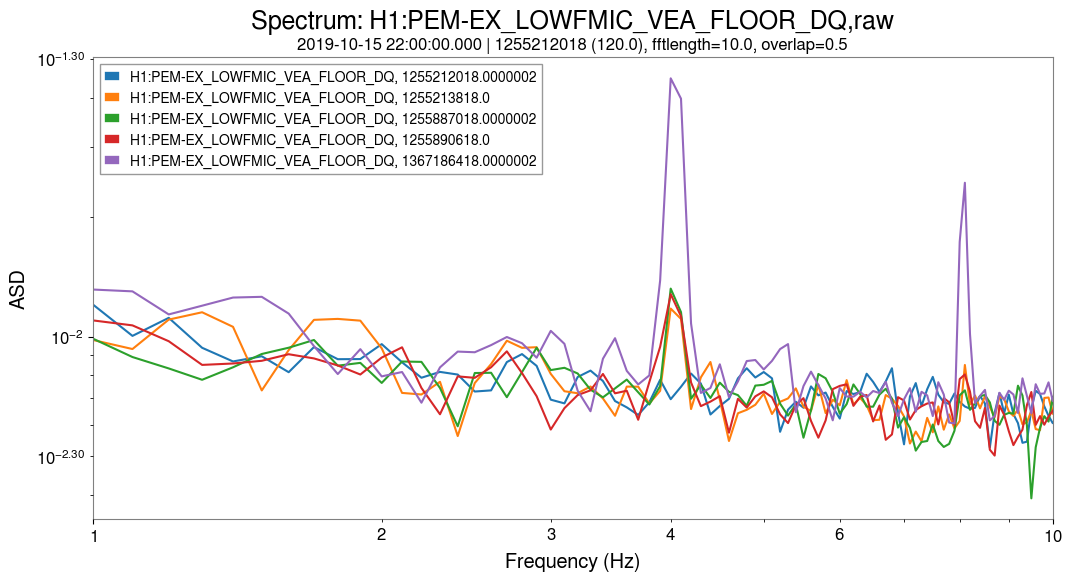
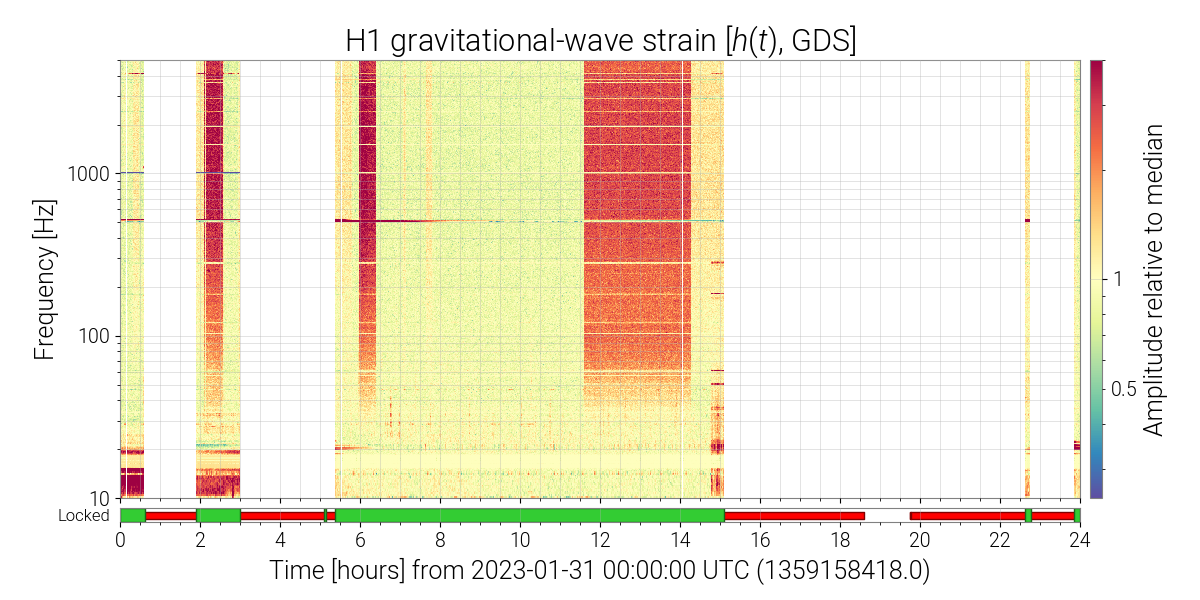
The attached spectrograms show the lines appearing at the above times. I have also includes plots of the channel spectra (plot 3 and plot 4) that show the 4 Hz line before/after these times, as well as a recent time (2023-05-03 22:00:00).
Looking through the alogs posted on these days, there may be an association to install work for BRS heaters. The related EX work (alog 52494) was on 2019-10-15, and the EY work (alog 52542) was on 2019-10-23. The time on both days roughly lines up with when the lines appeared.
The full day shift reports for these days are alogs 52495 and 52656. SInce these days were during the O3a-O3b commissioning break, there are a number of other activities that could be related.
I checked several spectragras from the summary pages during the last month of O3. There was no sign of the 4 Hz bumps.
Looking back at spectrograms since the restart, the first evidence I could find of the 4 Hz bumps is on January 31, 2023. I could not find any sign of the 4 Hz bumps in any lock stretch before that time
Under Robert's suggestion that this might have resulted from some alignment change of the beam at EX (LHO:69578), the ISC_LOCK guardian archives show the following A2L gain changes in January 2023:
The issue with trying to blame the 13 Jan gain change is that there were subsequent long locks with high sensitivity around 30 Hz that did not show the bumps.
Since January, there was also a retuning of the IY P2L/Y2L (commit 463245ed, see LHO:69082).
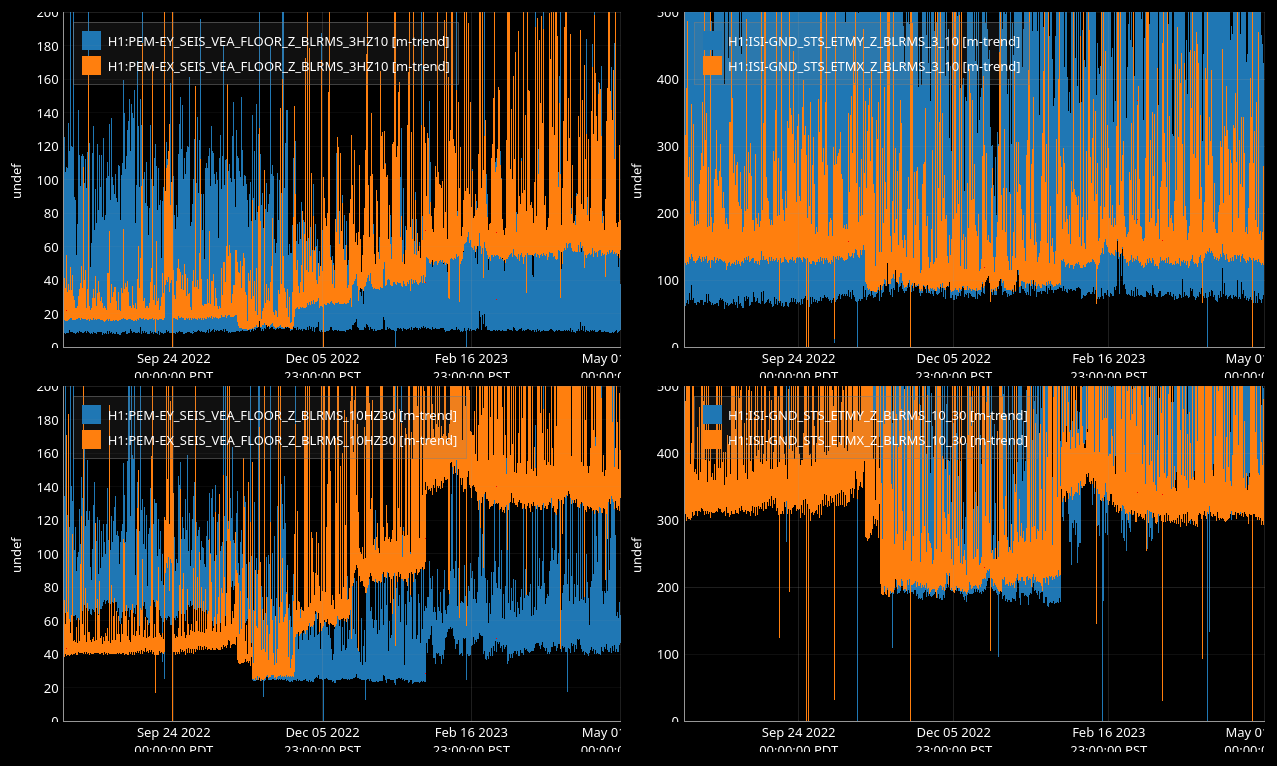
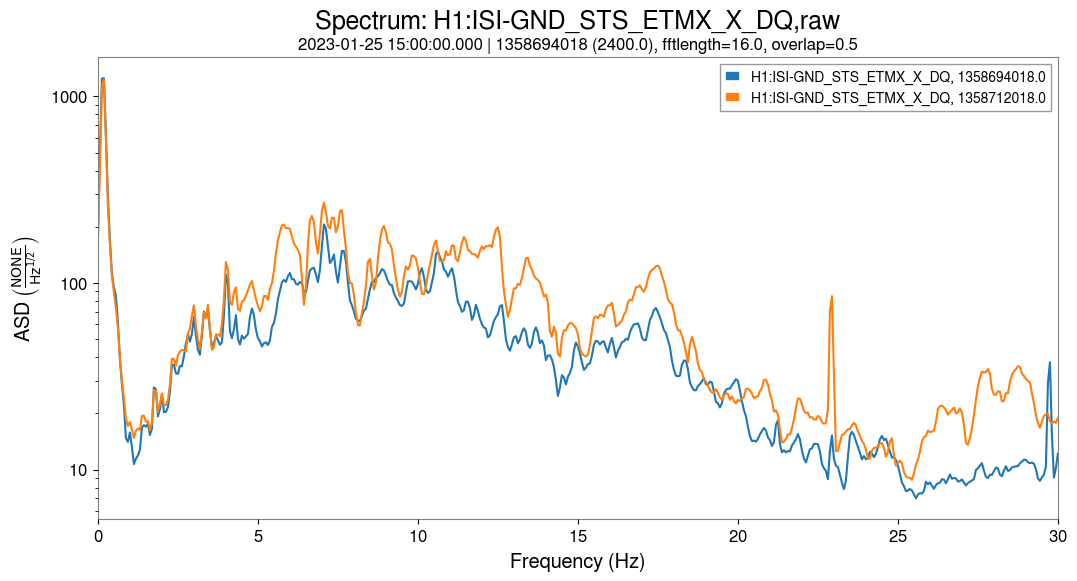
Some more clues — seems like the ground motion at EX from 3 Hz to 30 Hz experienced a step increase on January 25 and has not settled back down since then. The Güralps and STSs agree on this point, but as for what the ground motion was like in the fall of 2022 they seem to diverge.
Looking at the summary pages in fall of 2022 it seems like the bumps were intermittently present in DARM, e.g.: https://ldas-jobs.ligo-wa.caltech.edu/~detchar/summary/day/20220902/#gallery-6
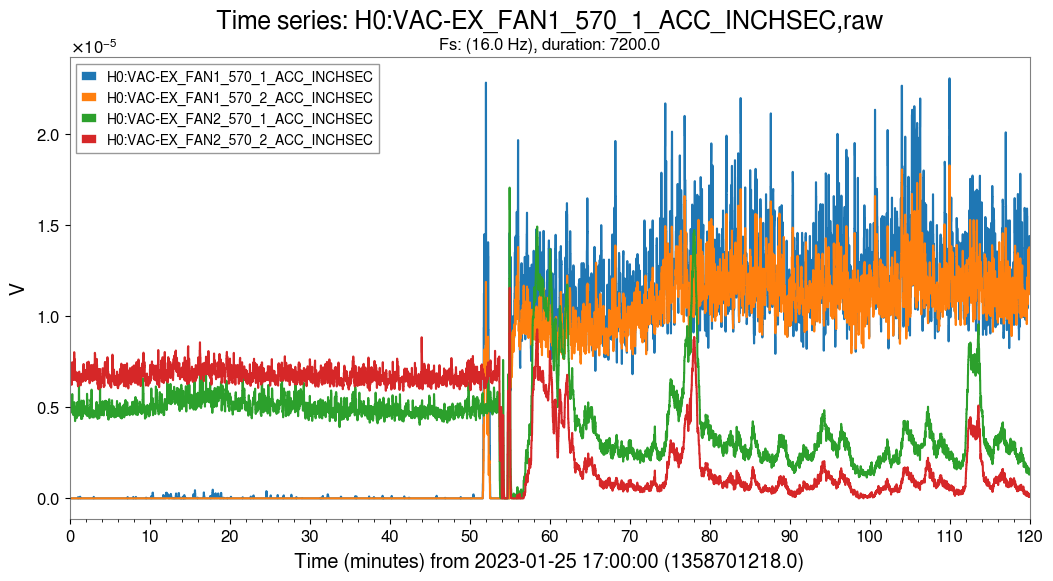
The increase in ground motion corresponds to turning on FAN1 at each of the end stations. Betsy points to alog 67055 indicating this work, and the change can be seen on the fan vibrometers (first attached plot). There is a peak at 22.5 Hz that pops up, and a broad increase in noise which includes the 4 Hz region, though not so strongly (attachment 2).
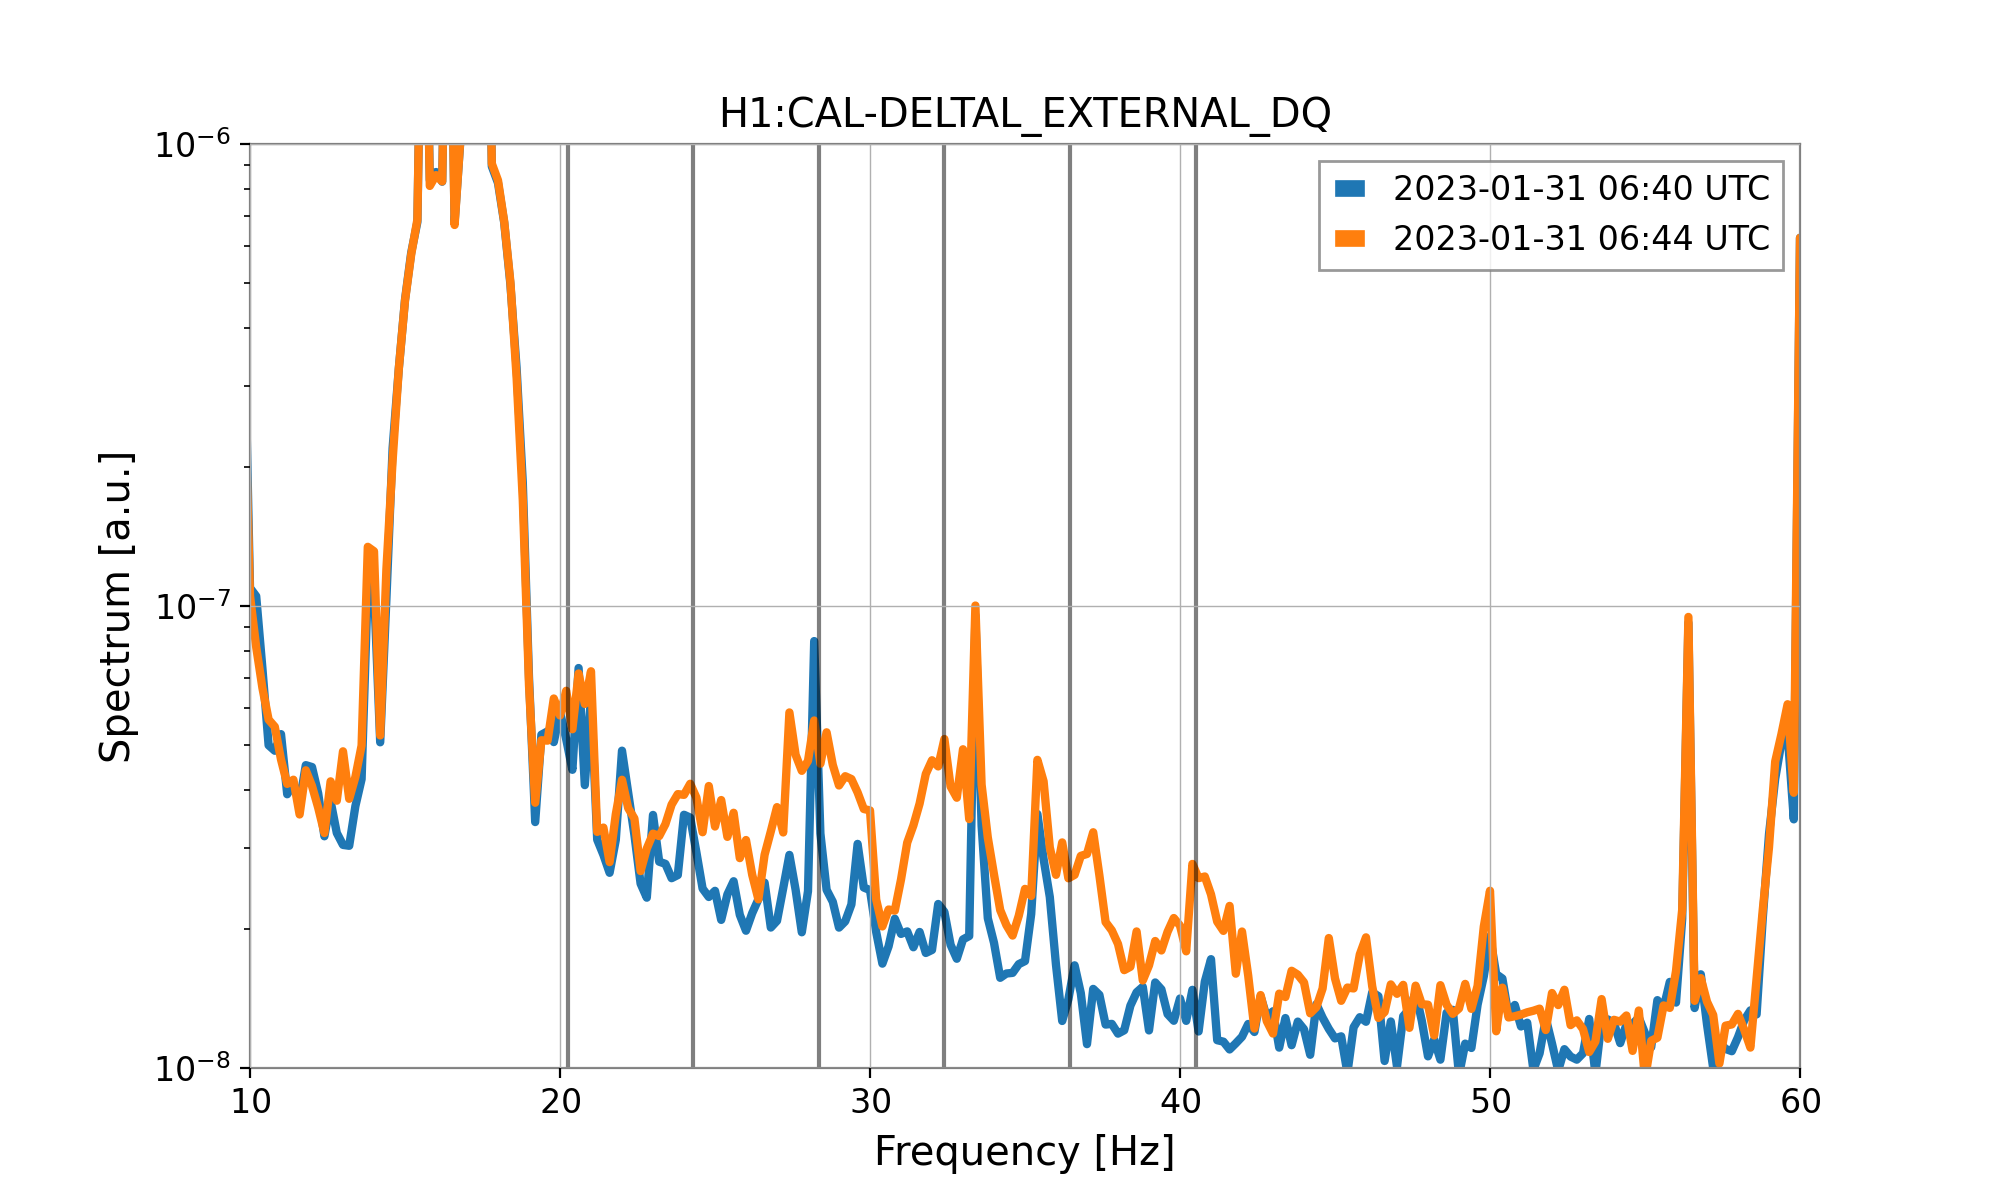
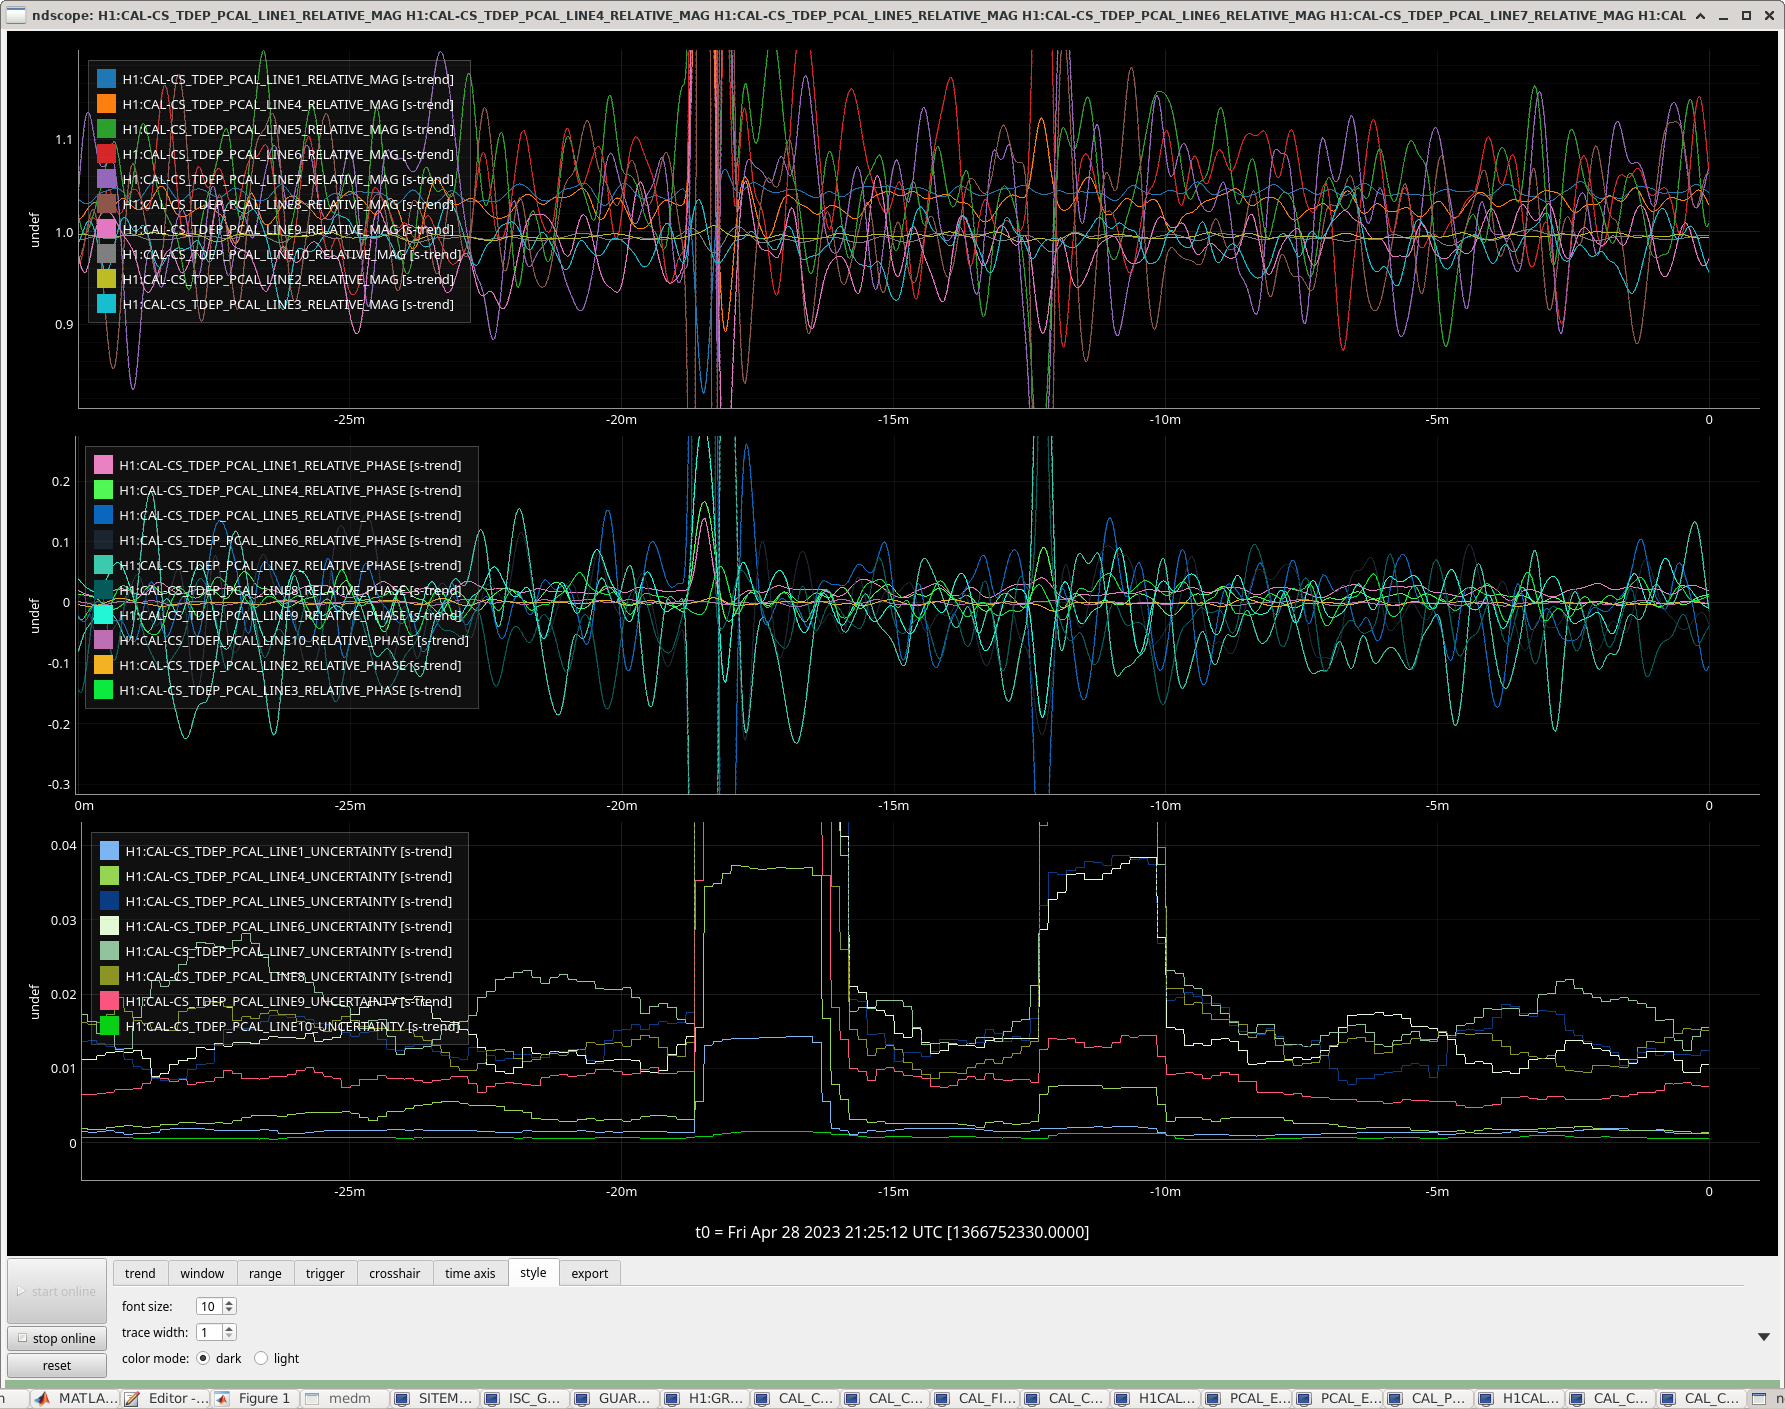
J. Kissel, E. Goetz Executive Summary: We are now calculating the systematic error in H1:CAL-DELTAL_EXTERNAL_DQ "live" constantly at the TDCF line and systematic error monitor line frequencies (i.e. all PCAL calibration line frequencies), and the DELTAL_EXTERNAL / PCAL transfer functions are all showing values close to 1 in magnitude and 0 degrees in phase, around ~5% deviation in magnitude, ~3 deg deviation in phase. Details: Some links to the details regarding the installation and commissioning the new calculation of calibration systematic error in CALCS, which only started this past Tuesday. 1) First installation on Tuesday Apr 25 2023 LHO aLOG 68961 2) Filling out the new infrastructure MEDM screens LHO aLOG 68999 3) Installing and updating DEMOD filters LHO aLOG 69112, LHO aLOG 69117, and LHO aLOG 69143 4) Populating the "DARM model transfer function values at calibration line frequencies for TDCFs and systematic error monitoring" (aka "EPICS records") LHO aLOG 69061 and LHO aLOG 69159 During the commissioning of this infrastructure, we had some trouble getting correct results, especially for frequencies below a few hundred hertz. This led us to investigate and identify a few problems. 1) one of the narrow bandpass filters for a line was incorrectly placed, but we updated it and found some consistent (incorrect) results with other frequencies (LHO aLOG 69112) 2) the values for optical gain, cavity pole frequency, and actuator gains in the pydarm_H1.ini file in the git repository and local version at /ligo/groups/cal/H1/ifo/pydarm_H1.ini did not have consistent values compared against the recently installed values in CALCS (see LHO aLOG 69047). We then updated the pydarm_H1.ini file to fix this, but we were still finding incorrect answers. The complete solution was to make sure the CALCS actuation output matrix and pydarm_H1.ini file had the same values for the x-arm: -1. *** 3) The "human vs. machine modification of parameter file" loop needs to be closed after an MCMC result gets pushed to the front end CALCS model. Meaning, the parameter file needs to get updated values before calculating TDCFs, otherwise TDCFs calculated from this parameter file directly will create invalid calibration results, without us realizing it. Now we have finally sorted this out, the values produced by the calibration systematic errors are starting to look pretty good. Note that this is a measurement of the systematic error on H1:CAL=DELTAL_EXTERNAL_DQ corrected for the known static systematic errors GDS/CALCS (mostly impacting at high frequency for super-Nyquist poles), but does not correct for any time dependence of the interferometer. Attached are two figures showing the systematic error calculated via this new infrastructure for today. - 2023-04-28_SYSERROR_LINES_FirstResults_30minutetrend.png shows a 30 minute trend of the channels. There will be lots of further, standard, improvements we can make to these demod outputs that we'll likely implement over the next week. But, one can clearly see that lines with the higher SNR in DARM show nice clean answers. Here, the phase is in radians. - 2023-04-28_SYSERROR_LINES_FirstResults.pdf since we're far more used to looking at the systematic error in the frequency domain, we took a 180 sec average of the systematic error answers and then transposed them by hand on to a bode plot. This conveys the same result -- the louder PCALY "TDCF" lines have a lower uncertainty than the quieter PCALX "Systematic Error" lines. Also note that the phase in this plot is in degrees. Either way, one can see the magnitude is 1 +- 0.04, with a noise of ~10% and phase is 0 +/- 2 degrees with a noise of ~5 deg. Go team! Note that this is not the normal multiplicative systematic error (aka "eta values") because it is DELTAL/PCAL. This is the inverse of an eta, so to correct the DELTAL you need to divide by these values. Tricky. *** There had been some previous discussions (see the latter pages of G2300832) indicating that to get correct GDS filters required the CALCS values to be -1 and the pydarm_H1.ini file to be +1. This does not appear to be true, at least for the EPICS records installed in CALCS. This may mean that either GDS is doing something to include a -1 where it should not, there is a mistake in a method used by GDS to export transfer functions from pyDARM, or it could mean that an ini file previously used to generate GDS filters were using incorrect values and we need to solidify/sort out which copy of the parameter file is the parameter file. Further investigation is needed here!
Here's the map of calibration line frequency to DEMOD names (LINE${n}), and the channel names for the magnitude, phase, and uncertainty.
17.1 H1:CAL-CS_TDEP_PCAL_LINE1 _RELATIVE_MAG _RELATIVE_PHASE _UNCERTAINTY
24.5 H1:CAL-CS_TDEP_PCAL_LINE4 | | |
33.43 H1:CAL-CS_TDEP_PCAL_LINE5 | | |
53.67 H1:CAL-CS_TDEP_PCAL_LINE6 | | |
77.73 H1:CAL-CS_TDEP_PCAL_LINE7 | | |
102.13 H1:CAL-CS_TDEP_PCAL_LINE8 (same) | |
283.91 H1:CAL-CS_TDEP_PCAL_LINE9 | | |
410.2 H1:CAL-CS_TDEP_PCAL_LINE10 | | |
410.3 H1:CAL-CS_TDEP_PCAL_LINE2 | | |
1083.7 H1:CAL-CS_TDEP_PCAL_LINE3 V V V
Recall that the uncertainty, UNC, in radians, is derived from the coherence, C, where UNC = sqrt(1-C / 2 * Navg * C)), where "Navg" is set by the H1:CAL-CS_TDEP_COH_BUFFER_SIZE channel, and the FFT length, set by H1:CAL-CS_TDEP_COH_STRIDE, should match the corner frequency of the low pass that's used in the DEMODs.
Some further notes:
- the 24.5 Hz line is a part of the temporary collection to monitor how thermalization of the IFO impacts systematic error during the engineering run, so that DEMOD and its line will be turned off for the remainder of the run.
- the 17.1 and 410.3 Hz are a part of the determination of time-dependent correction factors. Though the answer, [[ DELTAL_EXTERNAL * (GDS / CALCS) ]] / PCAL is NOT corrected for TDCFs, the answer from these two lines is kind of "in loop" for GDS-CALIB_STRAIN, which DOES correct for TDCFs.
- All lines other than the 24.5 Hz are now expected to be permanent, and continue through into O4, as per LHO:68289.
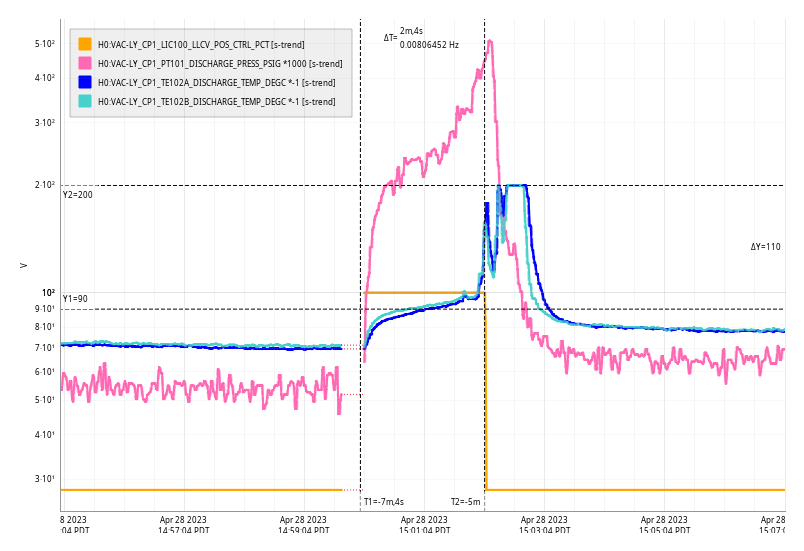
Fri Apr 28 13:18:55 2023 INFO: Fill completed in 3min 55secs
Bad Fill.
Even with the new trip temps of -100C today's fill was not good. The TCs started around their nominal limits, in fact TC-B was not used for the fill because it started at -74C and nominal was -70C. TC-A quickly exceeded the -100C trip level.
We will give the TCs time to warm up and try again at 15:00 with new settings: trip=-120C and tc-nom=-90C.
Second try was successful.
Fri Apr 28 15:02:04 2023 INFO: Fill completed in 2min 4secs
Gerardo confirmed a good fill via camera. New settings are shown in attachment.
Here is the corrected plot showing the new -120C trip temperature.
Following up on LHO aLOG 69061, we modified a local checkout of the pydarm_H1.ini file to be consistent with front end FOTON filter bank values for the inverse sensing gain, exported the inverse sensing filter that has a new cavity pole frequency, and the actuation gain values (N/A or N/V^2) so that the pyDARM model output would give the correct answer. Note that pyDARM assumes that gain values given in the ini file match what is installed in the FOTON filter banks. If not, then inconsistencies can arise. In addition we verified that the CALCS actuation output matrix (all are -1 for the LHO X-arm) and the pyDARM values are consistent. Here, the pydarm_H1.ini file had +1 for all values, but it had been giving values that didn't make sense when installed. We changed them back to -1 in the ini file and got more consistent results. We've recently had some discussions about the GDS filters giving incorrect answers because of minus sign problems (see G2300832; the fact that pyDARM gives a much better answer using values that match the front end, this might mean (maybe) the problem lies not within the model but within how the GDS filters are generated or applied. This needs additional attention. Below are the updated EPICS record values for the PCAL DELTAL corrections: 'CAL-CS_TDEP_PCAL_LINE1_DELTAL_PCAL_CORR_REAL': 0.0033852702240058613, 'CAL-CS_TDEP_PCAL_LINE1_DELTAL_PCAL_CORR_IMAG': 0.0003688309923906657, 'CAL-CS_TDEP_PCAL_LINE2_DELTAL_PCAL_CORR_REAL': 5.918160347836006e-06, 'CAL-CS_TDEP_PCAL_LINE2_DELTAL_PCAL_CORR_IMAG': -3.8606119335684666e-07, 'CAL-CS_TDEP_PCAL_LINE3_DELTAL_PCAL_CORR_REAL': 8.389172516042244e-07, 'CAL-CS_TDEP_PCAL_LINE3_DELTAL_PCAL_CORR_IMAG': -1.5076809464241352e-07, 'CAL-CS_TDEP_PCAL_LINE4_DELTAL_PCAL_CORR_REAL': 0.00165323521544998, 'CAL-CS_TDEP_PCAL_LINE4_DELTAL_PCAL_CORR_IMAG': 0.00011505749801666585, 'CAL-CS_TDEP_PCAL_X_COMPARE_DELTAL_PCAL_CORR_REAL': -5.9211839406814295e-06, 'CAL-CS_TDEP_PCAL_X_COMPARE_DELTAL_PCAL_CORR_IMAG': 3.8609892061668445e-07, 'CAL-CS_TDEP_PCAL_Y_COMPARE_DELTAL_PCAL_CORR_REAL': 5.918160347836006e-06, 'CAL-CS_TDEP_PCAL_Y_COMPARE_DELTAL_PCAL_CORR_IMAG': -3.8606119335684666e-07, 'CAL-CS_TDEP_PCAL_LINE5_DELTAL_PCAL_CORR_REAL': -0.0008859219262577612, 'CAL-CS_TDEP_PCAL_LINE5_DELTAL_PCAL_CORR_IMAG': -3.9867889605789786e-05, 'CAL-CS_TDEP_PCAL_LINE6_DELTAL_PCAL_CORR_REAL': -0.00034094924519537996, 'CAL-CS_TDEP_PCAL_LINE6_DELTAL_PCAL_CORR_IMAG': -8.284228371577319e-06, 'CAL-CS_TDEP_PCAL_LINE7_DELTAL_PCAL_CORR_REAL': -0.00016249959919441566, 'CAL-CS_TDEP_PCAL_LINE7_DELTAL_PCAL_CORR_IMAG': -3.251411986550448e-06, 'CAL-CS_TDEP_PCAL_LINE8_DELTAL_PCAL_CORR_REAL': -9.46064626745444e-05, 'CAL-CS_TDEP_PCAL_LINE8_DELTAL_PCAL_CORR_IMAG': -1.5341758740447534e-06, 'CAL-CS_TDEP_PCAL_LINE9_DELTAL_PCAL_CORR_REAL': -1.2512538215094095e-05, 'CAL-CS_TDEP_PCAL_LINE9_DELTAL_PCAL_CORR_IMAG': 5.893565987708546e-07, 'CAL-CS_TDEP_PCAL_LINE10_DELTAL_PCAL_CORR_REAL': -5.9211839406814295e-06, 'CAL-CS_TDEP_PCAL_LINE10_DELTAL_PCAL_CORR_IMAG': 3.8609892061668445e-07, These were installed and accepted in the SDF
To generate the records, we used the pyDARM configuration file pydarm_H1.ini (f1939173bac56a7fff7bde578558bd9da9b71ff4) and the pyDARM method pydarm.calcs.CALCSModel.compute_epics_records(): >>> model = pydarm.calcs.CALCSModel('pydarm_H1.ini') >>> model.compute_epics_records(gds_pcal_endstation=False, gds_sus_endstation=False, gds_darm_omc=False)
We have now had a couple lock losses (at least 1 yesterday, 2 today) due to ~30sec bursts of loud 1-10hz ground motion. This is probably the same thing Tony saw yesterday, that I commented on. These seem to be loudest at EY, which is a little bit closer to the 10-240 intersection than the corner station, so probably it related IS to work on the Highway 240 round-about construction, contrary to my comment yesterday. From google maps, the intersection is 3.7 miles from EY, 5 miles from the corner station. Attached trends show different ground timeseries during the most recent event at about 17:20 utc.
Top two plots are the X and Y ground STS, ITMY X and ETMX X on the left, ITMY Y and ETMY Y on the right. Middle left is Z motion for all 3.
Middle right plot is the 1-3hz blrms for all three STS. The largest motion is at ETMY , ~2x larger than the other for this band.
Lower right is the 3-10hz blrms. Again, loudest at EY, I think these colors aren't great, but all stations see ~10x more motion.
Lower left is a few channels outside of 1-10hz. ITMY doesn't seem to see anything above 10hz. ETMY and ITMY both see 10x in the .3-1hz band. ITMY doesn't see anything in the .1-3hz band. This is all consistent with my spectra from last night, with increased motion .5-10 hz.
I don't know what we can do to prevent this. A 10x increase in motion at these frequencies isn't going to break anything, we aren't tripping watchdogs. But our run time won't be great if this keeps up.
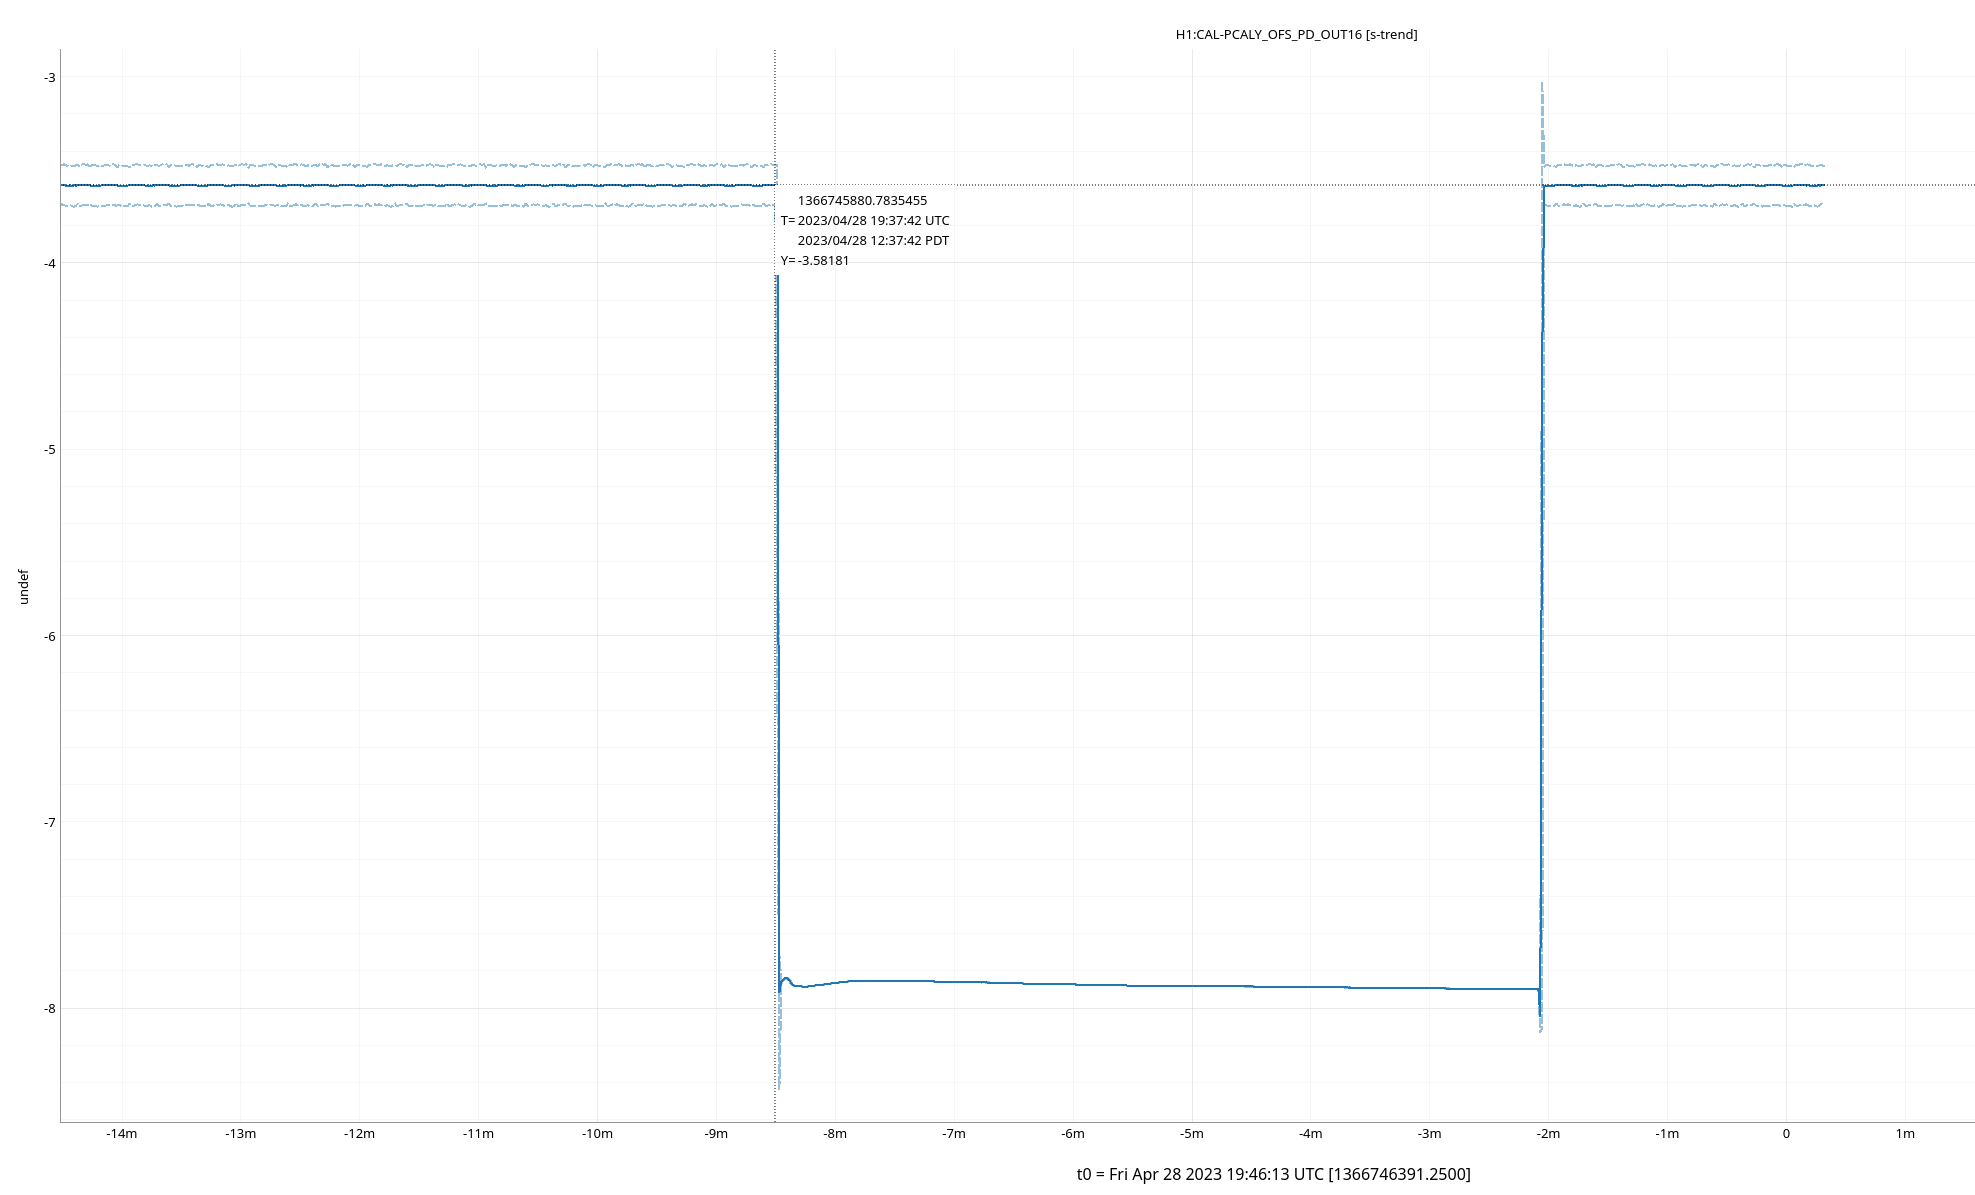
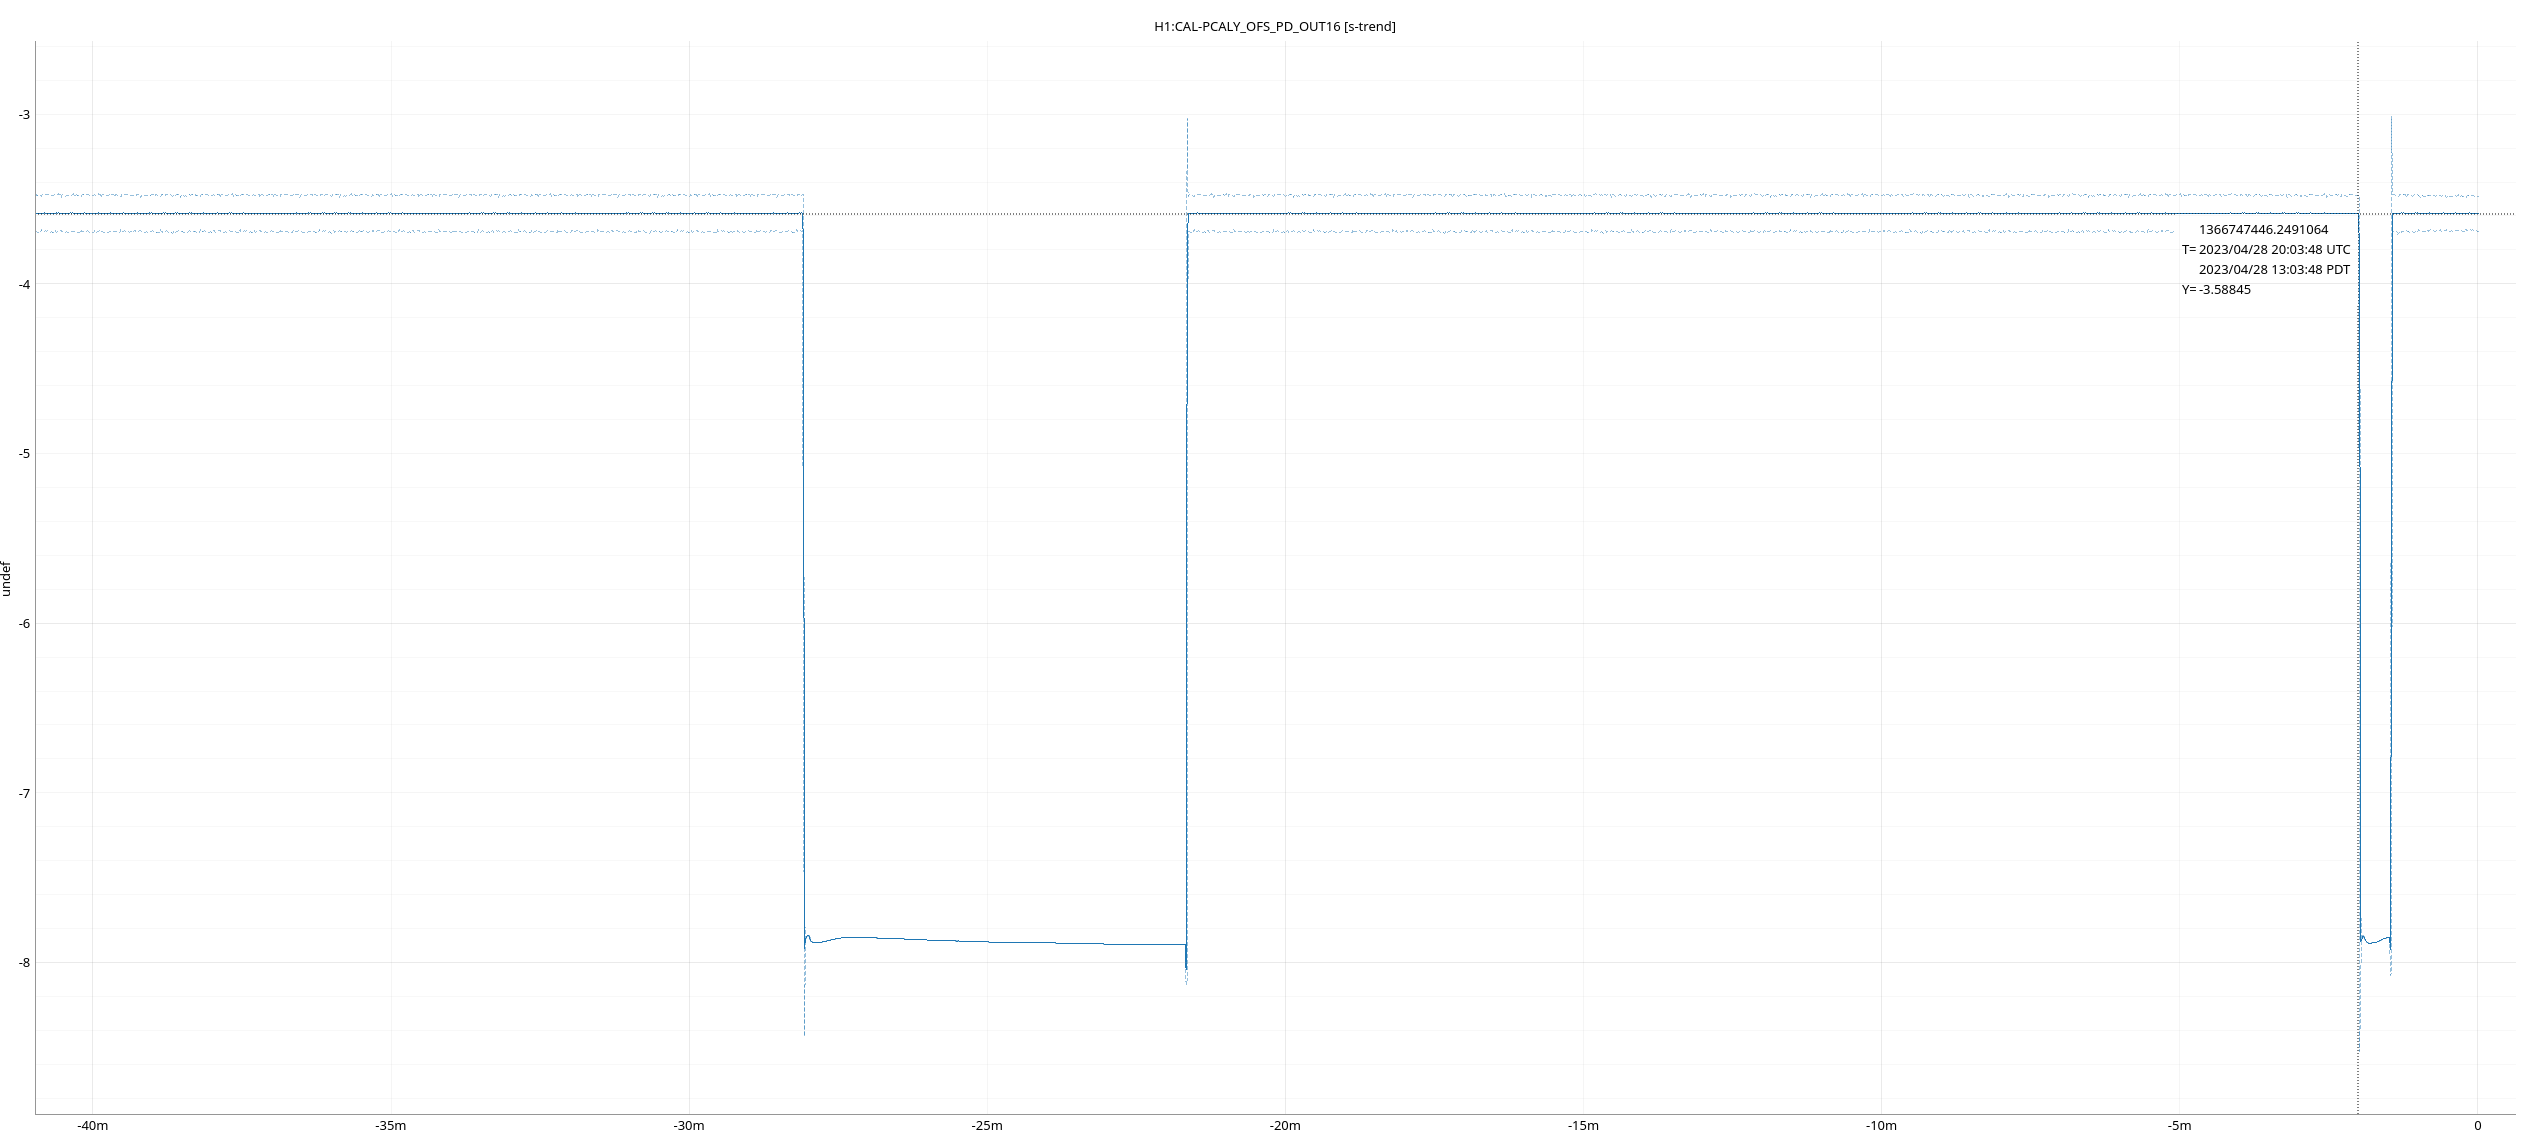
PCALY-OFS_PD saturated at 19:37UTC, we toggled it off and back on to fix it at 19:44UTC
The OFS saturated again at 20:03UTC and was toggled off and back on again.
Suspicious that the issue are the new CAL_AWG_LINES low-frequency PCAL excitations, as defined in LHO:68947, I've reduced the amplitude of all of those PCAL lines by 10% by setting the gain of the H1:CAL-PCALY_DARM bank to be 0.9. We'll run like this for a little bit to see if we like it -- and if we do, I'll edit the gains in the CAL_AWG_LINES guardian.
Ryan S, TJ S
Ryan and I looked into all of the symlinks for the safe and observe files as read from the target area for all of the models that are in our SDF Revert scheme. Column 4, and a bit of 5, of this table shows the awkward web that we've created over the years with some safes linked to observes and some to downs, and one the other way around. These are only a small fraction of all of the models, while we haven't gone into all of the others, I imagine the web is equally as tangled. Since we've been locking decently well and seem to have a working system, I don't think it's worth the effort and potential fallout to clean this all up, but I worry that we could definitely confused ourselves further with this inconsistent linking.
All of this stemmed from some diffs in the ISC_EX and ISC_EY (h1syseyiscsdf) that had their observes linked to their safes. I've now unlinked the safe and observe for the for these and made a new link to an observe.snap that was a copy of the safe. I then accepted the differences when we got to low noise.
| MODEL | DCUID | userapps_area | safe linked to | observe linked to |
| alsex | 85 | als | down | observe |
| alsey | 95 | als | down | observe |
| asc | 19 | asc | down | observe |
| ascimc | 20 | asc | down | observe |
| iscex | 86 | isc | down | observe |
| iscey | 96 | isc | down | observe |
| lsc | 10 | lsc | down | observe |
| omc | 8 | omc | down | observe |
| susbs | 31 | sus | down | observe |
| susetmx | 88 | sus | down | observe |
| susetmy | 98 | sus | down | observe |
| sushtts | 21 | sus | safe | safe |
| susifoout | 46 | sus | observe | observe |
| sussqzout | 22 | sus | observe | observe |
| sussqzin | 162 | sus | safe | observe |
| susfc1 | 161 | sus | safe | observe |
| susfc2 | 168 | sus | safe | observe |
| susitmx | 29 | sus | down | observe |
| susitmy | 30 | sus | down | observe |
| susim | 104 | sus | observe | observe |
| susmc1 | 34 | sus | observe | observe |
| susmc2 | 39 | sus | down | observe |
| susmc3 | 35 | sus | observe | observe |
| susprm | 36 | sus | down | observe |
| suspr2 | 40 | sus | down | observe |
| suspr3 | 37 | sus | down | observe |
| sussrm | 45 | sus | down | observe |
| sussr2 | 41 | sus | observe | observe |
| sussr3 | 44 | sus | observe | observe |
| sustmsx | 89 | sus | observe | observe |
| sustmsy | 99 | sus | observe | observe |
| sysexisc | 1028 | sys | safe | observe |
| syseyisc | 1031 | sys | safe | observe |
h1susfc1, h1susfc2 and h1sussqzin are now using identical SDF files with safe pointing to OBSERVE.
We're in our 3rd lock since I've arrived, 1st lock we're not totally sure what killed it (@ ENGAGE_ASC), 2nd lock may have been from local construction at the rt 240/10 intersection.
Elenna made some gain changes to help speed up ads convergence, TJ and RyanS made some SDF changes and reviewed SDF to fix and find/note some SAFE & OBSERVE files that were undesirably sim-linked
We're at NLN since 18:38UTC and Observing since 19:22UTC, we dropped out momentarily after some EX_ISC SDF diffs appeared then quickly disappeared, back to Observing 19:29UTC
The ADS gain has been doubled so we can converge the ADS faster and move to camera servos. I updated the ads gains in LSC params to be 20. The LSC params value is used by the ISC_LOCK guardian in Lownoise ASC and by the Camera servo guardian. We should keep an eye on this for the next few locks and check that this doesn't rail the ADS at any point.
We have determined we want to operate with higher carm gain. Instead of slowly increasing the carm gain during thermalization, we decided to try increasing it from the start and avoid causing glitches. The SERVO gain for REFL A and B will both be set to 9 dB instead of 6 dB in LASER NOISE SUPPRESSION.
The CARM gain adjustment in the THERMALIZATION guardian has been disabled yesterday
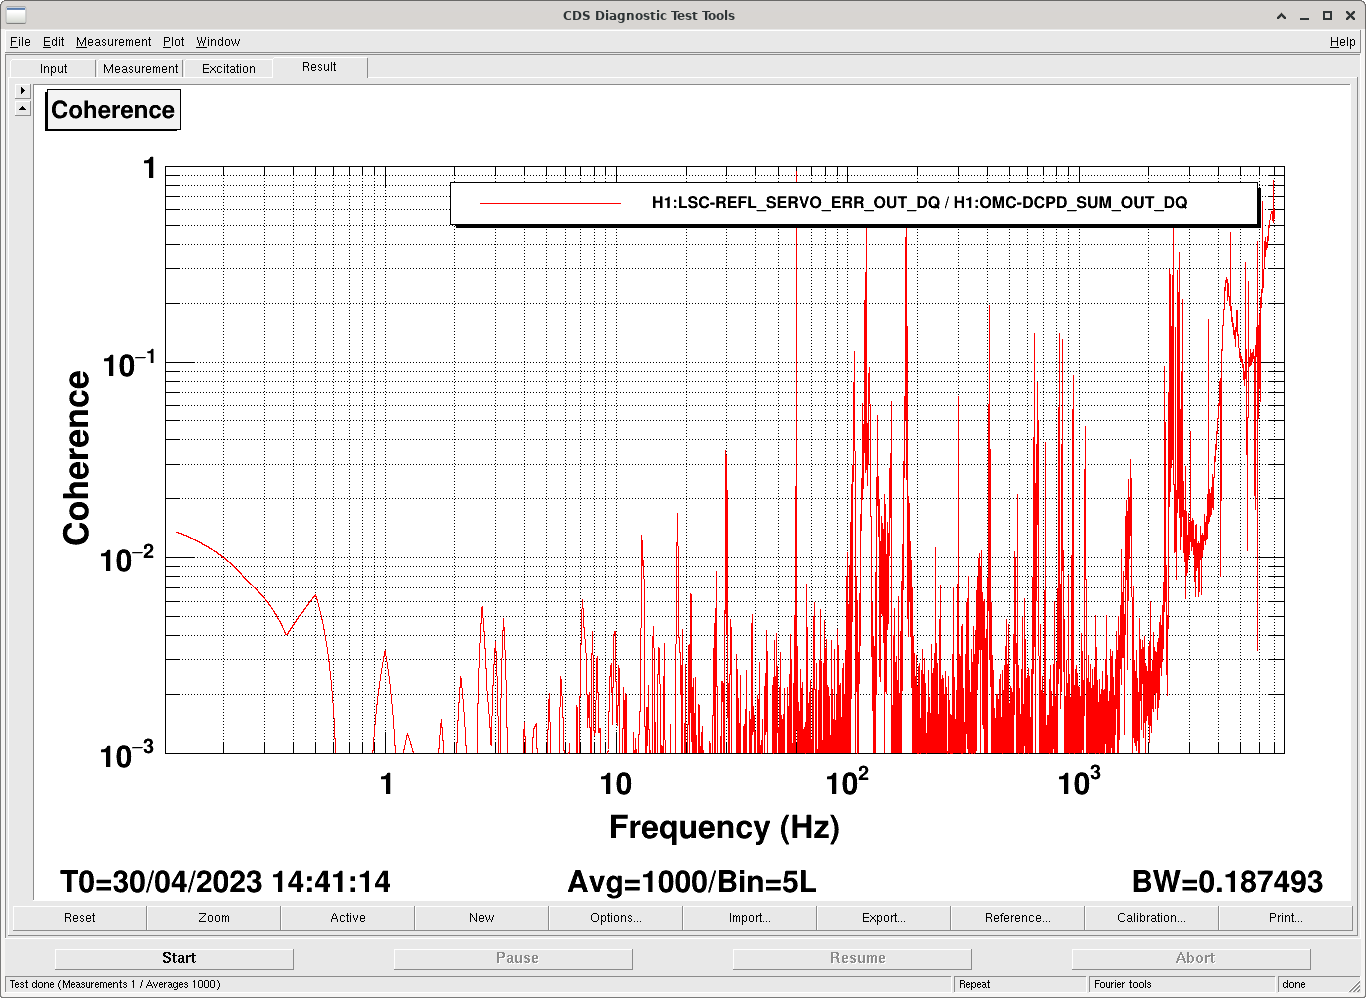
I measured the CARM gain today 30 minutes and 1 hour into the lock stretch to see the effect of the 3 dB increase. See attached plot. I think this plot shows, as predicted, we start with the UGF around 25 kHz, which is a bit high. However, we thermalize back to about where we want the UGF to be. We have not completely suppressed the high frequency "tail" shape in DARM with this gain increase, but we are unlikely to win much more by increasing the gain further. Daniel and I ran a long coherence from the long lock this weekend, see plot, that shows that we are not limited very much at 1 kHz by frequency noise (this time stretch comes well after thermalization is complete). The high coherence around 100 Hz is probably coming from PRCL or SRCL. We think this is a decent place to run for O4. I declare our CARM adjustments complete! I will unplug the SR785 at the next possible opportunity.