david.barker@LIGO.ORG - posted 10:36, Saturday 20 December 2025 (88631)
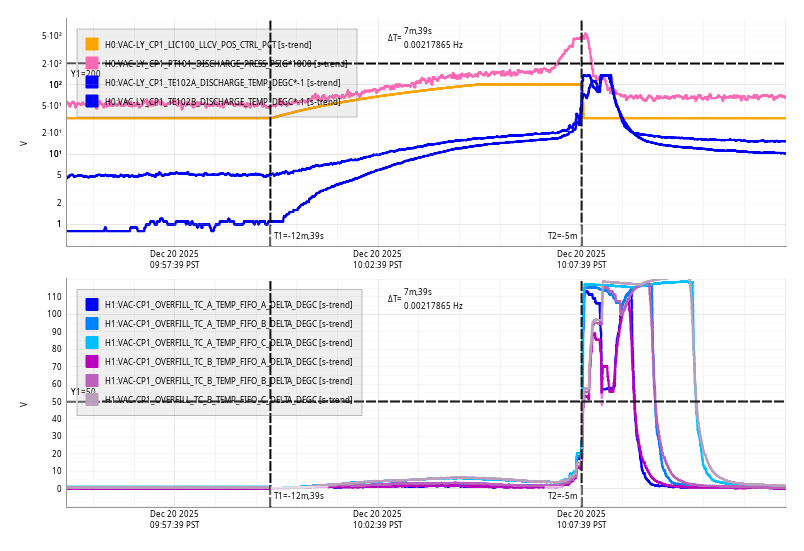
Sat CP1 Fill
Sat Dec 20 10:07:39 2025 INFO: Fill completed in 7min 36secs
Images attached to this report
Sat Dec 20 10:07:39 2025 INFO: Fill completed in 7min 36secs
Gerardo, Richard, Erik, Dave:
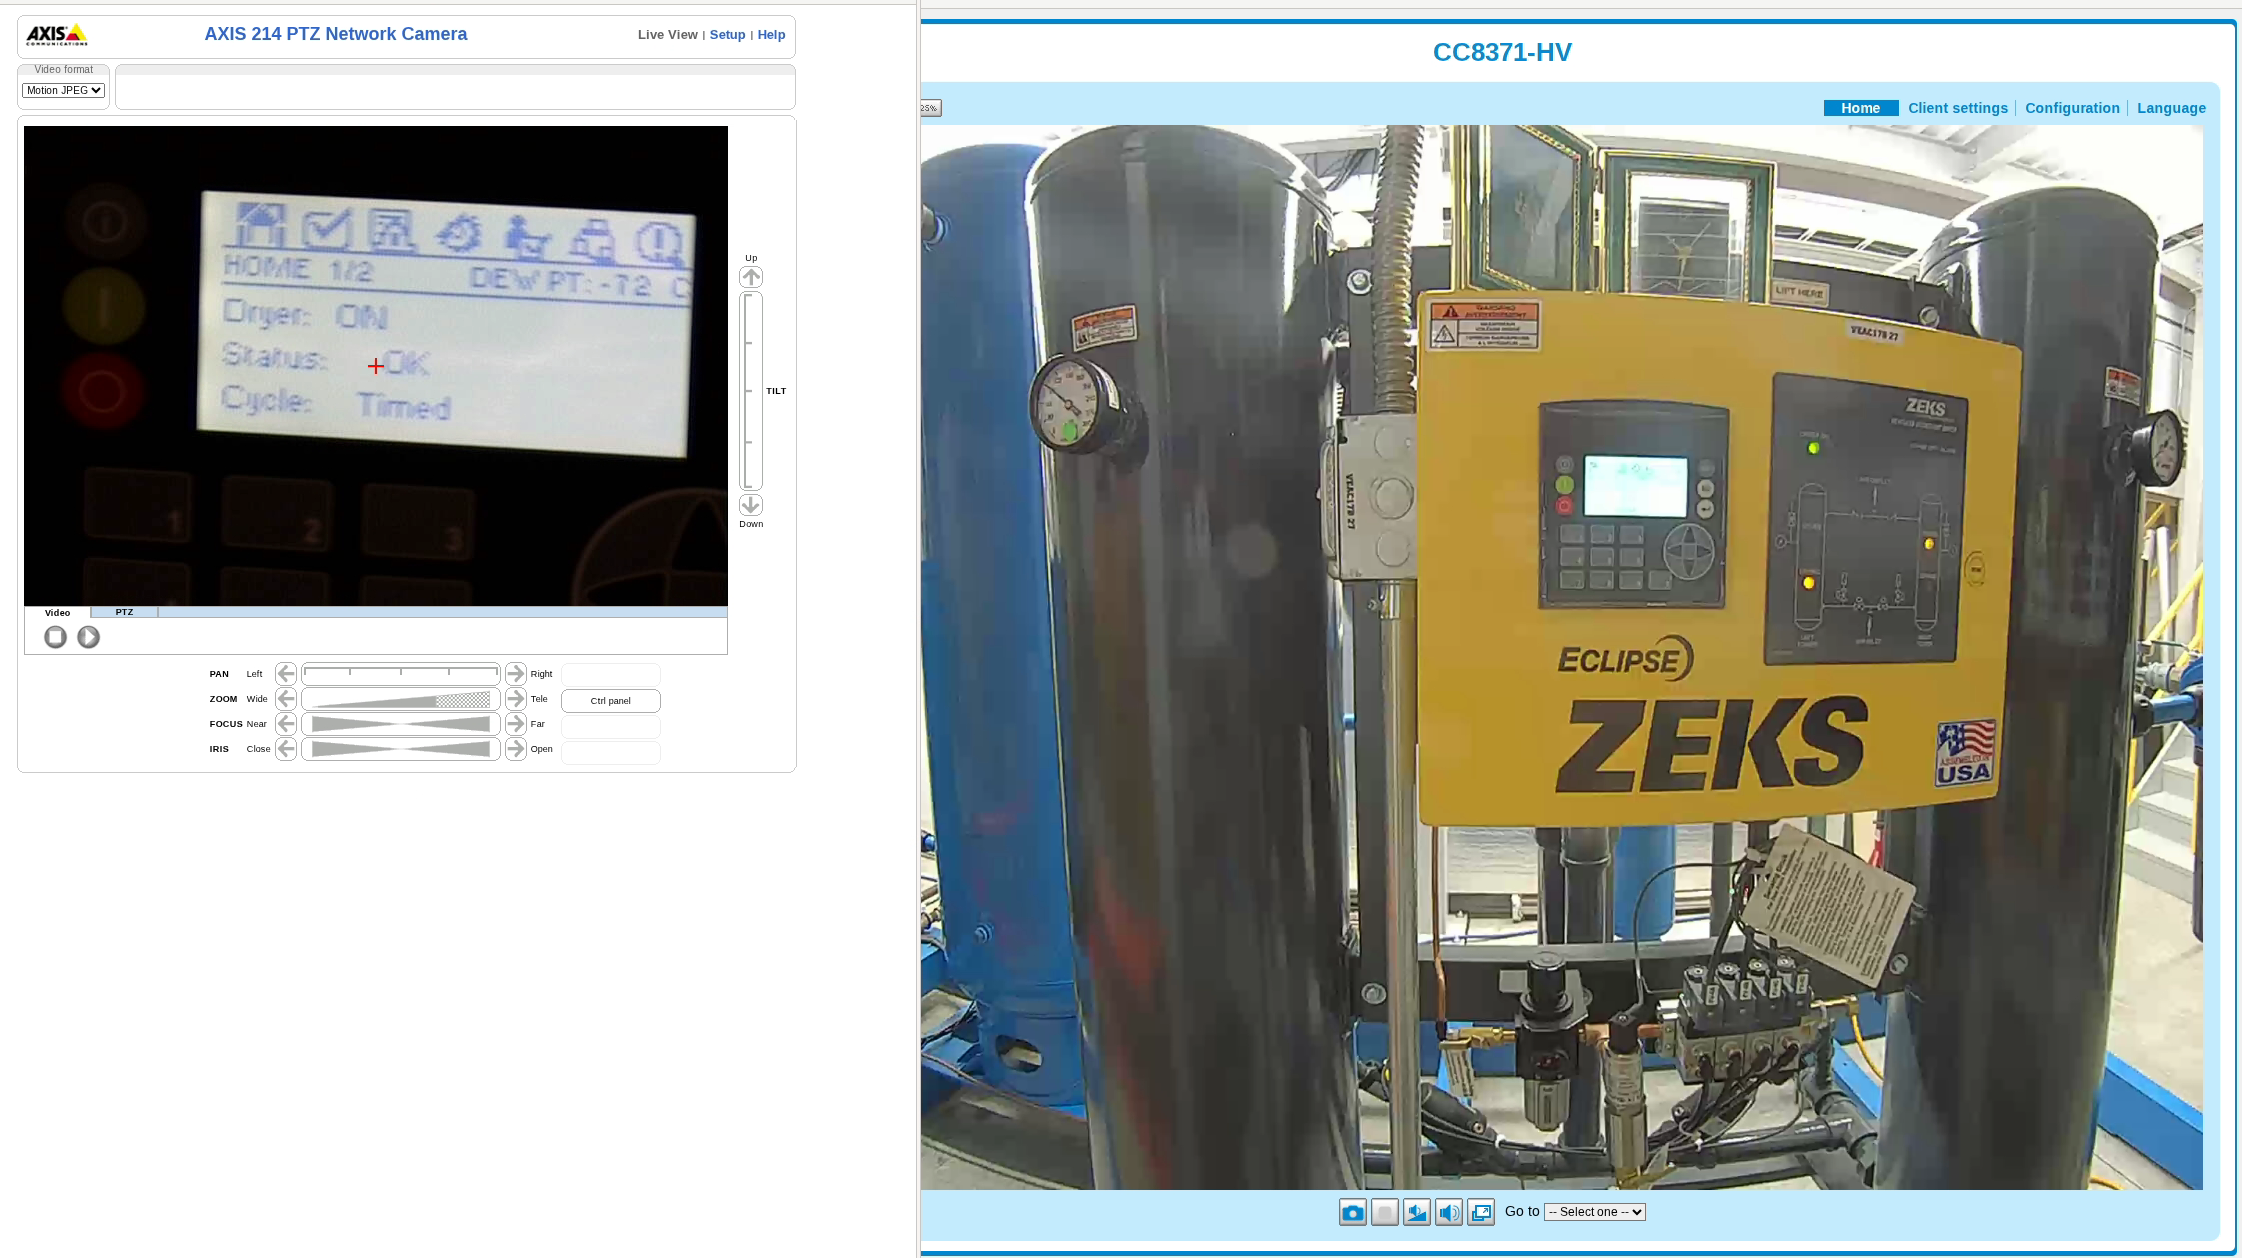
Over the holiday break we need to remotely view the operation of the Zeks Eclipse air dryer skid in the mechanical room to ensure no moisture gets into the LVEA chambers.
I initially setup a fisheye camera (a repurposed gate-cam), which gave a good view of the panel's LEDs and the mechanical gauges, but lacked the resolution to view the LCD display screen to see the Dew Point signal.
I then installed an Axis 214PTZ camera, which was able to zoom into the LCD display and read the values.
So we are now running both cameras side-by-side.
sw-mech-aux was configured to have both ports 13 and 14 on the VID-LAN (10.106.0/24).
I ran two 60-foot cat5e ethernet cables from the vacuum rack (where the switch is located), over to the front of the Zeks skid, using the overhead mezzanine railing to provide a temporary "cable tray".
| Camera | name/ip | ethernet connection |
| fish-eye (POE) | wincam (10.106.0.243/24) | long run to POE injector on top of vac rack, short run to switch port14 |
| PZT cam | mechcam (10.106.0.244) | direct to switch port13 |
Because the Axis camera is AC powered, we ran an extension cable from the vac rack to the base of the skid, passing it under the stairs to prevent it being a trip hazard.
Next to do:
1) fish-eye cam does not seem to be streaming, I have to hit reload on my web browser to refresh the image.
2) start software to capture these images every minute and post them to the CDS web page
Erik, Tony, TJ, Jonathan, Dave:
at 12:04 Fri 19dec2025 PST we had a MSR network switch failure which took down the network for all the front ends, the /opt/rtcds NFS server and Guardian.
The Brocade Ruckus Network Switch SW-MSR-H1FE-STK (1/3) was found to be powered off (no LEDs illuminated). This is a ICX7150-48-4X10GR-RMT3 48port unit with firmware version 08.0.95g.
This unit is being powered by a Geist power distribution box, which itself is UPS powered, so all power cords are ORANGE. A second switch is also being powered by the Geist, and both it and the Geist were powered up.
We disconnected the failed switch's power cord (as found it seemed to be well connected, not loose) and plugged it back in, the switch did not light up. We then ran a longer power cord to the main rack power strips, again the switch did not light up. We then returned to the original power cord from the Geist.
While we were scratching our heads planning the next move we noticed the switch was lit up. We think it took at least a few minutes to show signs of life after its power cord was inserted.
We then let it boot up, which took a suspiciously long time, we expected something like 5 minutes but it was actually close to 15 minutes. At that point the network was returned to all the systems attached to this switch.
At this point all the front ends had returned in their running state, except h1sush12 and h1asc0 which had persistent DAQ errors. We restarted these frontends.
Many Guardian nodes were disconnected from the frontends, so we elected to reboot h1guardian1. It came back up with no problems.
Currently we do not know why this switch powered down. If it happens again our options are:
1) power it directly from the UPS rack power strip (i.e. not from the Geist) and give it plenty of time to show it is powering up
2) replace it with a spare switch
We also do not know why h1sush12 and h1asc0 had DAQ errors when the power was restored. Of all the corner systems, they did have recent hardware changes. They also had model changes, but so did h1lsc0.
FRS36424 ticket opened for this issue.
[Kar Meng, Sheila, Eric]
We spent some more time today getting HAM 7 squared away after the VOPO swap. This morning, we plugged in the new oven stage controller and tested out the new translation stage and cabling. Everything worked as expected. After we were done testing, Sheila moved the new controller to the SQZ cabinet for storage.
This afternoon we continued work with recovering alignment on the 1064 path in transmission of the VOPO. Yesterday, we managed to roughly align everything in the chamber except for the iris before ZM4. However, we ended up walking FC1 a bit to get the retroreflected beam from the filter cavity back through SFI1. Today we started to slowly step FC1 back to its original position recorded in (88602) while walking the two steering mirrors on the VIP between the VOPO output and SFI1 to compensate. We managed to get back to our original pitch position and about halfway back to our original yaw value while still keeping the beam roughly aligned through all aperatures up to the edge of the VIP. However, we found that the beam coming off the VIP was still not aligned properly through the Iris in front of ZM4. In fact, it had moved further in the -Y direction and is now clipping on the black glass beam dump for the FC1 wedge. We were a bit disappointed at this point to find that we weren't making progress recovering the original SQZ path alignment.
We then decided to turn on the FC 532 field to see if the 532 and 1064 FC paths were reasonably well co-aligned. We were hoping that the 532 field might provide us with an additional alignment reference since, in principle, it should still be properly co-aligned with the transmitted 1064 field from the old VOPO. However, we discovered that the FC green field was not well aligned to the iris we'd placed after ZM3. It was about a quarter inch too low on this iris. Also, along the beam path right after the VIP, the 1064 and 532 fields are off from one another in both the horizontal and vertical directions. Unfortunately, we did not think to double check the 532/1064 co-alignment carefully when we were setting up the irises using the transmitted seed beam from the old VOPO, so we're unsure of exactly what happened here. A few thoughts:
TITLE: 12/19 Day Shift: 1530-0030 UTC (0730-1630 PST), all times posted in UTC
STATE of H1: Planned Engineering
INCOMING OPERATOR: None
SHIFT SUMMARY: HAM7 work continued, JM TFs were taken, HAMs 3 & 4 and were locked, and a network switch went down around noon and took all the front ends with it. The PSL cameras were taken down for a measurement today and someone who knows how needs to bring them back up sometime.
LOG:
| Start Time | System | Name | Location | Lazer_Haz | Task | Time End |
|---|---|---|---|---|---|---|
| 15:57 | SAF | LASER | LVEA | YES | LVEA is LASER HAZARD (\u2310\u25a0_\u25a0) | 10:51 |
| 15:35 | EPO | Corey | Yarm | N | Take pictures | 16:31 |
| 15:25 | FAC | Randy | LVEA | Y | Craning | 15:43 |
| 15:25 | ISC | Sheila | LVEA | Y | Check on laptop | 15:30 |
| 15:49 | FAC | Nellie, Kim | LVEA | Y | Tech clean | 17:10 |
| 16:29 | EE | Fil | LVEA | Y | Start disconnecting IOT2L | 17:42 |
| 16:49 | ISC | TJ | LVEA | Y | Start moving IOT2L | 17:42 |
| 16:59 | FAC | Randy | LVEA | Y | Help TJ move table | 17:37 |
| 17:05 | PSL | Alicia, Jean-Rene | LVEA | Y | Turn off cameras near PSL enc | 18:02 |
| 17:47 | FAC | Richard | LVEA | Y | Walkthrough | 18:08 |
| 17:55 | FAC | Nellie, Kim | LVEA | Y | Tech clean | 18:29 |
| 18:22 | VAC | Travis | LVEA | Y | Turn down purge air for HAM1 for JM measurement | 18:25 |
| 18:33 | ISC | Masayuki | LVEA | Y | Drop off parts at HAM1 | 19:53 |
| 18:36 | SEI | Jim, Randy | LVEA | Y | Lock HAM3 HEPI, then remove PEM ST endcaps | 20:01 |
| 18:39 | SQZ | Sheila, Kar Meng, Daniel | LVEA | Y | HAM7 checks, OPO, Kar Meng out at 23:36 | 00:00 |
| 18:58 | OPS | Tony | LVEA | Y | Talk to jim about HAM1 shaking | 19:09 |
| 20:02 | CAL | Tony | PCAL lab | Y | PRep meas | 20:12 |
| 20:36 | VAC | Travis | LVEA | Y | Turn purge air back up | 20:39 |
| 21:26 | ISC | Masayuki | Optics lab | LOCAL | JAC ASSY work | 22:08 |
| 21:55 | ISC | Jennie | LVEA, Optics lab | Y | Look for, and gather JAC parts | 22:13 |
| 21:35 | FAC | Richard, plus crew | OSB roof | N | Look at the view | 21:56 |
| 22:15 | FIT | Matt, Anna, TJ, Masayuki, Gabriele, ... | Xarm, Yarm | N | Running | 23:51 |
| 22:57 | ISC | Jennie | LVEA HAM1 | Y | Put away JAC parts, cleanup for break | 00:20 |
| 23:25 | PEM | Robert | LVEA | Y | HAM7 | 23:43 |
| 23:40 | OPS | Tony | LVEA | Y | Help Jennie at HAM1 | 00:20 |
| 00:05 | ISC | Masayuki | LVEA | Y | Help Jennie | 00:20 |
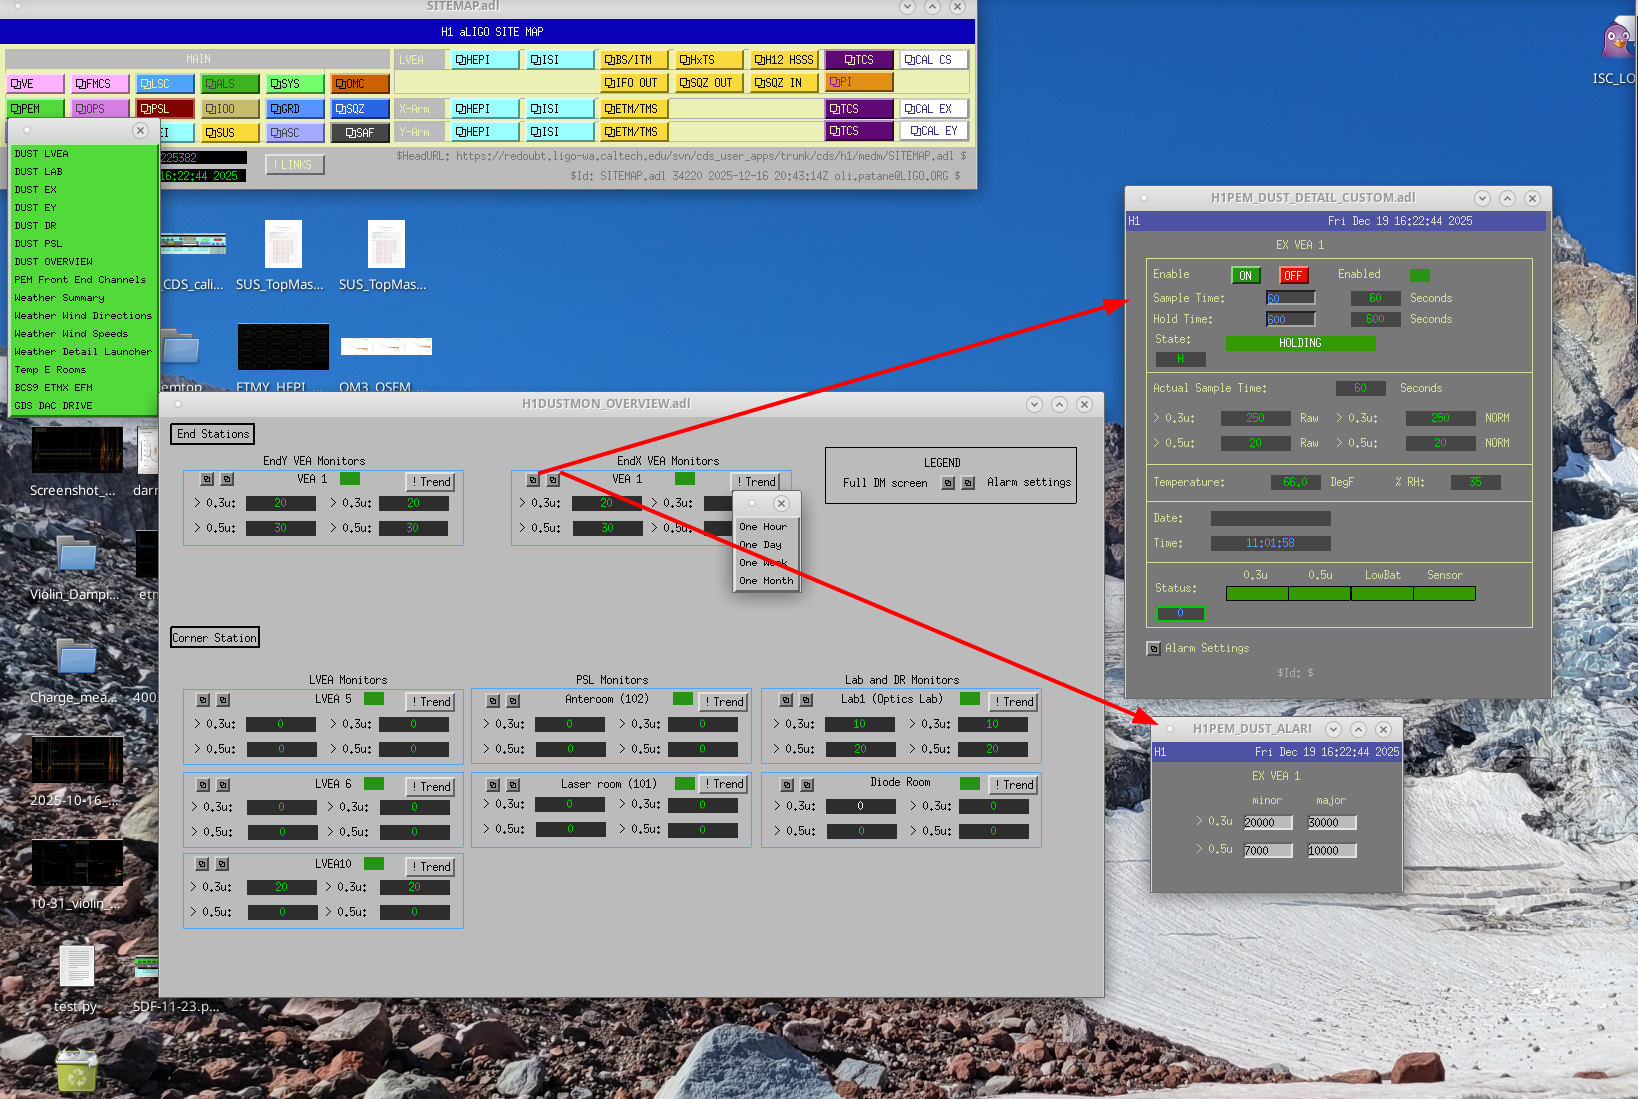
I made a new medm screen for the dust monitors so there's a single screen where you can see all of the particle counts for the site, and you can get to all useful dust monitor screens through this screen. I also added some shell command buttons to launch scopes of the individual DMs. Its located under PEM on SITEMAP.
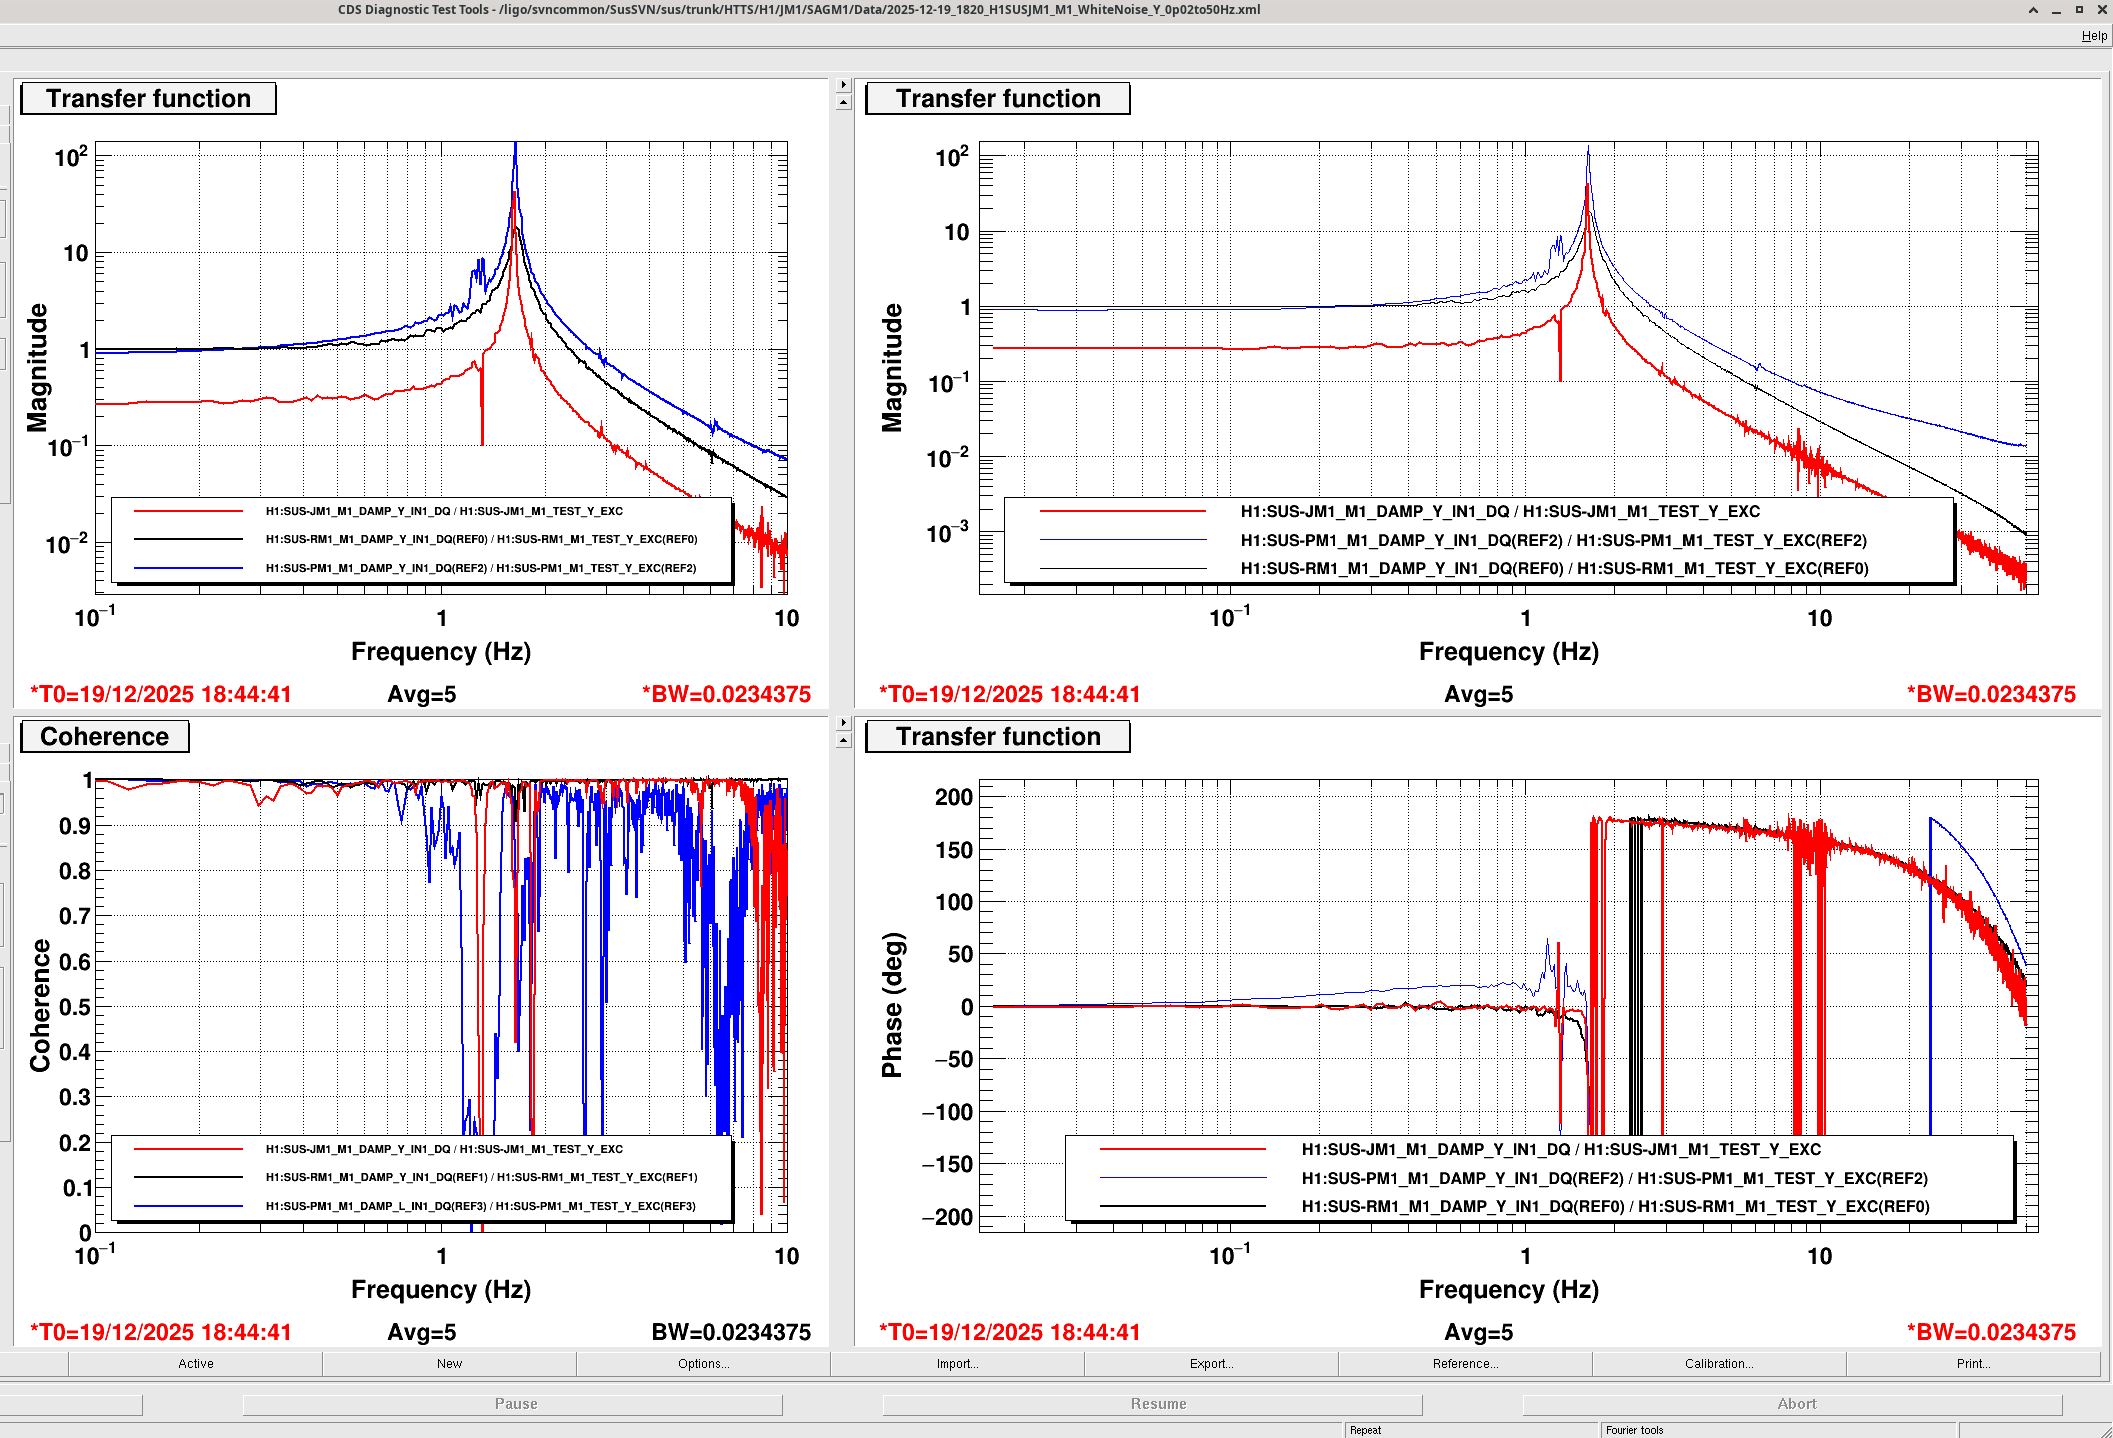
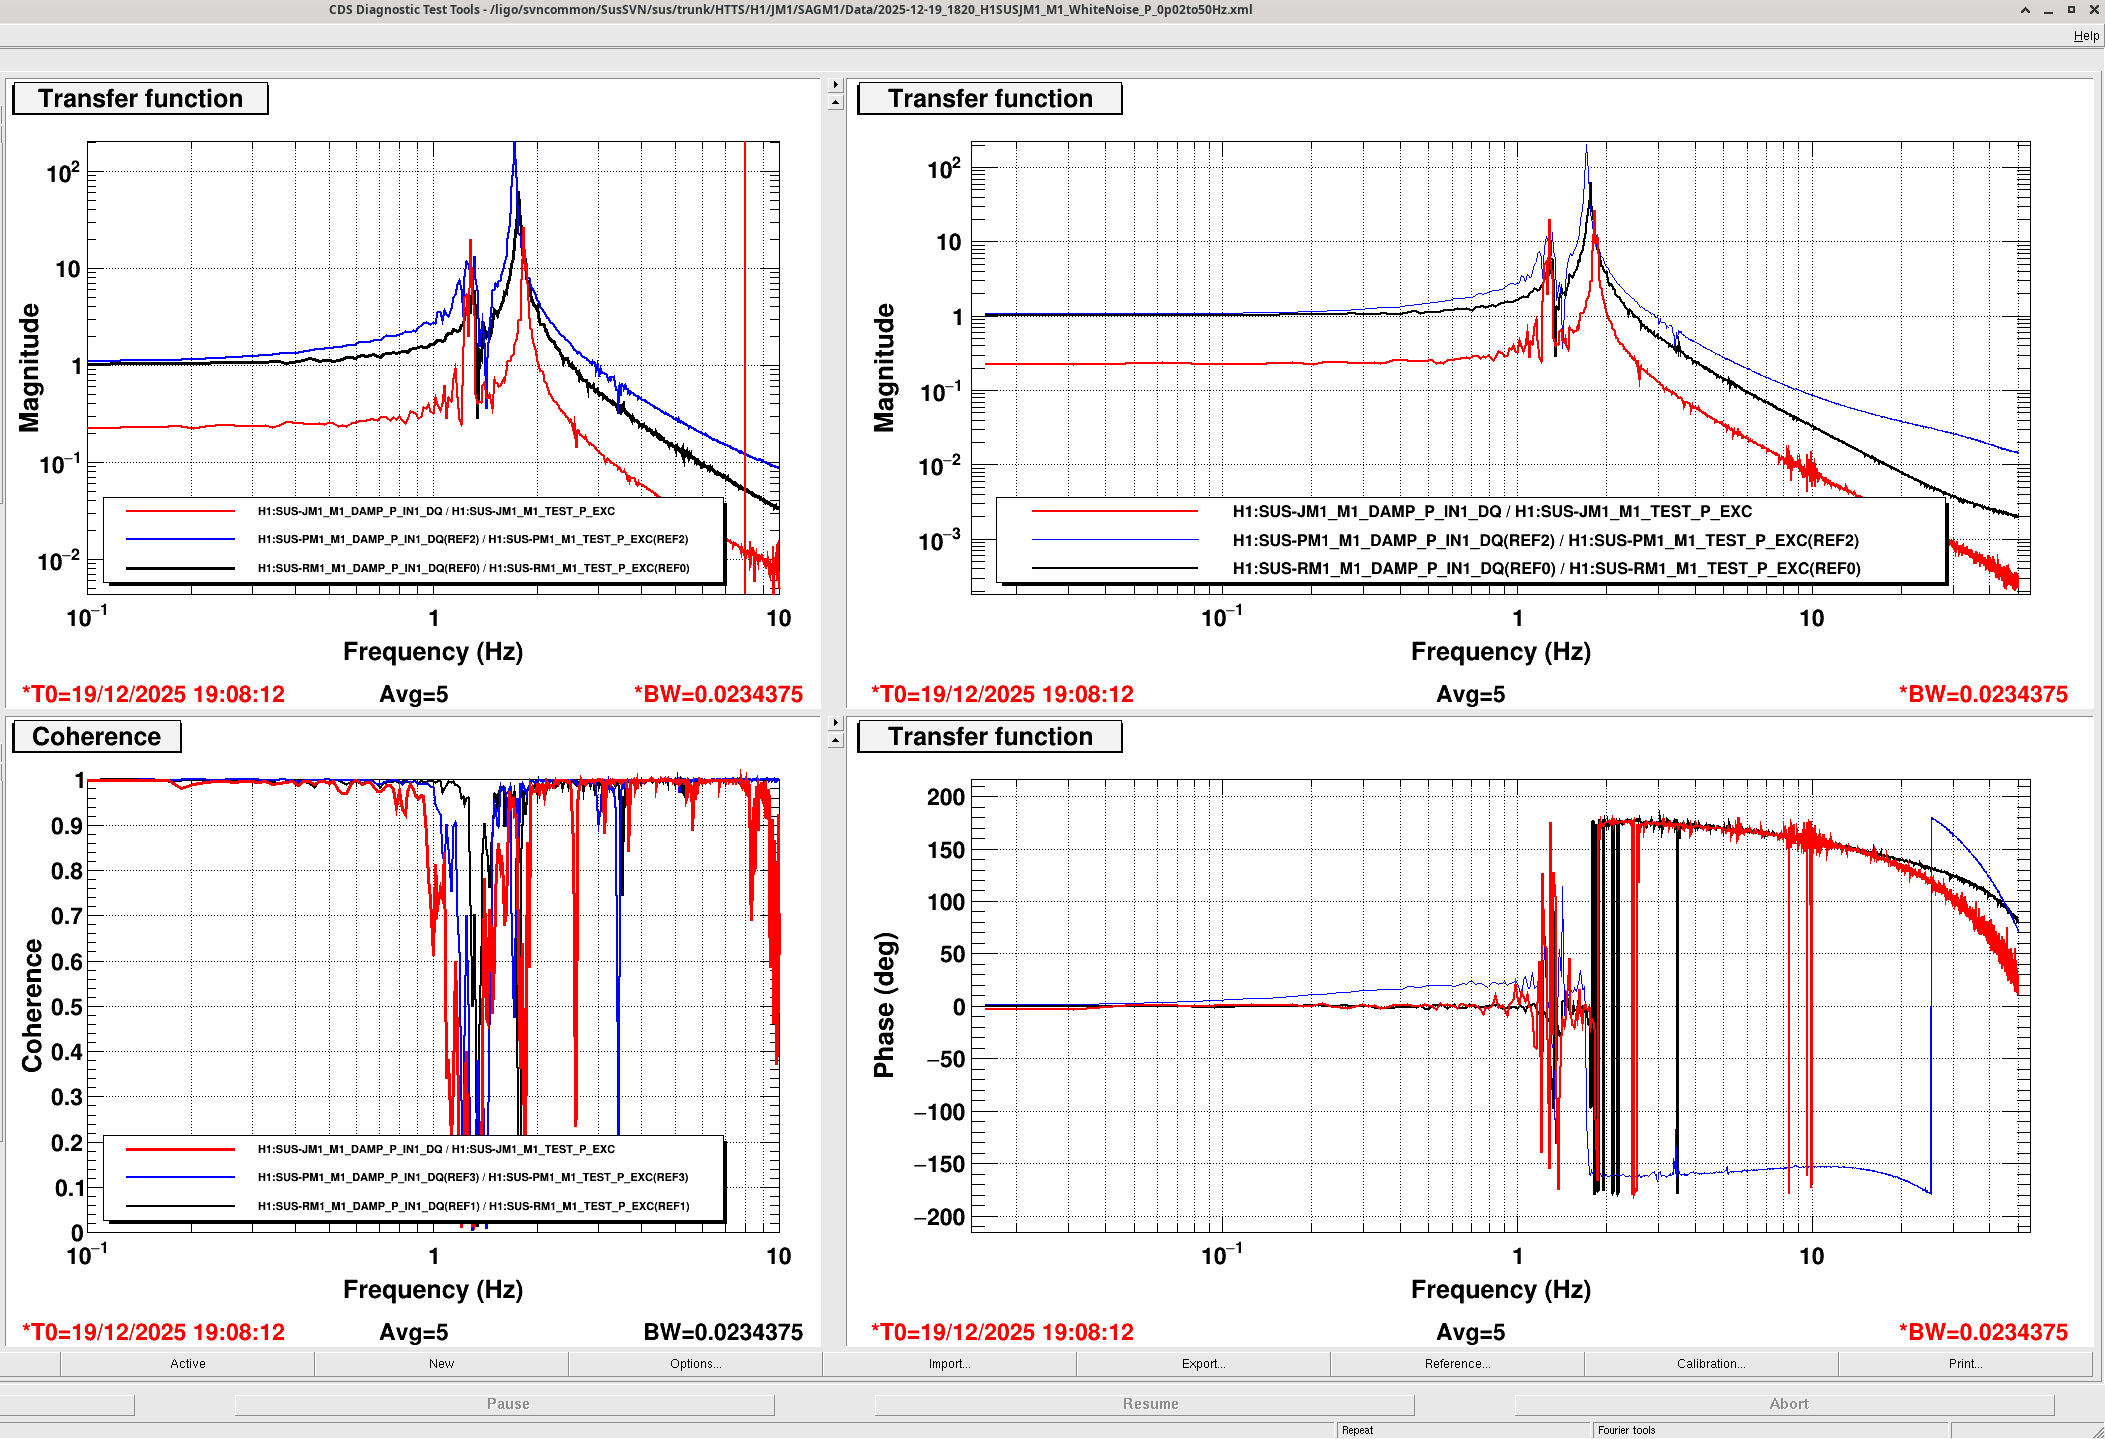
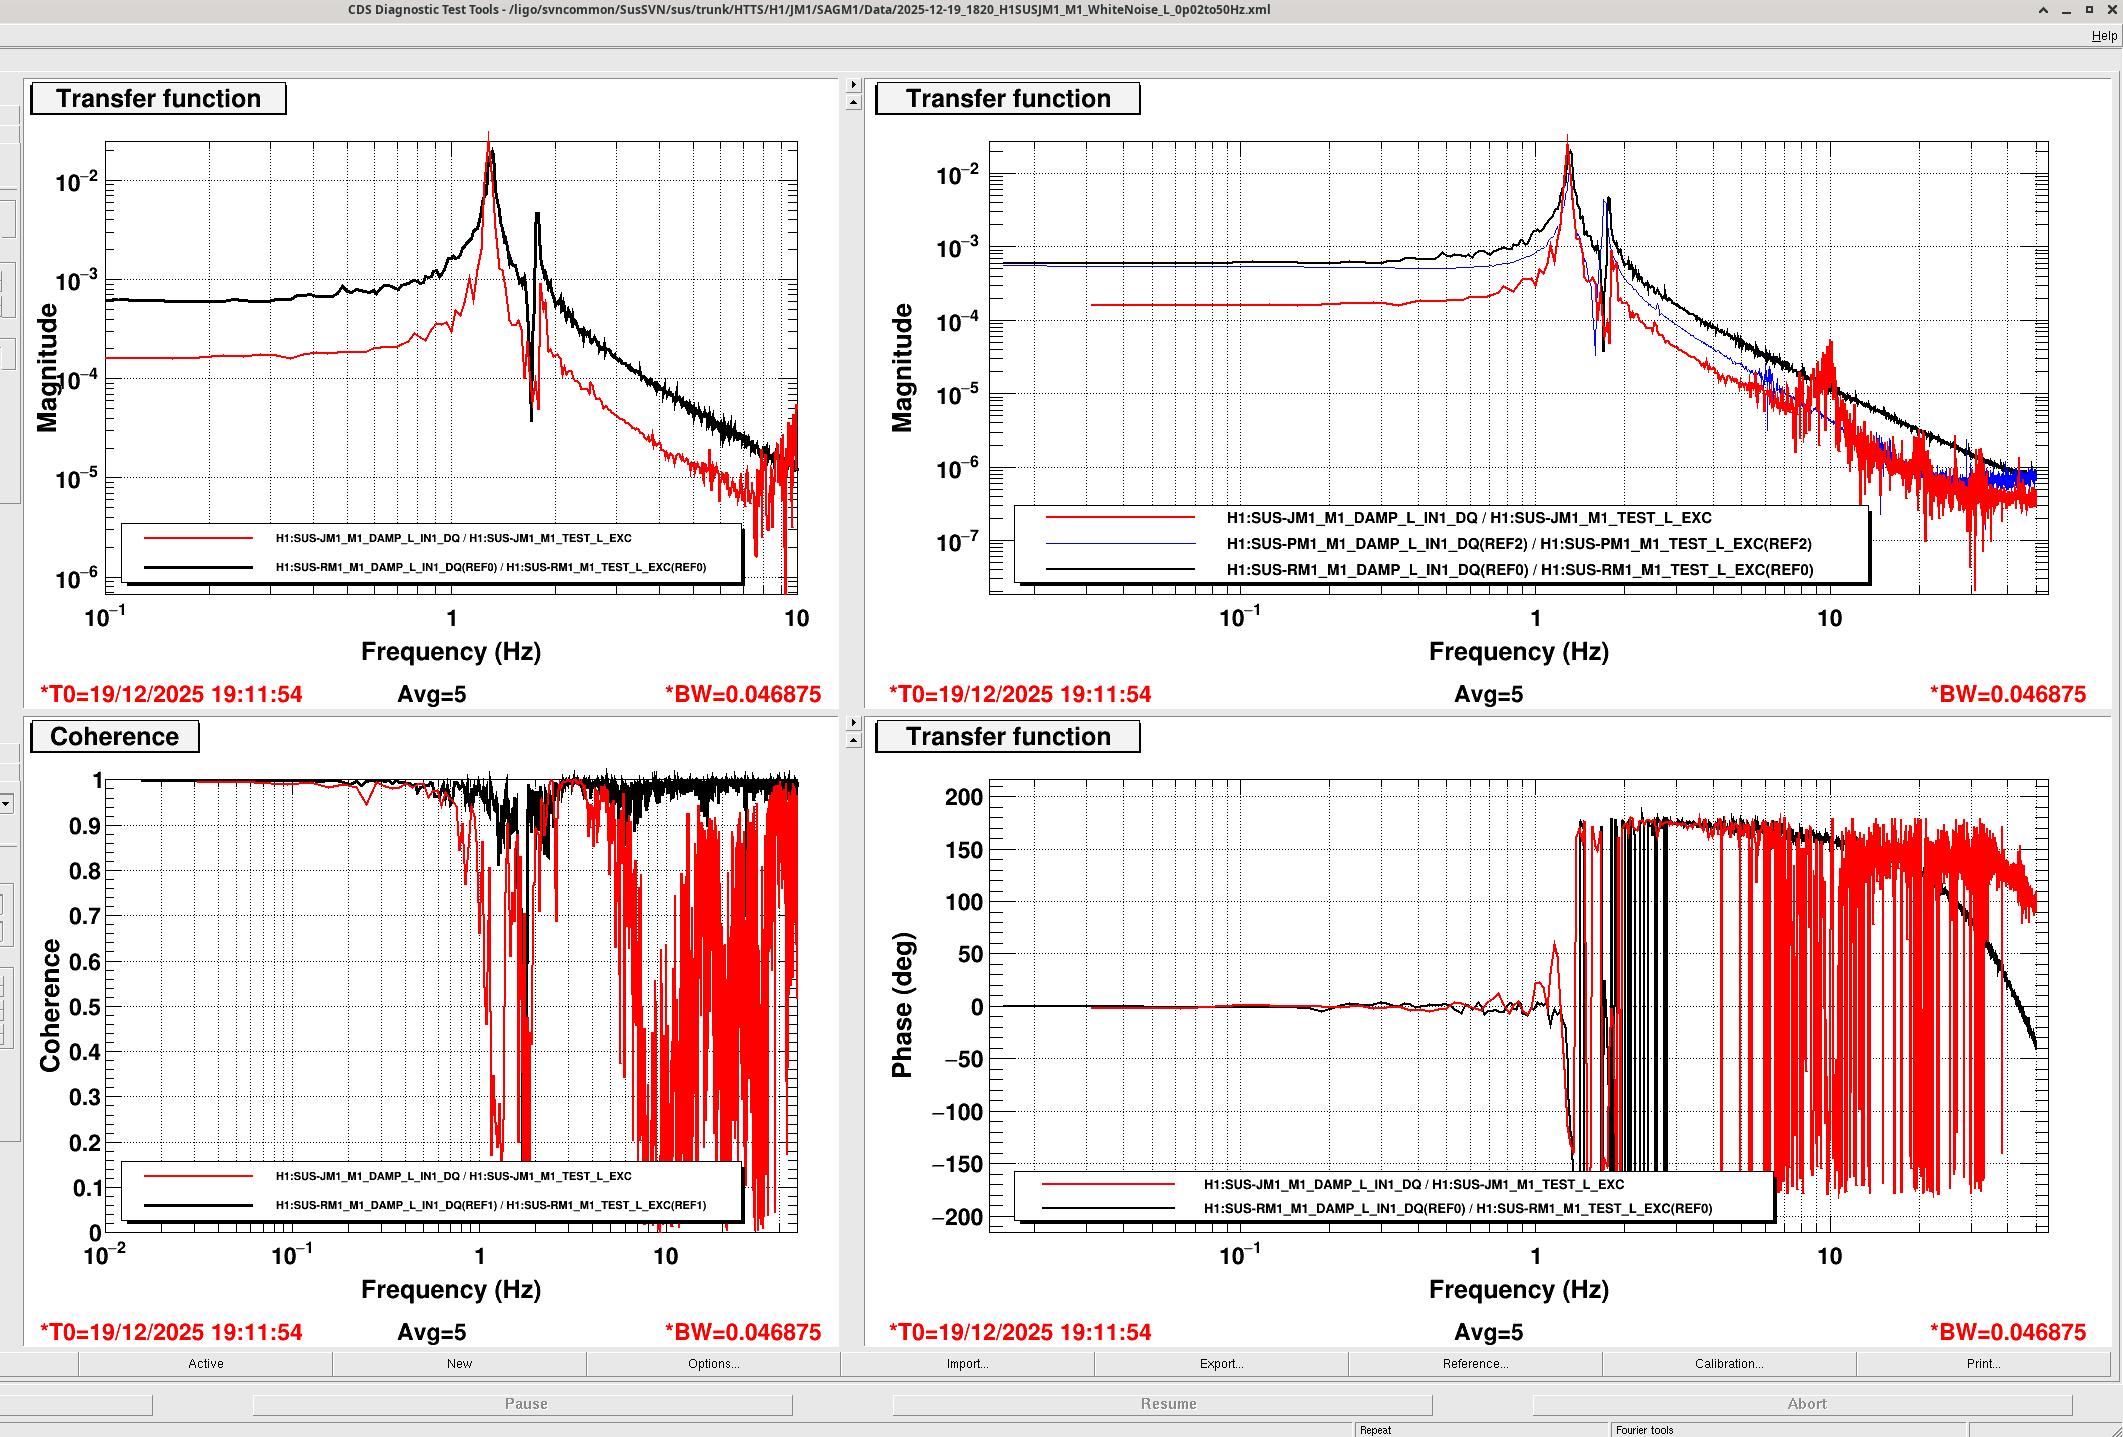
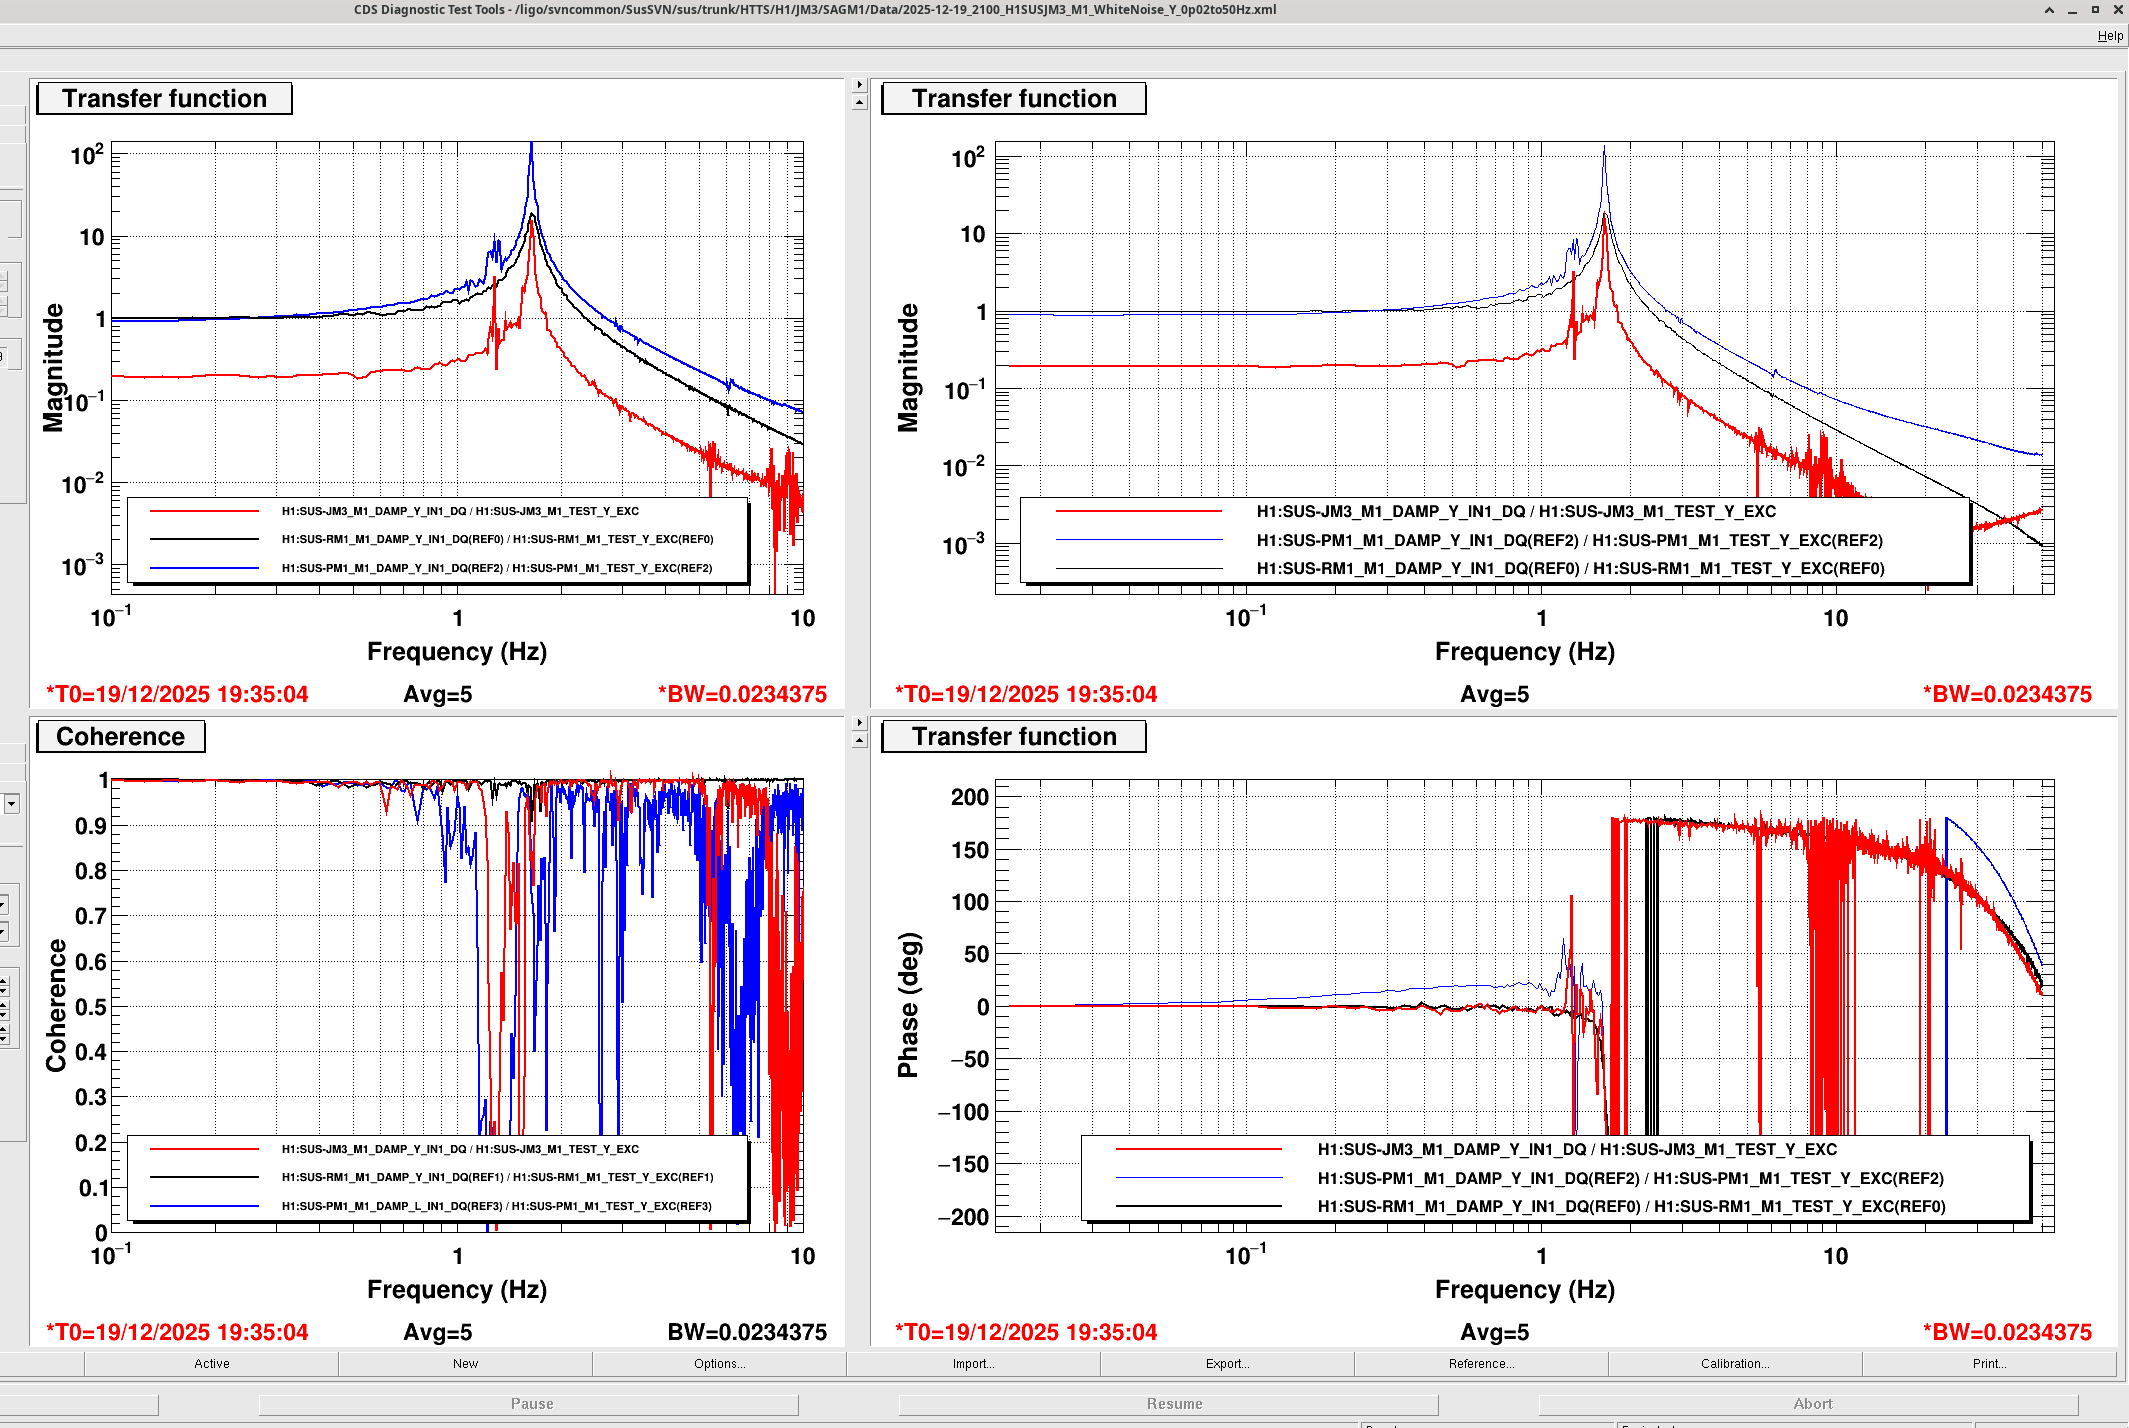
This morning, I started taking transfer function measurements on the two new Tip Tilt suspensions (JM1 and JM3 for JAC) recently installed in HAM1 chamber. The screenshots are attached below - the chamber has a strong purge air flowing which created a noisy environment and I had to drive the suspensions really hard get a decent coherence. Travis dialed the purge air down, which helped (however, there were other ongoing LVEA work which were kind of saturating the DAC).
This is first of the many measurements to be taken (including osem spectra etc.), however JM1 looks great - ignore the magnitude for now and we will sort it out in the new year. The resonance peaks are where they should be - especially for JM1, just like how I tested it in the triples lab.
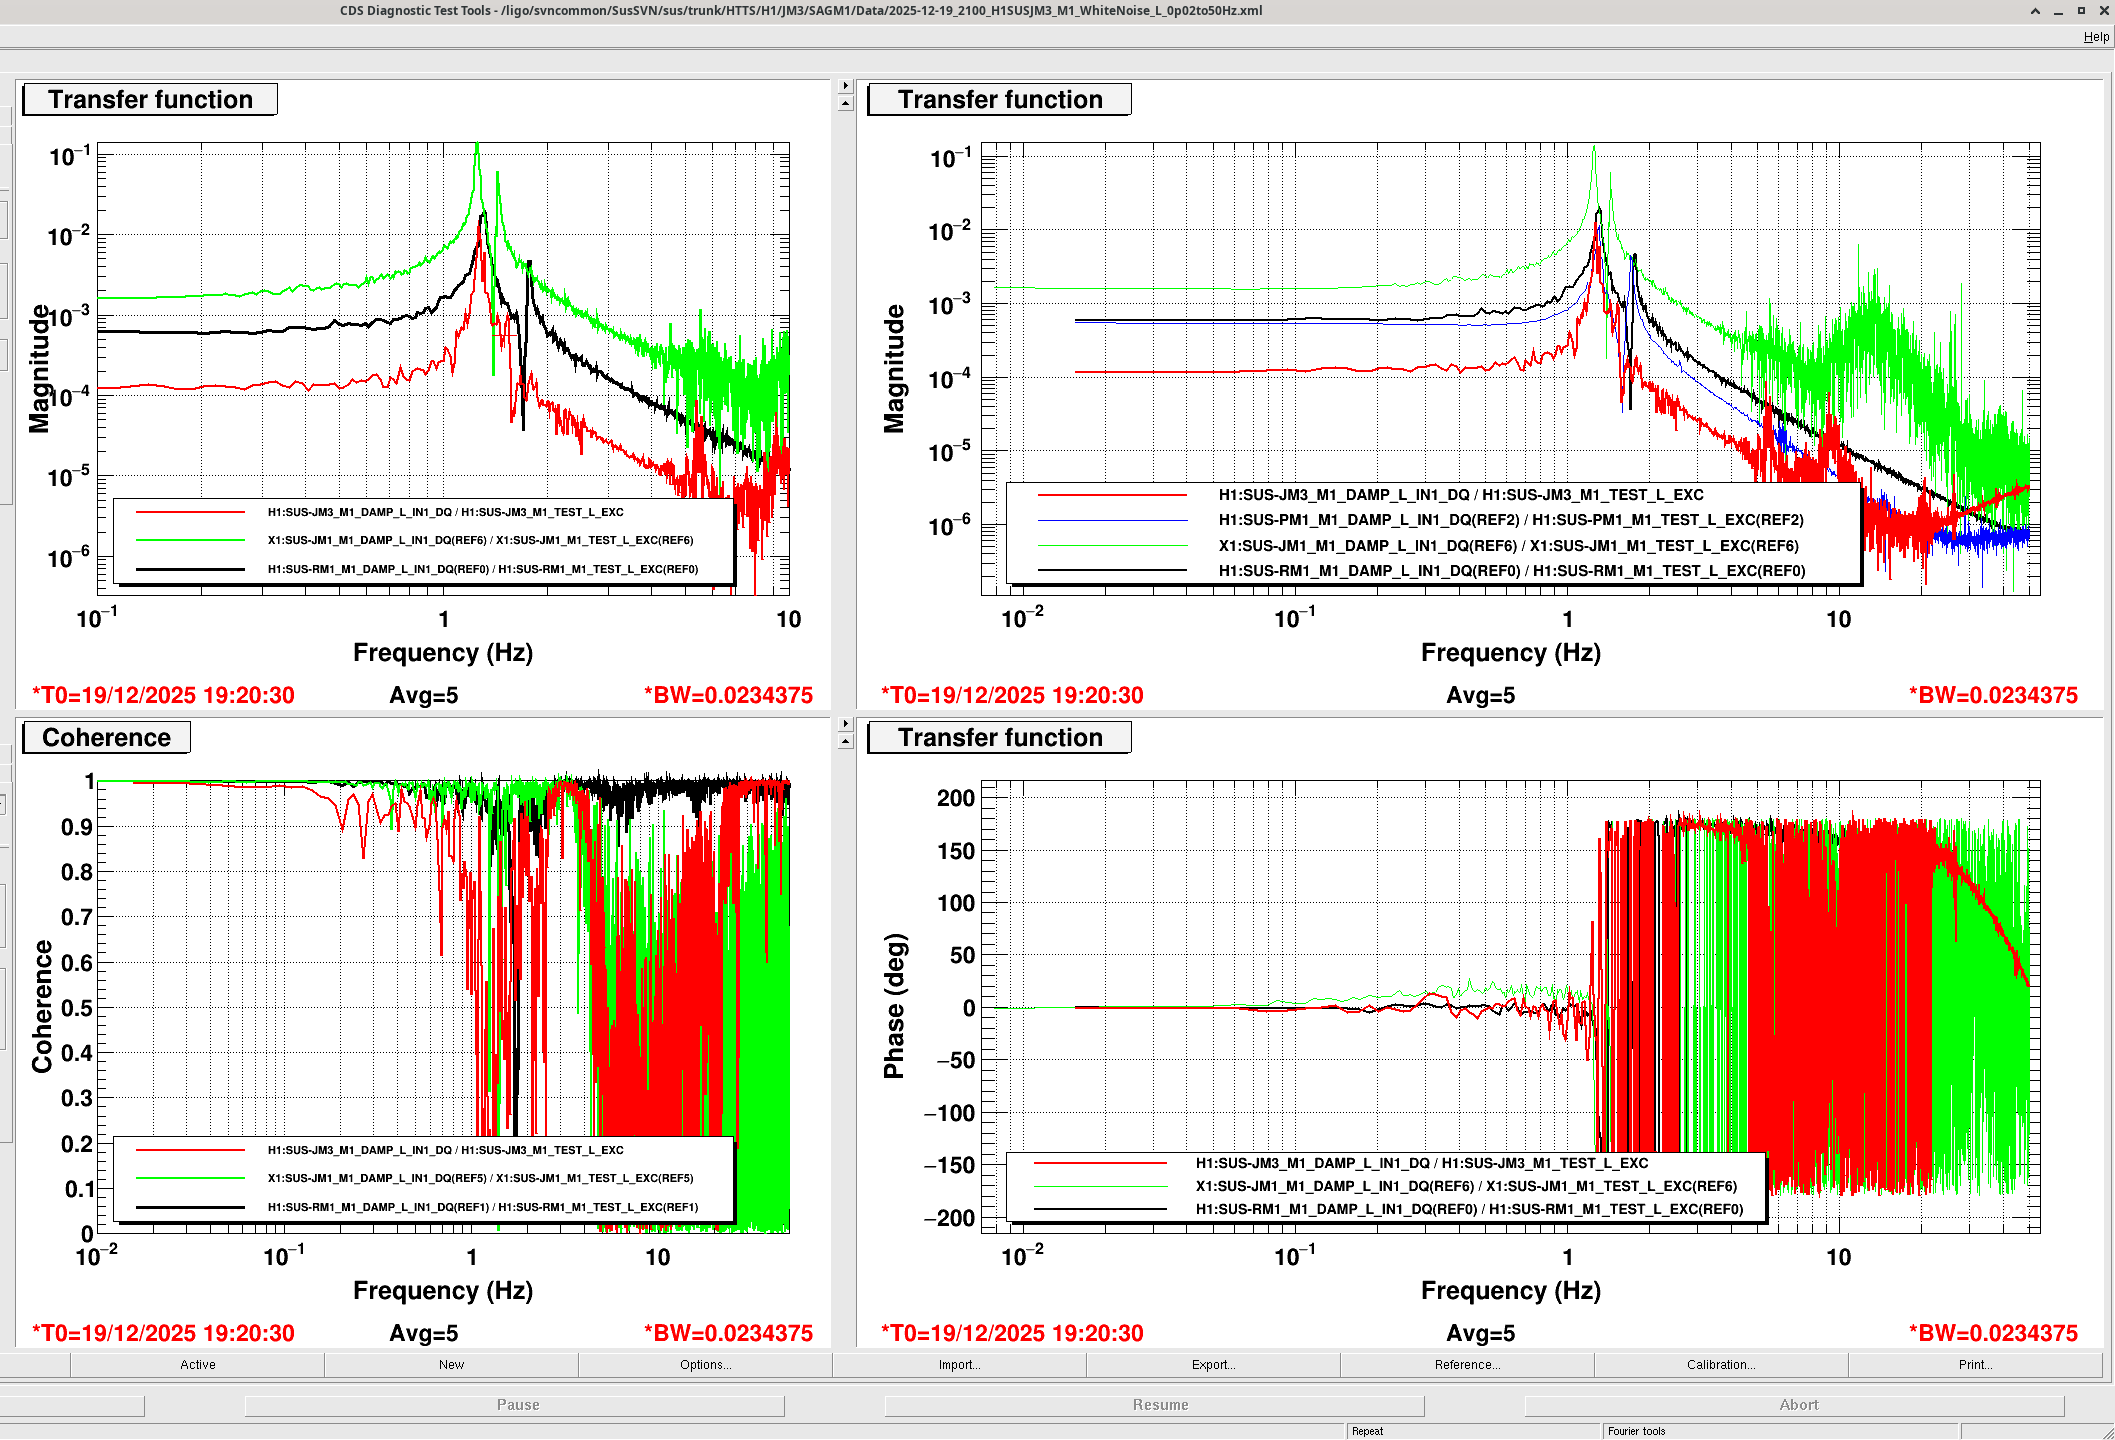
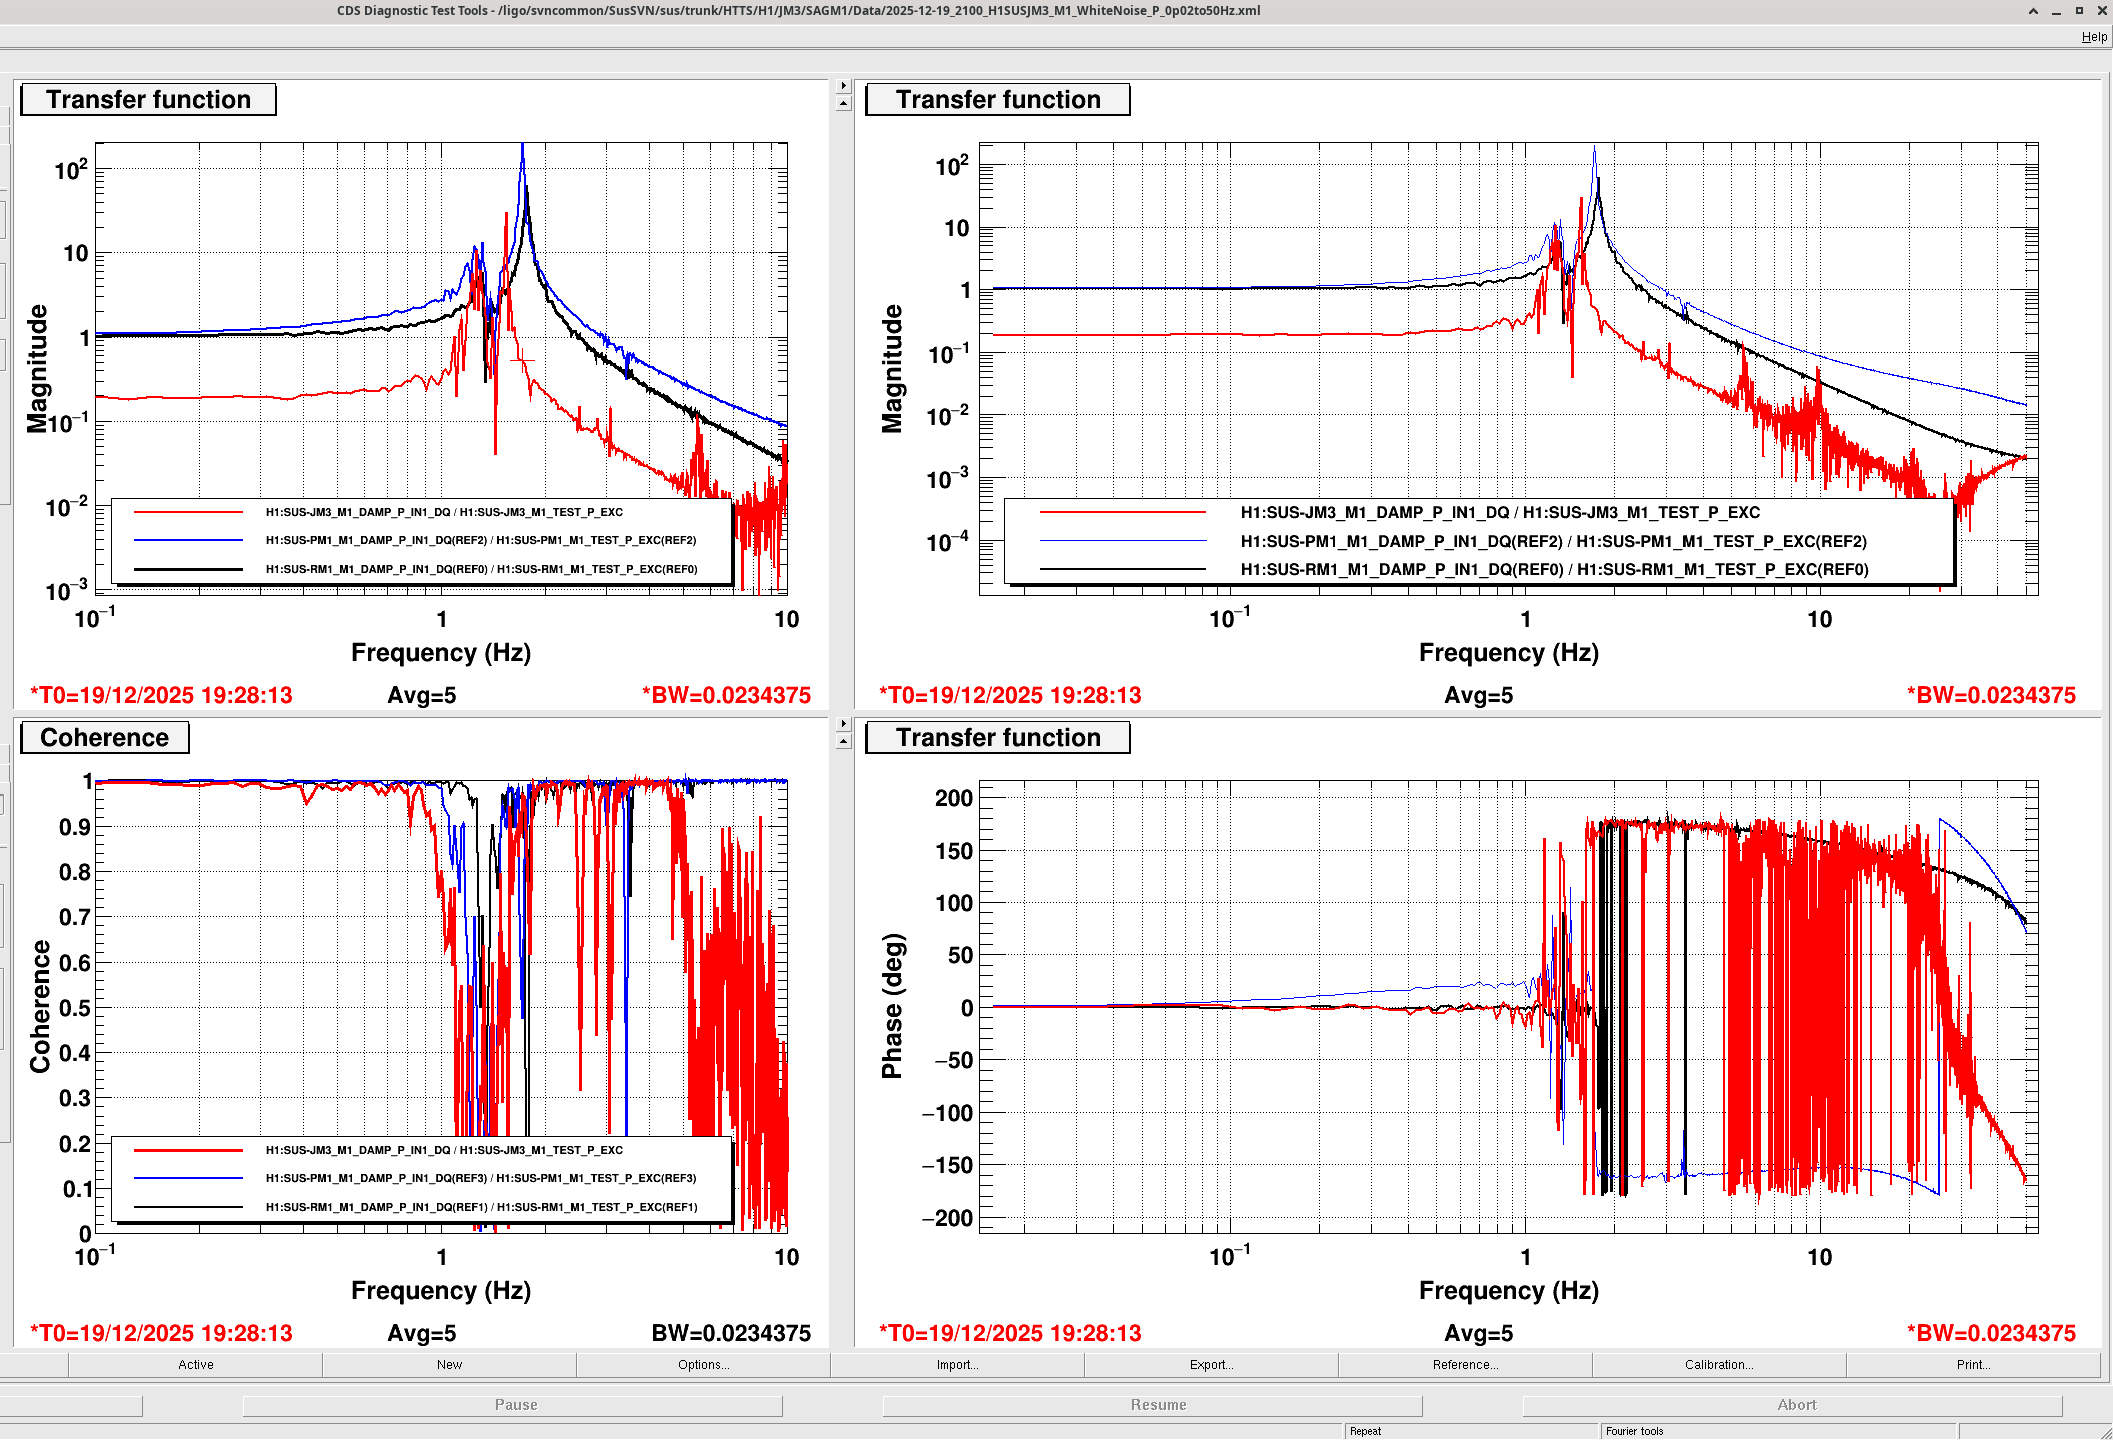
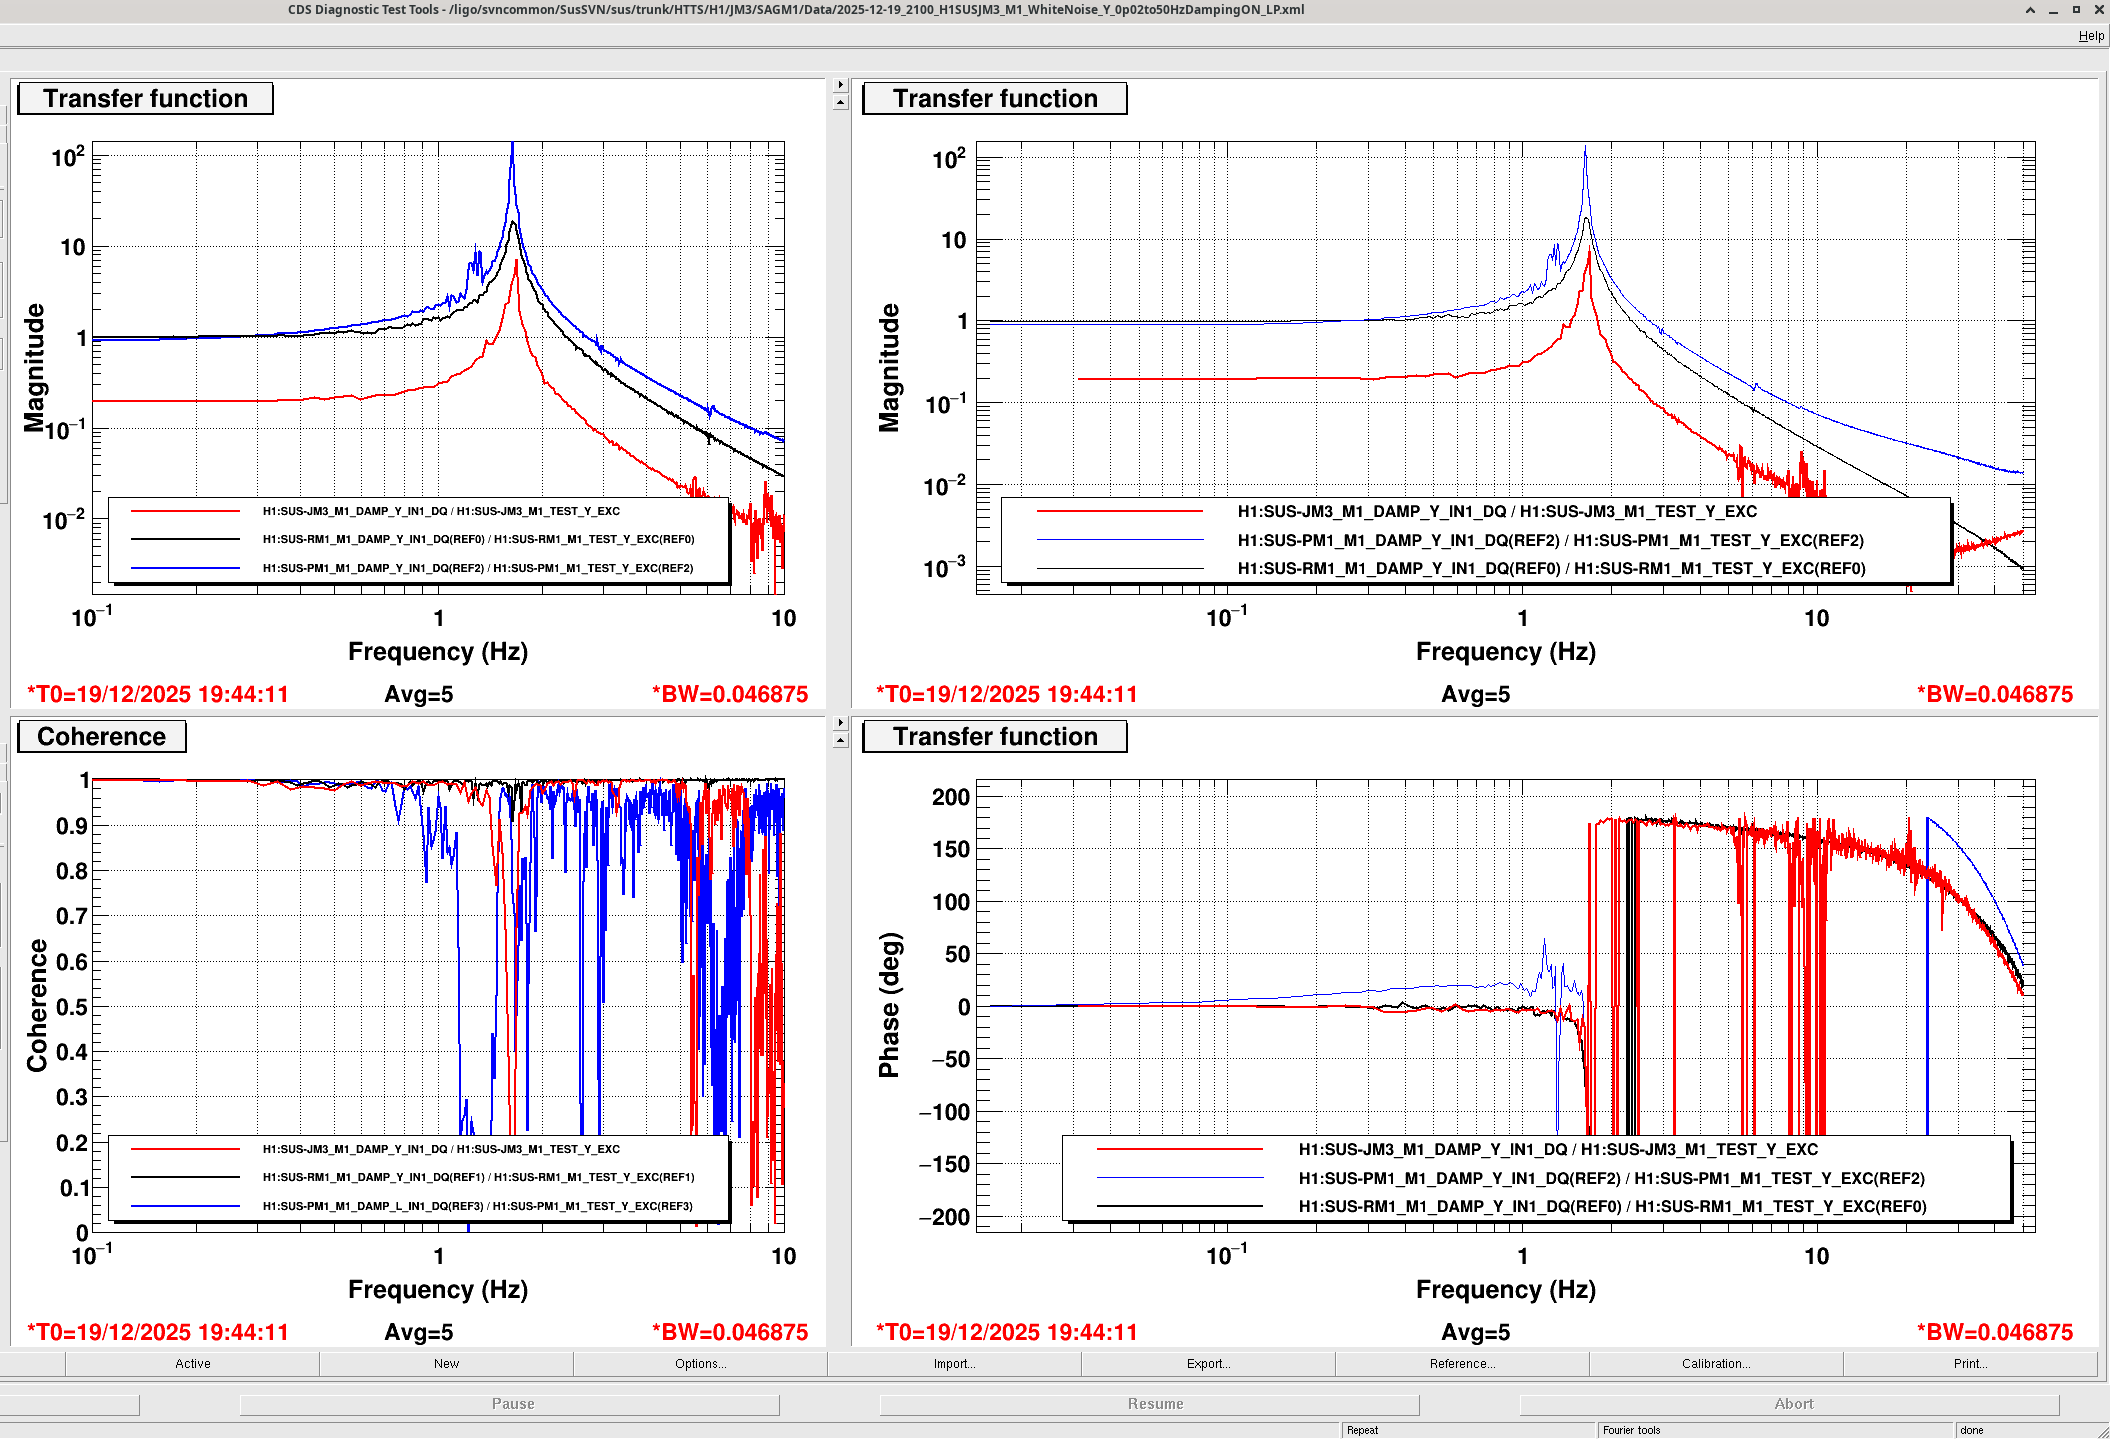
Similarly, JM3 is also behaving like how it was in the lab (RyanC took that measurement in the triples lab) - couple of peaks on L and P dof are off by 0.15 Hz (due to longer wires, not much control here). Y dof has cross coupling from L dof at 1.25Hz, but if you look at this damped TF (when L and P damping were kept on) plot - the cross coupling is gone.
More tests are in the pipeline and better results are expected, however this is a decent start.
The templates are stored at the following locations,
JM1
/ligo/svncommon/SusSVN/sus/trunk/HTTS/H1/JM1/SAGM1/Data/
2025-12-19_1820_H1SUSJM1_M1_WhiteNoise_L_0p02to50Hz.xml
2025-12-19_1820_H1SUSJM1_M1_WhiteNoise_P_0p02to50Hz.xml
2025-12-19_1820_H1SUSJM1_M1_WhiteNoise_Y_0p02to50Hz.xml
JM3
/ligo/svncommon/SusSVN/sus/trunk/HTTS/H1/JM3/SAGM1/Data/
2025-12-19_2100_H1SUSJM3_M1_WhiteNoise_L_0p02to50Hz.xml
2025-12-19_2100_H1SUSJM3_M1_WhiteNoise_P_0p02to50Hz.xml
2025-12-19_2100_H1SUSJM3_M1_WhiteNoise_Y_0p02to50Hz.xml
2025-12-19_2100_H1SUSJM3_M1_WhiteNoise_Y_0p02to50HzDampingON_LP.xml - L and P dof damping ON during the measurement.
Purge air in HAM1 was set to its nominal flow once the measurements were complete.
R. Crouch, J. Oberling
Yesterday we began measuring the locations of the vacuum chamber support tube ends using the FARO laser tracker. We started with the support tubes for the WBSC3 chamber and the +X ends of the WBSC2 support tubes as these were the most readily accesible. The remaining support tubes in the LVEA (WBSC1, WBSC2 -X ends, and all WHAM chambers except WHAM7) have iLIGO-era PEM Interface Plates on them that block the support tube; some of these plates have undocumented spacers between them and the support tubes they are attached to, meaning we cannot accurately locate the support tube end w.r.t. the PEM interface plate and therefore making an accurate measurement of the support tube location impossible. As an aside, Jim is in the process of removing these plates from the chambers (so far WHAM3 and WHAM4 are complete, WHAM1 and WHAM2 are 75% complete), so we can get at these support tube ends as the opportunity arises (he will then reinstall these plates, as they make for very convient mounts for dial indicators).
Measurement Method
This is a fairly straightforward measurement, but there is a somewhat subtle "gotcha" that needs to be accounted for to get an accurate measurement. But first things first, we aligned the FARO to the LVEA's Building Coordinate system using our red alignment nests, then applied the X and Y axis rotations required to align the FARO to the site global coordinate system (see T0900340 for a brief overview of the coordinate systems in use). We then loaded CAD models of the support tubes, that Ryan downloaded from the SolidWorks vault with each model in the site global coordinate system, into the FARO's control software, PolyWorks. PolyWorks automatically reads the coordinate system information contained in the CAD files and places these models in position w.r.t. to the site global coordinate system. This gives us nominal locations of the support tube ends, a guide for our measurements, and also a nice visual reference for where everything is positioned.
Now for the "gotcha." The physical support tubes have a hole in the center of each end that is not represented in the CAD model, and this hole is large enough that the FARO target (a Spherically Mounted Retroreflector, or SMR, with a 1.5" diameter) sits slightly inside the hole. This means that when you're taking a measurement of the center of the support tube end using this hole the SMR is not measuring the location of the actual support tube end, it is a few mm inside of it. To account for this we did the following:
To take the measurement we used the Build/Inspect mode in PolyWorks. In this mode we have to be sure to select the "Towards Object" compensation method, which automatically compensates for the radius of the SMR (3/4", or 19.05 mm). If "None" is selected the FARO measures to the center of the SMR, but our measurement point is at the edge of the SMR, since that's what is physically touching the support tube, so we need to compensate for that radius. This gives us the deviations of the measurement point, which can then applied to the point representing the center of each support tube end to give their measured location. The results of our measurements are shown in the attachment. Since we had measurements for each end of the WBSC3 support tubes I also added a distance feature representing the measured length of each WBSC3 support tube.
Wrapping Up
Some points for discussion/further thought. Keep in mind that the BSC support tubes are not exact representations of where their respective optics are; we only aligned the optic during aLIGO install, and in the end didn't really care where the support tubes ended up as long as HEPI had enough range to work. This means that any deviation from nominal seen in the support tube ends is not an indication of misalignment of that chamber's optic.
This work was associated with LHO WP 12947, which also included the WBSC1 +X support tube ends. Those support tubes still have PEM interface plates installed, so we are currently unable to measure them (will do in the future once the plates are removed). Since we completed the rest of the measurements involved, I've closed the WP.

I've attached the same centerline picture of the WBSC3 support tubes as I used for the WBSC2 support tubes in alog 89619 (2nd attachment in that alog). This shows that the support tubes are shifted in the +Y direction, with the +X support tube shifted 1.381mm further +Y than the -X support tube is. This again implies a yaw in addition to the +Y shift. As I did for WBSC2, averaging out the shift gives a +Y shift of ~1.7mm and a CCW yaw of ~824 µrad.
Again, this is not indicative of any misaligment in ITMx, as we moved HEPI to place the optic where it needed to be, and the support tube ends ended up where they ended up.

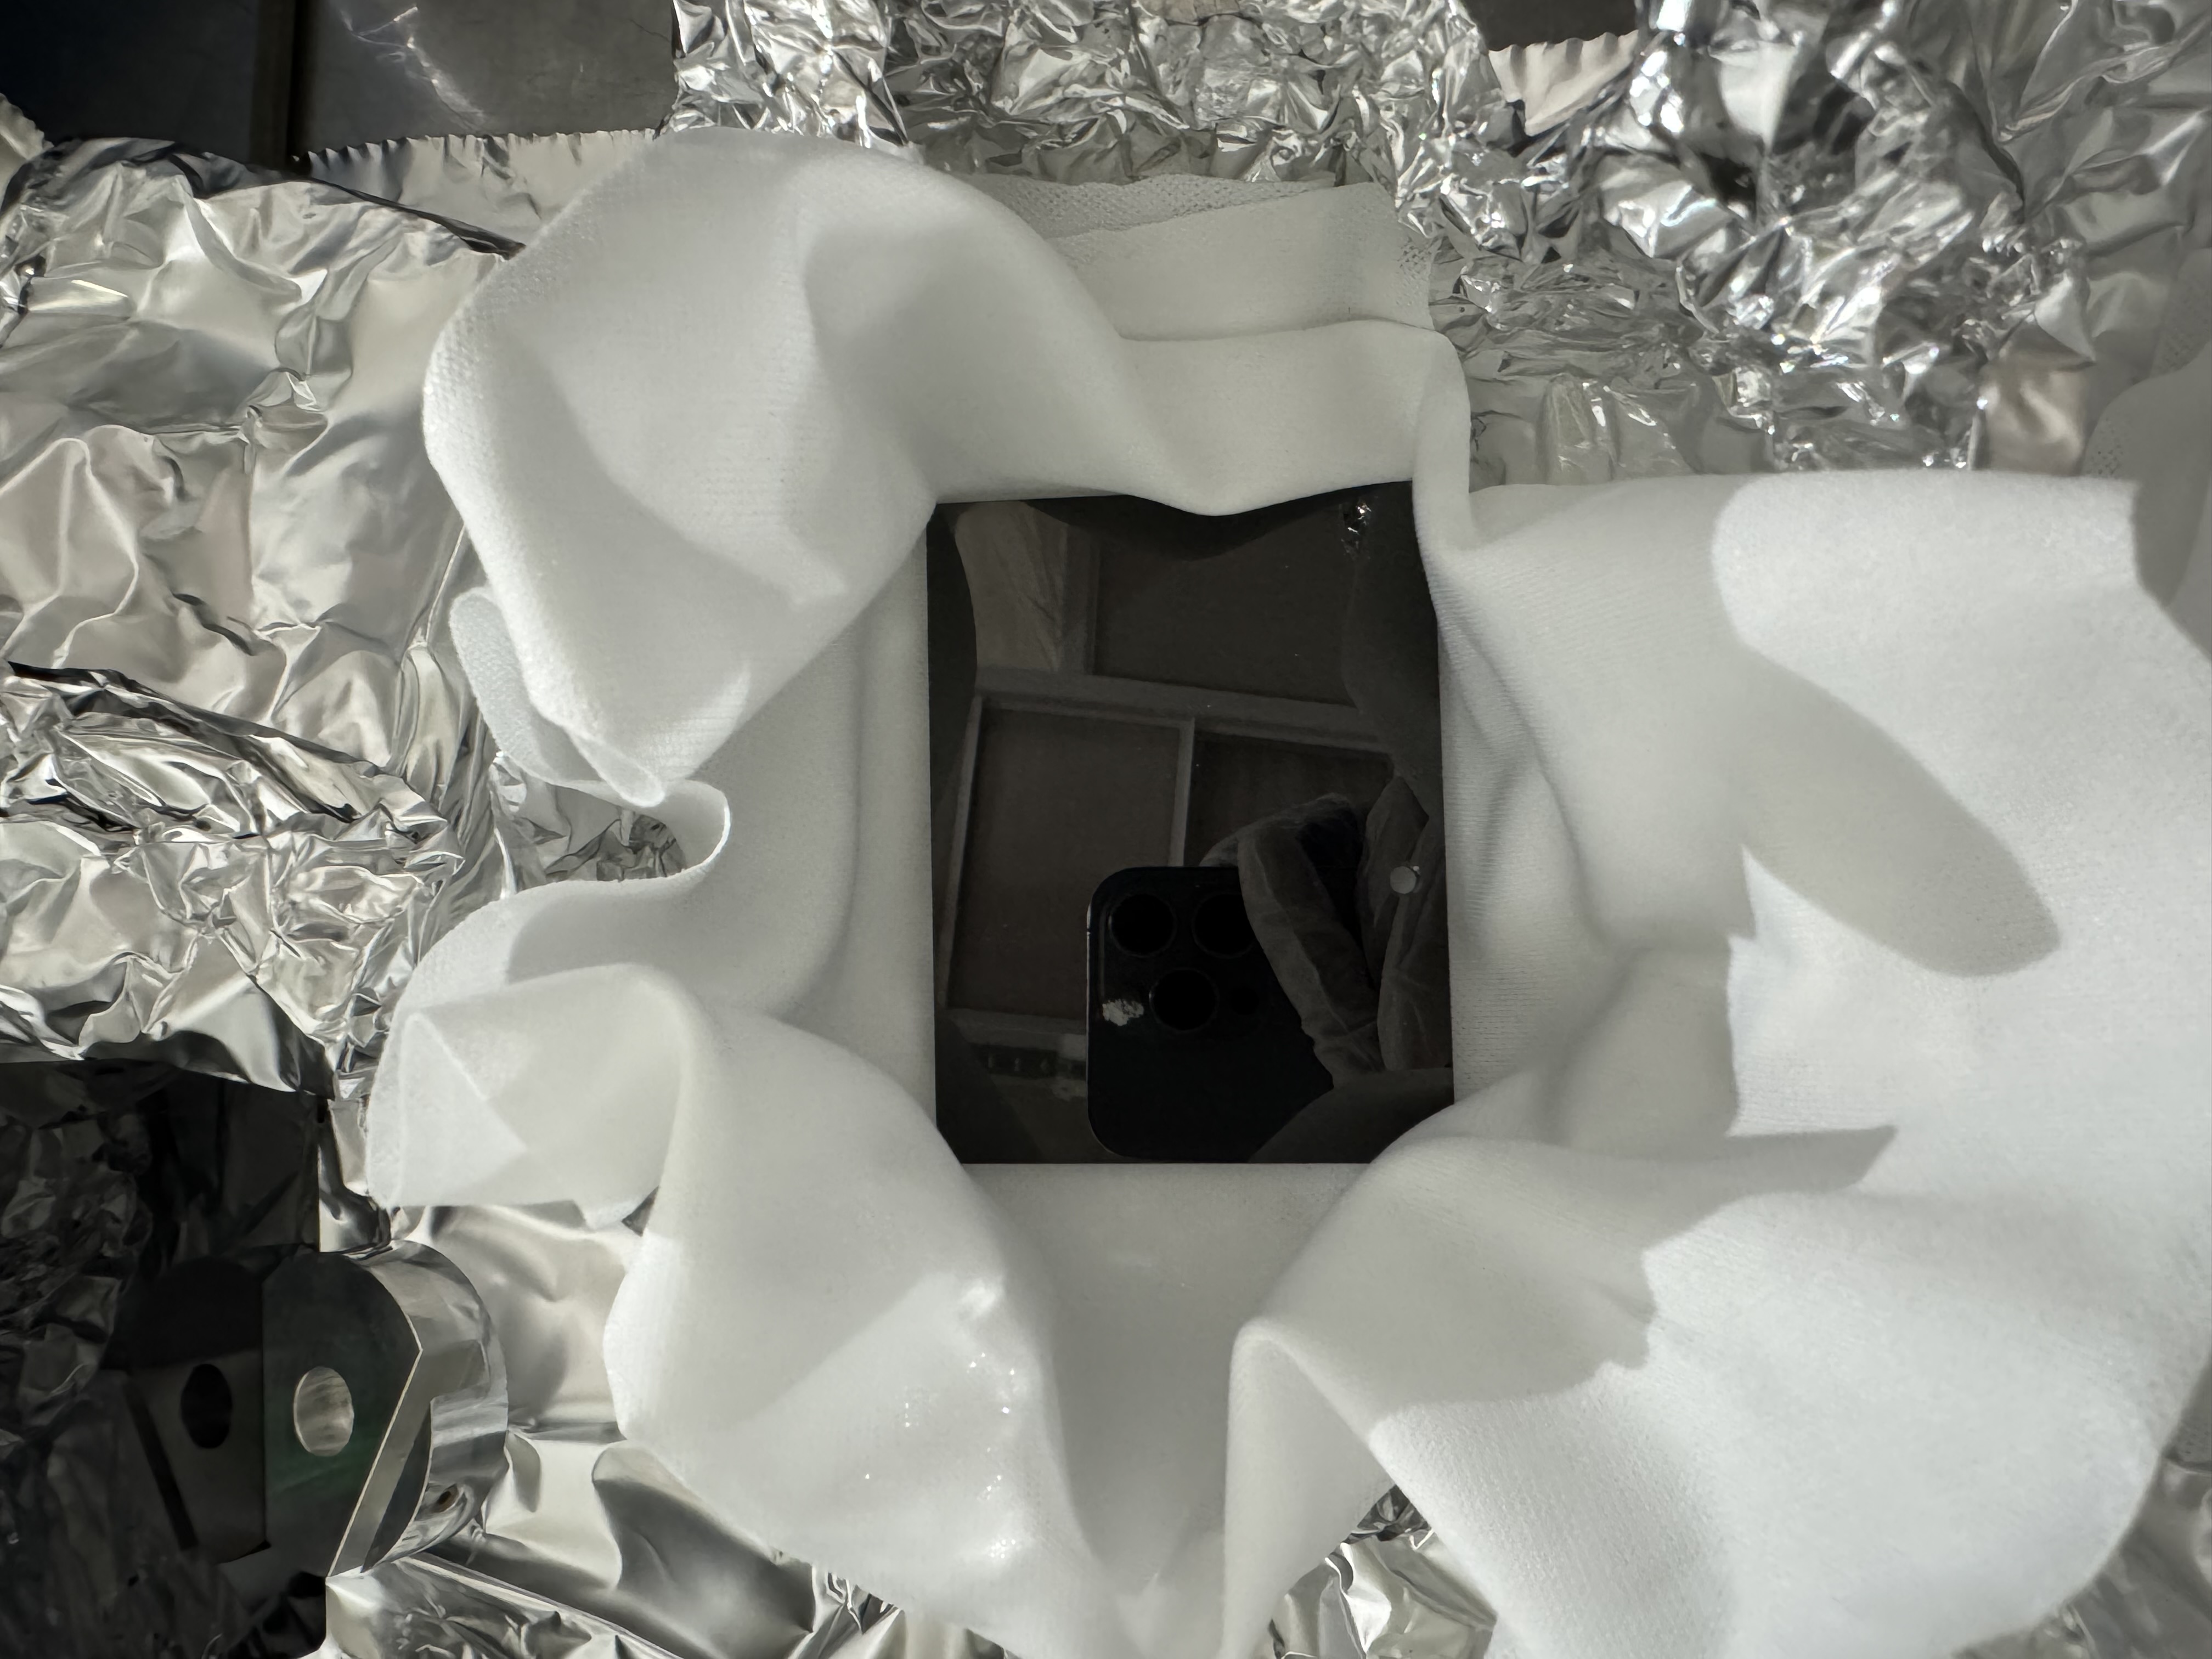
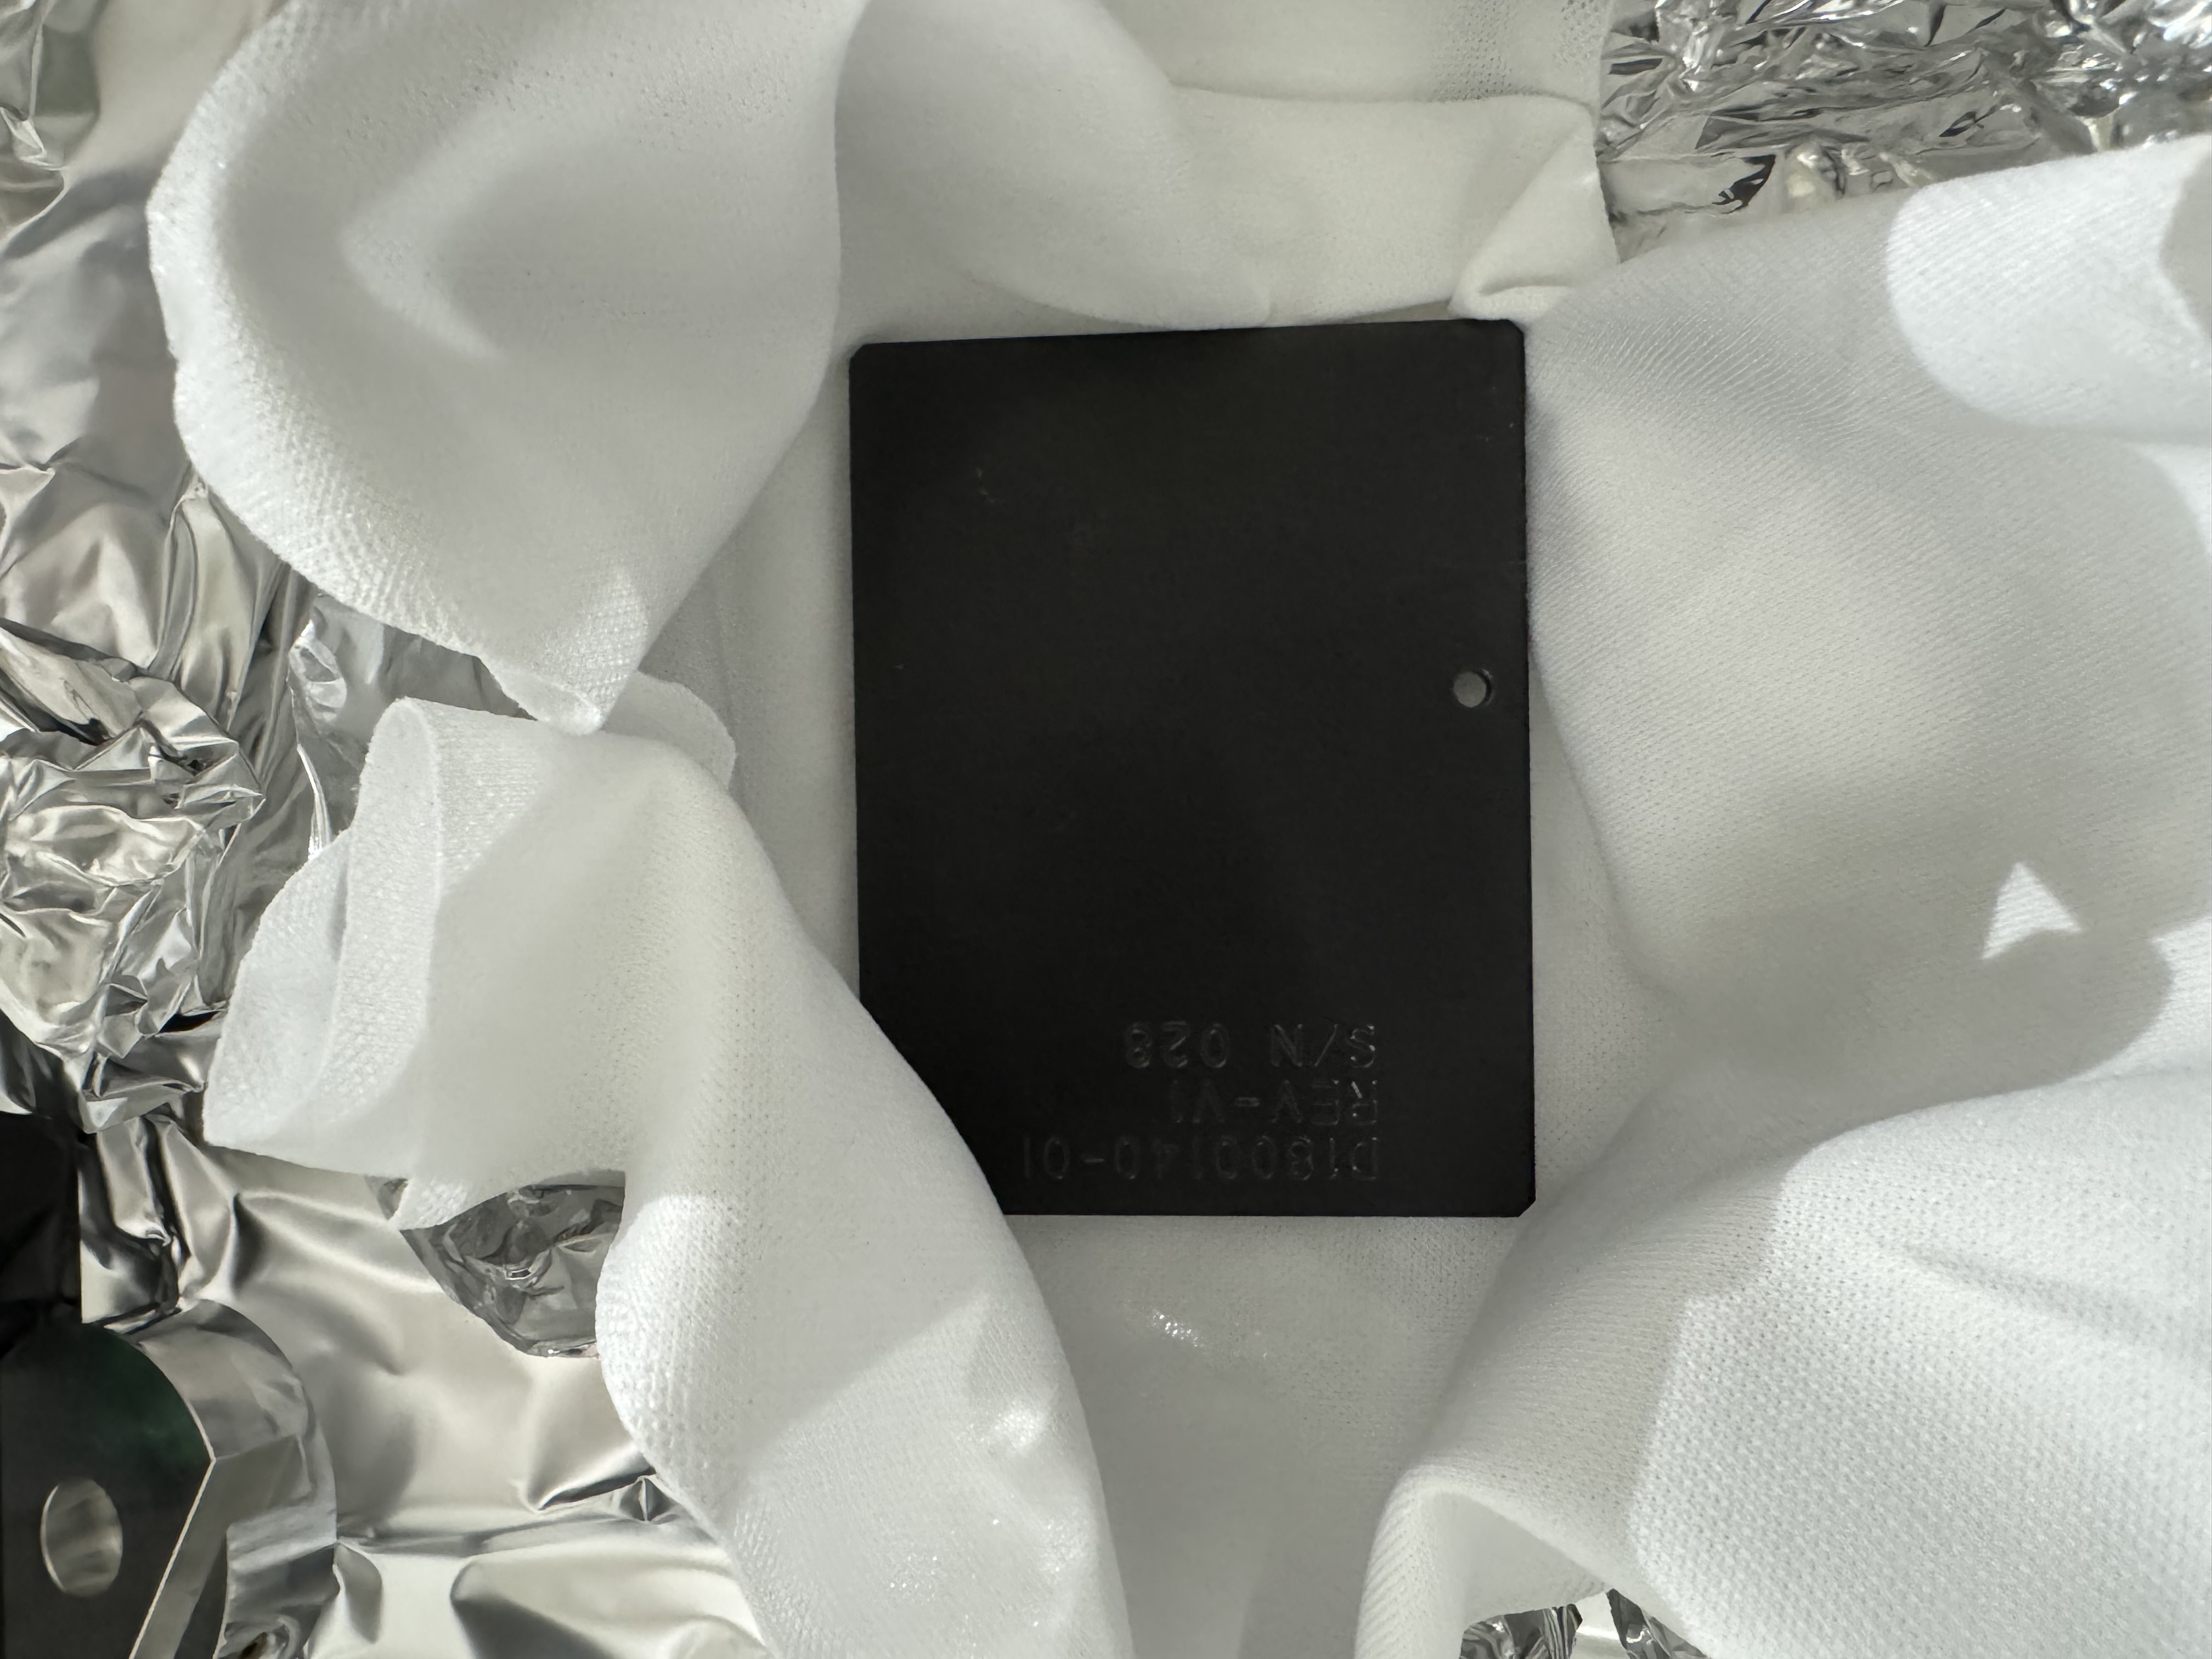
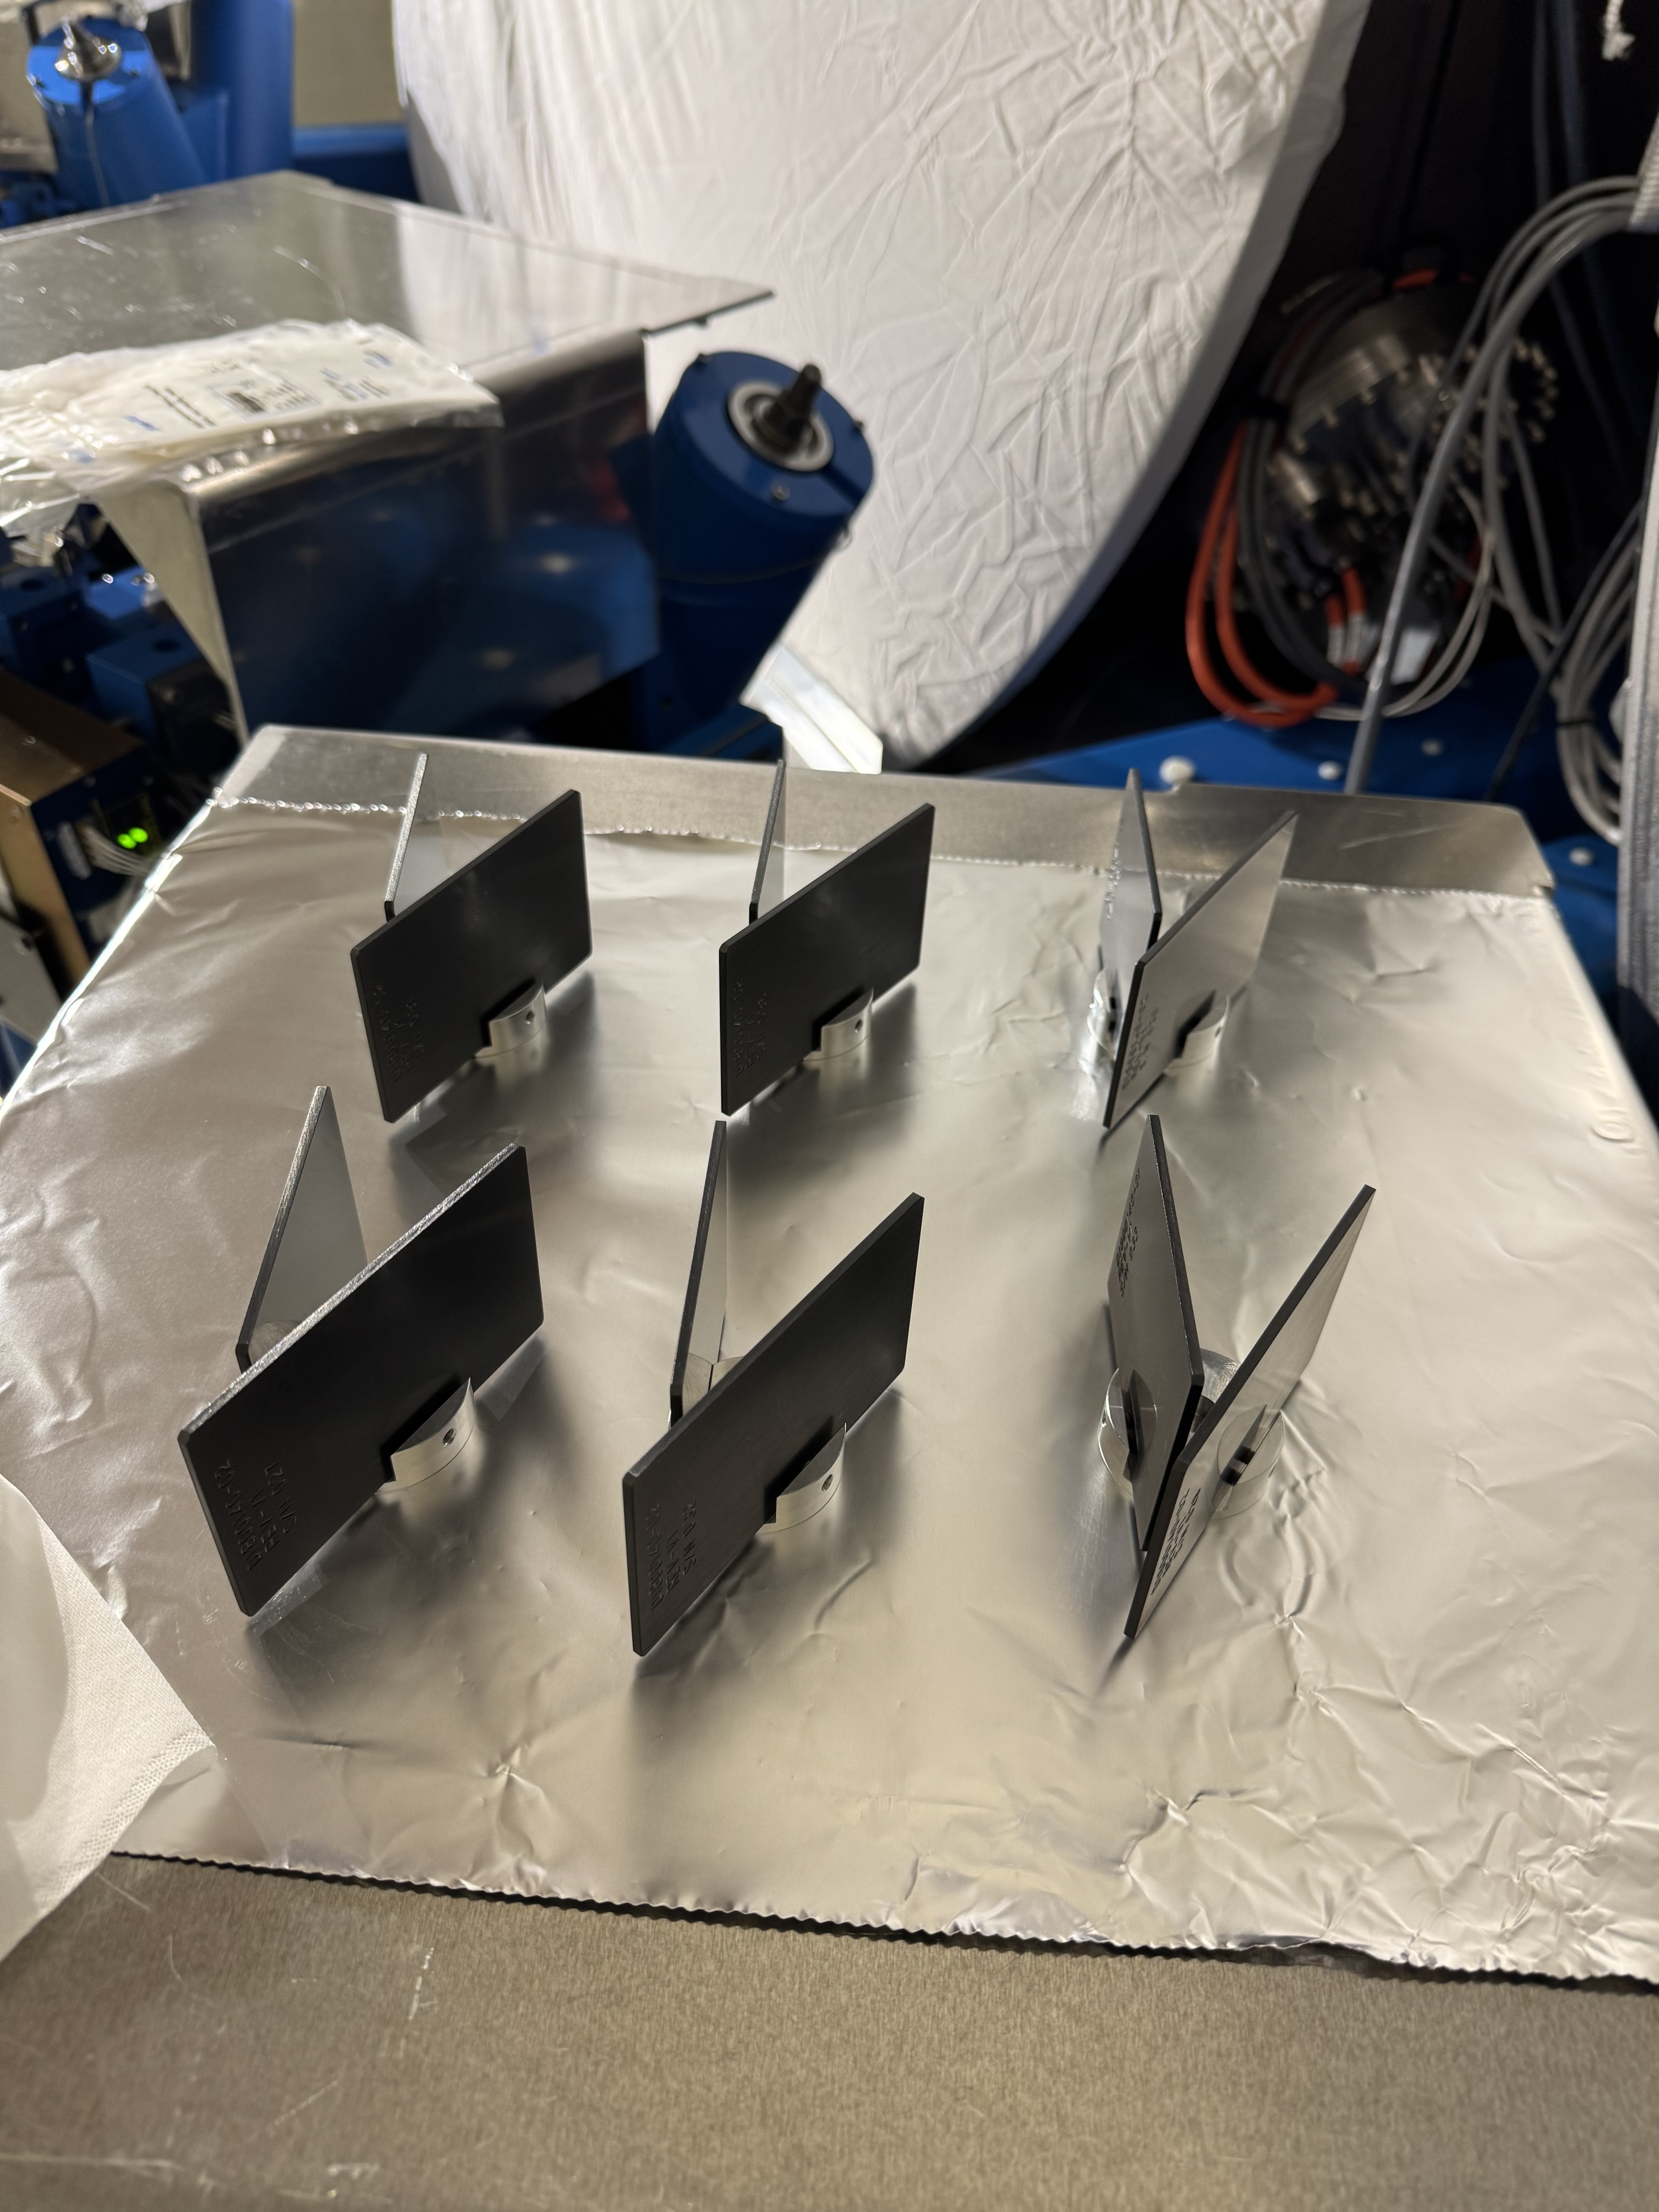
The top part of the SLIC Beam Dump Assembly (D1800139-Type04) was assembled.
The serial numbers of the beam dump plates are listed below.
| Assy# |
D1800140-01 |
D1800140-02 |
| 1 | 33 | 29 |
| 2 | 30 | 32 |
| 3 | 36 | 27 |
| 4 | 27 | 30 |
| 5 | 32 | 36 |
| 6 | 29 | 31 |
The pedestal and spacer have not been attached yet.
Note:
One of the plates (D1800140-01, SN28) has a scratch on the coated side. It was not used in this assembly slot.
I will consult with Alena to determine whether this plate can be used.
[Joan-Rene Merou, Alicia Calafat, Sheila Dwyer, Robert Schofield, Anamaria Effler] We have identified video cameras located in the PSL enclosure, operating at an NTSC-derived frame rate of approximately 29.97 frames per second, as the most probable source of the near-30 Hz comb (fundamental at 29.96951 Hz) observed in DARM. This is a continuation of the work performed to mitigate the set of near-30 Hz and near-100 Hz combs as described is Detchar issue 340 and lho-mallorcan-fellowship/-/issues/3. As well as the work in alogs 88089, 87889 and 87414 and 88433. Continuing with the magnetometer search described in alog 88433, we found out that the 29.96951 Hz line was very strong in the H1-PSL-R2 rack 12 V power supply. Tracing the cabling from this power supply revealed two distinct paths. The first one is a cable feeding a chassis in the H1-PSL-R1 rack, which connects to an Axis 241Q video server. This server supplies four beam cameras located inside the PSL enclosure. Then, a second cable feeding a small fused distribution unit, from which three white cables emerge. At least two of these enter the PSL enclosure directly, and the third appears to route upward toward the entrance area. These cables were identified as supplying three additional cameras in the PSL enclosure. The relationship between the power supply, fused distribution unit, and cameras is illustrated in the diagram below.On 2025-12-17, we went with Robert to disconnect the green power supply cable. Disconnecting the green power cable from the 12 V power supply caused the 29.96951 Hz line to disappear from magnetometer. Reconnecting the cable resulted in a gradual reappearance of the line. Disconnecting individual cameras connected to the Axis 241Q server produced no significant change in the comb amplitude, suggesting these cameras are not the dominant contributors. In contrast, removing the three fuses from the fused distribution unit immediately eliminated the 29.96951 Hz line. Upon returning to the control room and restarting the cameras via the standard startup procedure (showed to us by Oli Patane), the line reappeared promptly. This sequence strongly implicates the three cameras powered through the fused distribution unit as the primary source of the comb. The photographs below show the differences between having the 3 cameras on or off and the peak as seen in the voltage monitor plugged to the 12 V power supply.
According to /opt/rtcds/userapps/release/cds/h1/scripts/fom_startup/nuc21/launch.yaml, the three cameras identified above are Axis 215 PTZ Network Cameras. The Axis 215 PTZ have a maximum frame rate of up to 30 fps, NTSC-compatible video timing and Nominal NTSC frame rate of 29.97 frames per second. NTSC (National Television System Committee) is an analog color encoding system used in television systems in Japan, the United States and other parts of the Americas. An NTSC picture is made up of 525 interlaced lines and is displayed at a rate of 29.97 frames per second. This frequency matches the observed comb fundamental (29.96951 Hz) to within <1 mHz, within expected drift for video timing systems. Some sources: - Axis 215 PTZ Network Camera data sheet - Axis 215 PTZ Network Camera technical details - NTSC encoding system information Another clue that pinpoints to an electronic origin is that the the line width is noted as 0.00042 Hz towards each side in the O4ab lines list (LIGO-T2500212). This means that the line amplitude is around 30 ppm, consistent with what we expect from an electronic element with its own clock (not tied to the GPS system) and this clock not being ultra precise. It is possible that the way cameras are connected in LLO is different from LHO, or that the cameras themselves are different, which would explain why the comb is in LHO but not in LLO. Note that there is a line at LLO closer to 30 Hz but not at 29.97 Hz. There are various changes that can mitigate the comb. Turning off the cameras would be the first one. Another idea is to turn of only 2 of the cameras, one in the entrance to the PSL enclosure and another one being one of the top corner in the PSL enclosure. Leaving one of the three there but reducing significantly the strength of the line. These cameras have an upper limit of 30 FPS. Getting more modern cameras at 60 FPS, thus moving the line to 60 Hz, could also be an idea. Using the camera controls, we have also checked what happens if we change the frame rate of the cameras. When we reduced it to 1 frame per second instead of 30 frames per second, we were able to see peaks at every 1 Hz, while the peak at 29.97 Hz was much lower.
(Red line is a live voltage monitor on the power supply and blue one is a reference before changing camera settings) On 2025-12-18, we have further investigated which one of the 3 Axis 215 cameras is responsible for most of the peak amplitude. These cameras are h1pslcam0, h1pslcam1, and h1pslcam2. In their default setting and default orientation, the peak amplitude in the voltage monitor PSD was around 150 1/Hz. We have then disconnected the three of them and reconnected them back on: - With only h1pslcam0 on, the peak amplitude was around 60-80 1/Hz. - With only h1pslcam1 on, the peak amplitude was around 40-50 1/Hz. - With only h1pslcam2 on, the peak amplitude was around 10 1/Hz. - With no cameras on, the peak cannot be seen. Hence, it would appear that not all cameras have the same effect on the peak amplitude. h1pslcam2 is in the PSL enclosure pointing towards to table. From the other two, one also points towards the table and the other one is in the entrance room to the enclosure. Therefore, since h1pslcam2 has the smallest peak amplitude and has the same function as the other one in the enclosure, an option could be to just leave this camera on and turn off the other two ones. Note that the near-100 Hz peaks do not dissapear from the voltage monitor if we turn off the cameras, which probably points to a different source. We have further tested the settings in h1pslcam2 to see what else decreases the peak amplitude. We have seen that checking of the "de-interlacing" slighly also decreased the peak amplitude, from around 10 1/Hz to 7 or 8 1/Hz. Reducing the camera frame rate from 30 fps to 1 fps further reduces a bit the peak to 5 1/Hz. Reducing the gain in low-light in the camera advanced settings also appeared to reduce a bit the peak amplitude to around 4 1/Hz. Note that reducing the fps to 1 also creates small peaks every 1 Hz in the voltage monitors, but these are smaller than the one at 30 Hz:
(blue is a reference with the three cameras on) On 2025-12-19 we produced the following table of plots showing the height of the peak at 29.96951 Hz, as well as the near-100 Hz peak at 99.998455 Hz and 2 of their intermodulations, one at 99.998455 Hz + 29.96951 Hz and another one at 99.99845486125*2 - 29.96951 Hz. Each row represents a different configuration: - The first row represents the actual default status with all cameras on in their default configuration. - The second row shows only having h1pslcam2 with its default configuration - The third row shows only having h1pslcam2 on with the configuration we have found optimal to reduce the 29.97 Hz peak (1 fps instead of 30 fps, no de-interlacing, low-light max gain of 0 dB and manual exposure control.) Note that on 2025-12-19 while the reduction factor between the first and last configuration at 29.96951 Hz is still ~30, it began at a height of ~80 and went down to ~2.5 instead of from ~150 to ~5. As can be seen in the table of figures below, the 99.99 Hz peak does not change that much, while the intermodulations do become smaller as we reduce the height of the 29.96951 Hz line.
This appears a reasonable setting in which to leave the cameras if we want one on: h1pslcam0 and h1pslcam1 turned off. h1pslcam2 and the beam cameras turned on. h1pslcam2 checked off the "de-interlacing" setting, fps set to 1, resolution set to 4CIF (reducing resolution does not appear to have much influence), reduce the low-light gain below to optimally 0 dB and set exposure control to manual with the shutter speed to 1/60 s. This configuration is expected to reduce the peak amplitude in the voltage monitor from around 150 1/Hz to 5 1/Hz. This factor 30, if the same reduction takes place in DARM, should significantly reduced the peak and have a lesser effect on CW searches. Note that in order to fully not affect CW searches, the optimal would be to just turn off the cameras. Looking at the O4ab averaged plots used to create the lines lists, the peak at 29.96951 Hz is over 2 orders of magnitude stronger than the surrounding noise. The peak is expected to be smaller in O4c given the change in H1:SUS-ITMY_L3_ESDAMON_DC_OUT16 bias studied in 87414, but only turning off the cameras would ensure getting rid of it. In conclusion, the evidence strongly supports that the near-30 Hz comb observed in DARM originates from NTSC-timed video cameras in the PSL enclosure, specifically the Axis 215 PTZ cameras powered by the H1-PSL-R2 12 V supply. Powering them off and on, fuse removal, frame-rate manipulation, and frequency matching all independently confirm this attribution. Optimally, we recommend turning the cameras off or changing them. If one should stay on, we recommend having only h1pslcam2 on with the optimal configuration described above.


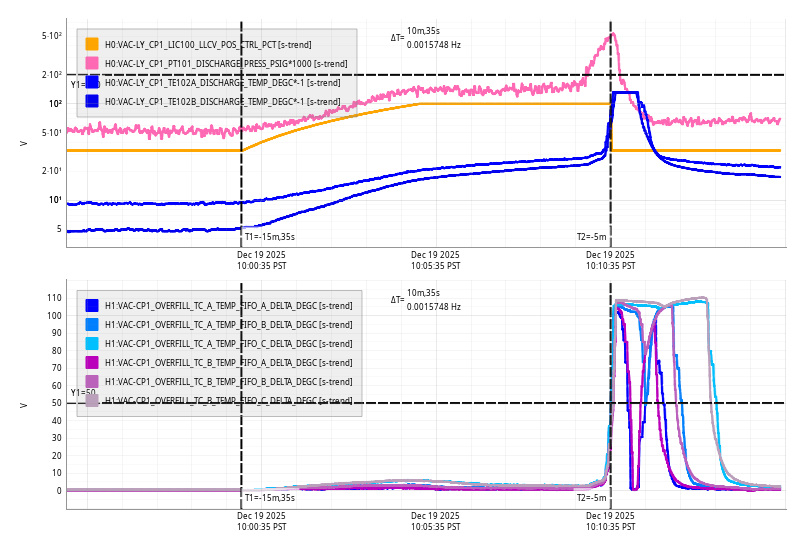
Fri Dec 19 10:10:35 2025 INFO: Fill completed in 10min 31secs
This morning Fil disconnected the table, I removed the bellows and added viewport covers and lexan, and then Randy and I moved the table out of the cleanroom and to the side in the +X direction from it's original location. The bellows I placed in the HAM3 cleanroom on top of the rack, covered in foil.
Fil also noticed that the ISCT1 bellows were still open, though hanging down. I took the extra precaution and covered these with foil as well to prevent dust drifting onto the table.
Dust counts during the whole process were 0's or 10's when I looked. This seemed too low so I rubbed my glove above the dust monitor during a sample and counts shot up to the hundreds. I guess that space really is that clean, great!
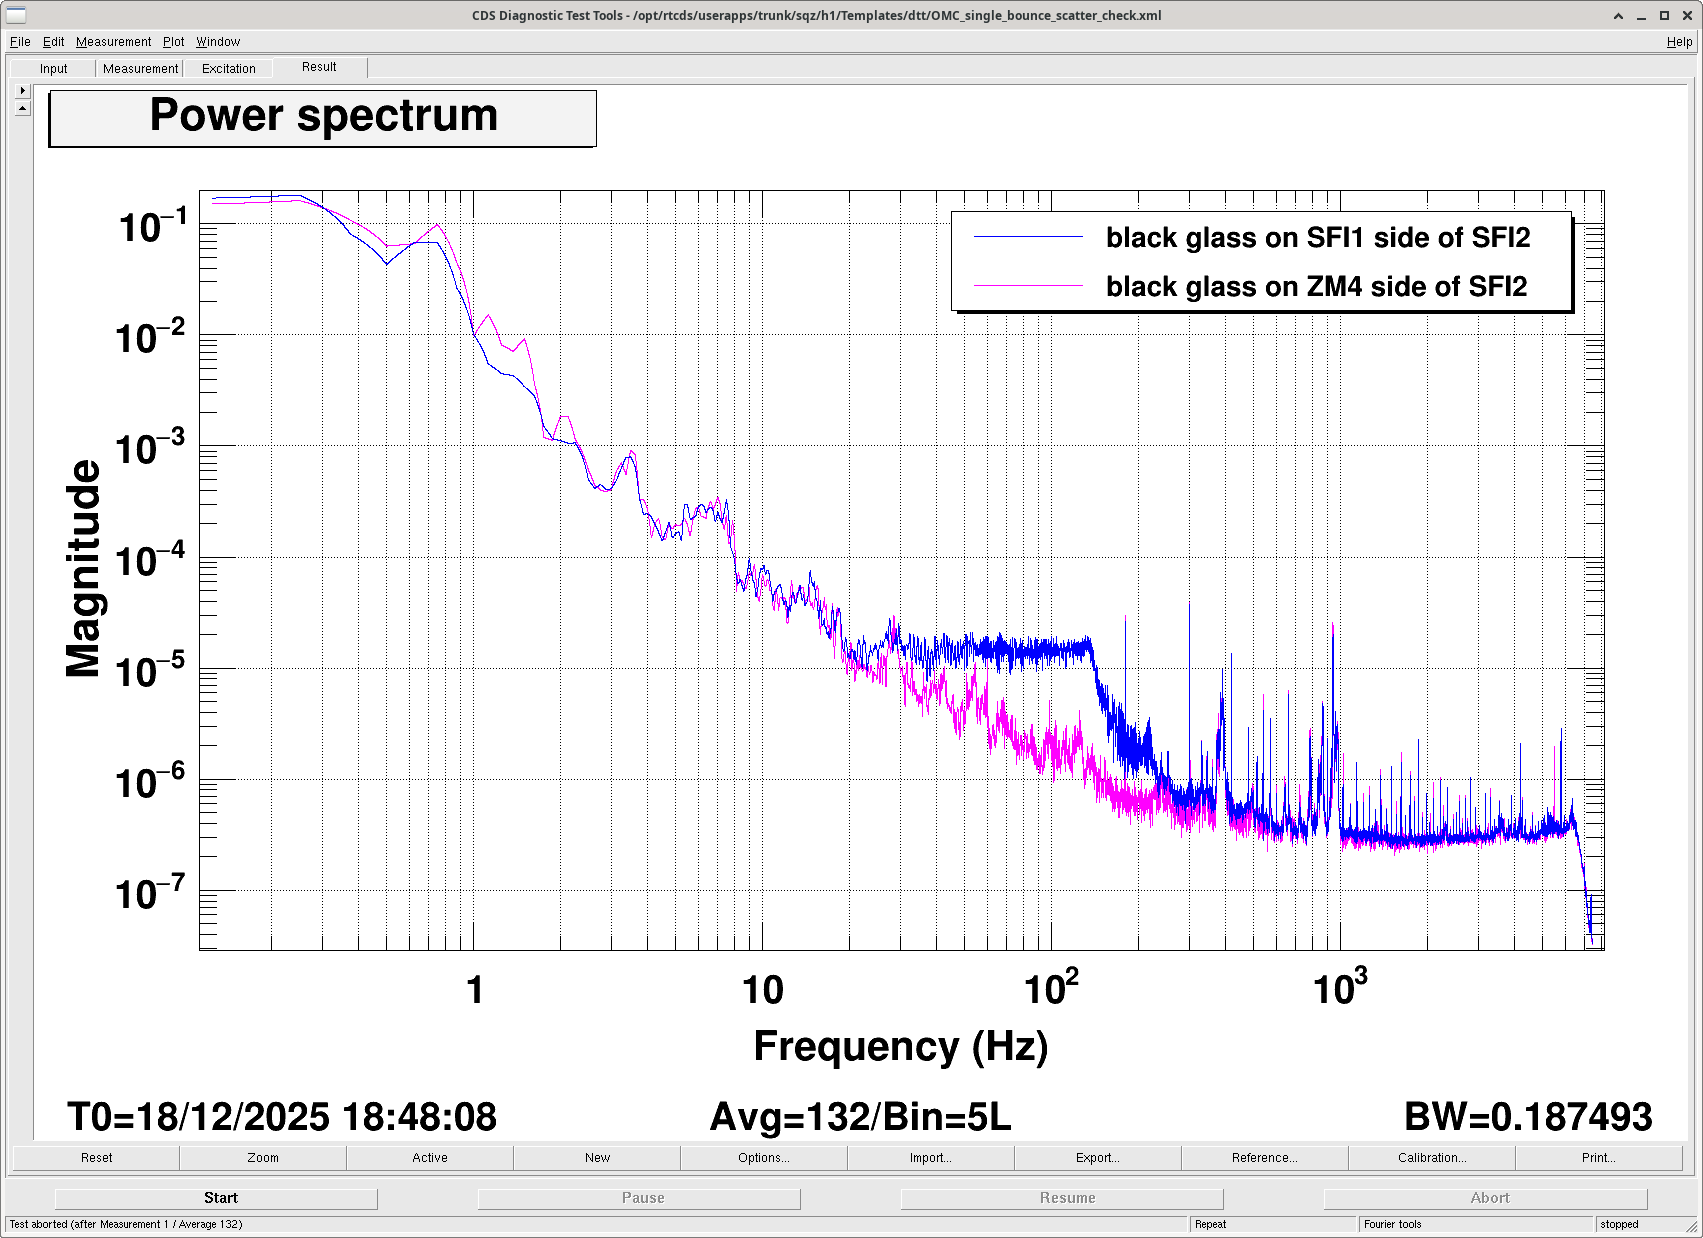
Robert, Sheila, Eric, Daniel D
Yesterday morning we were able to identify the source of the scatter in HAM7 as being SFI2, and notice that the beam is very off center on the polarizer on the ZM4 side of SFI2, B:P2.
We locked the OMC on a single bounce beam with 50W input to the IMC, and turned on the ISS second loop, and got 67mA DCPD sum. With the viewport on the HAM5 gate valve and a 1 Hz excitation of 1000 counts amplitude on ZM5 TEST, we could clearly see a fringe wrapping shelf at 140 Hz. We used a piece of black glass to block the beam and could see the scatter shelf go away when the black glass was after B:P2 and reappear when the black glass was before the rotator.
Robert got some photos of the location of the beam on B:P2, it is clearly off center and near the +Y edge of the polarizer aperture. We attempted to steer the ZMs to bring it close to the center, but we clipped the beam on the aperature attached to B:L2 before we could bring the beam close to centered. This indicates that this path was aligned with the beam poorly centered on the Faraday.


Moving the SFI in the +Y direction by 0.17 inches would center the beam
I calibrated 3 photos, two IR and one cell phone photos, using the 1 inch width of the wedge mount, D2000233_A+_SFI_KTP_Wedge_Mount.pdf. I took the photos approximately face on to the SFI as Sheila held the card. The three values for how far the beam was off center were 0.16, 0.17 and 0.18 inches.
[Eric, Daniel, Karmeng]
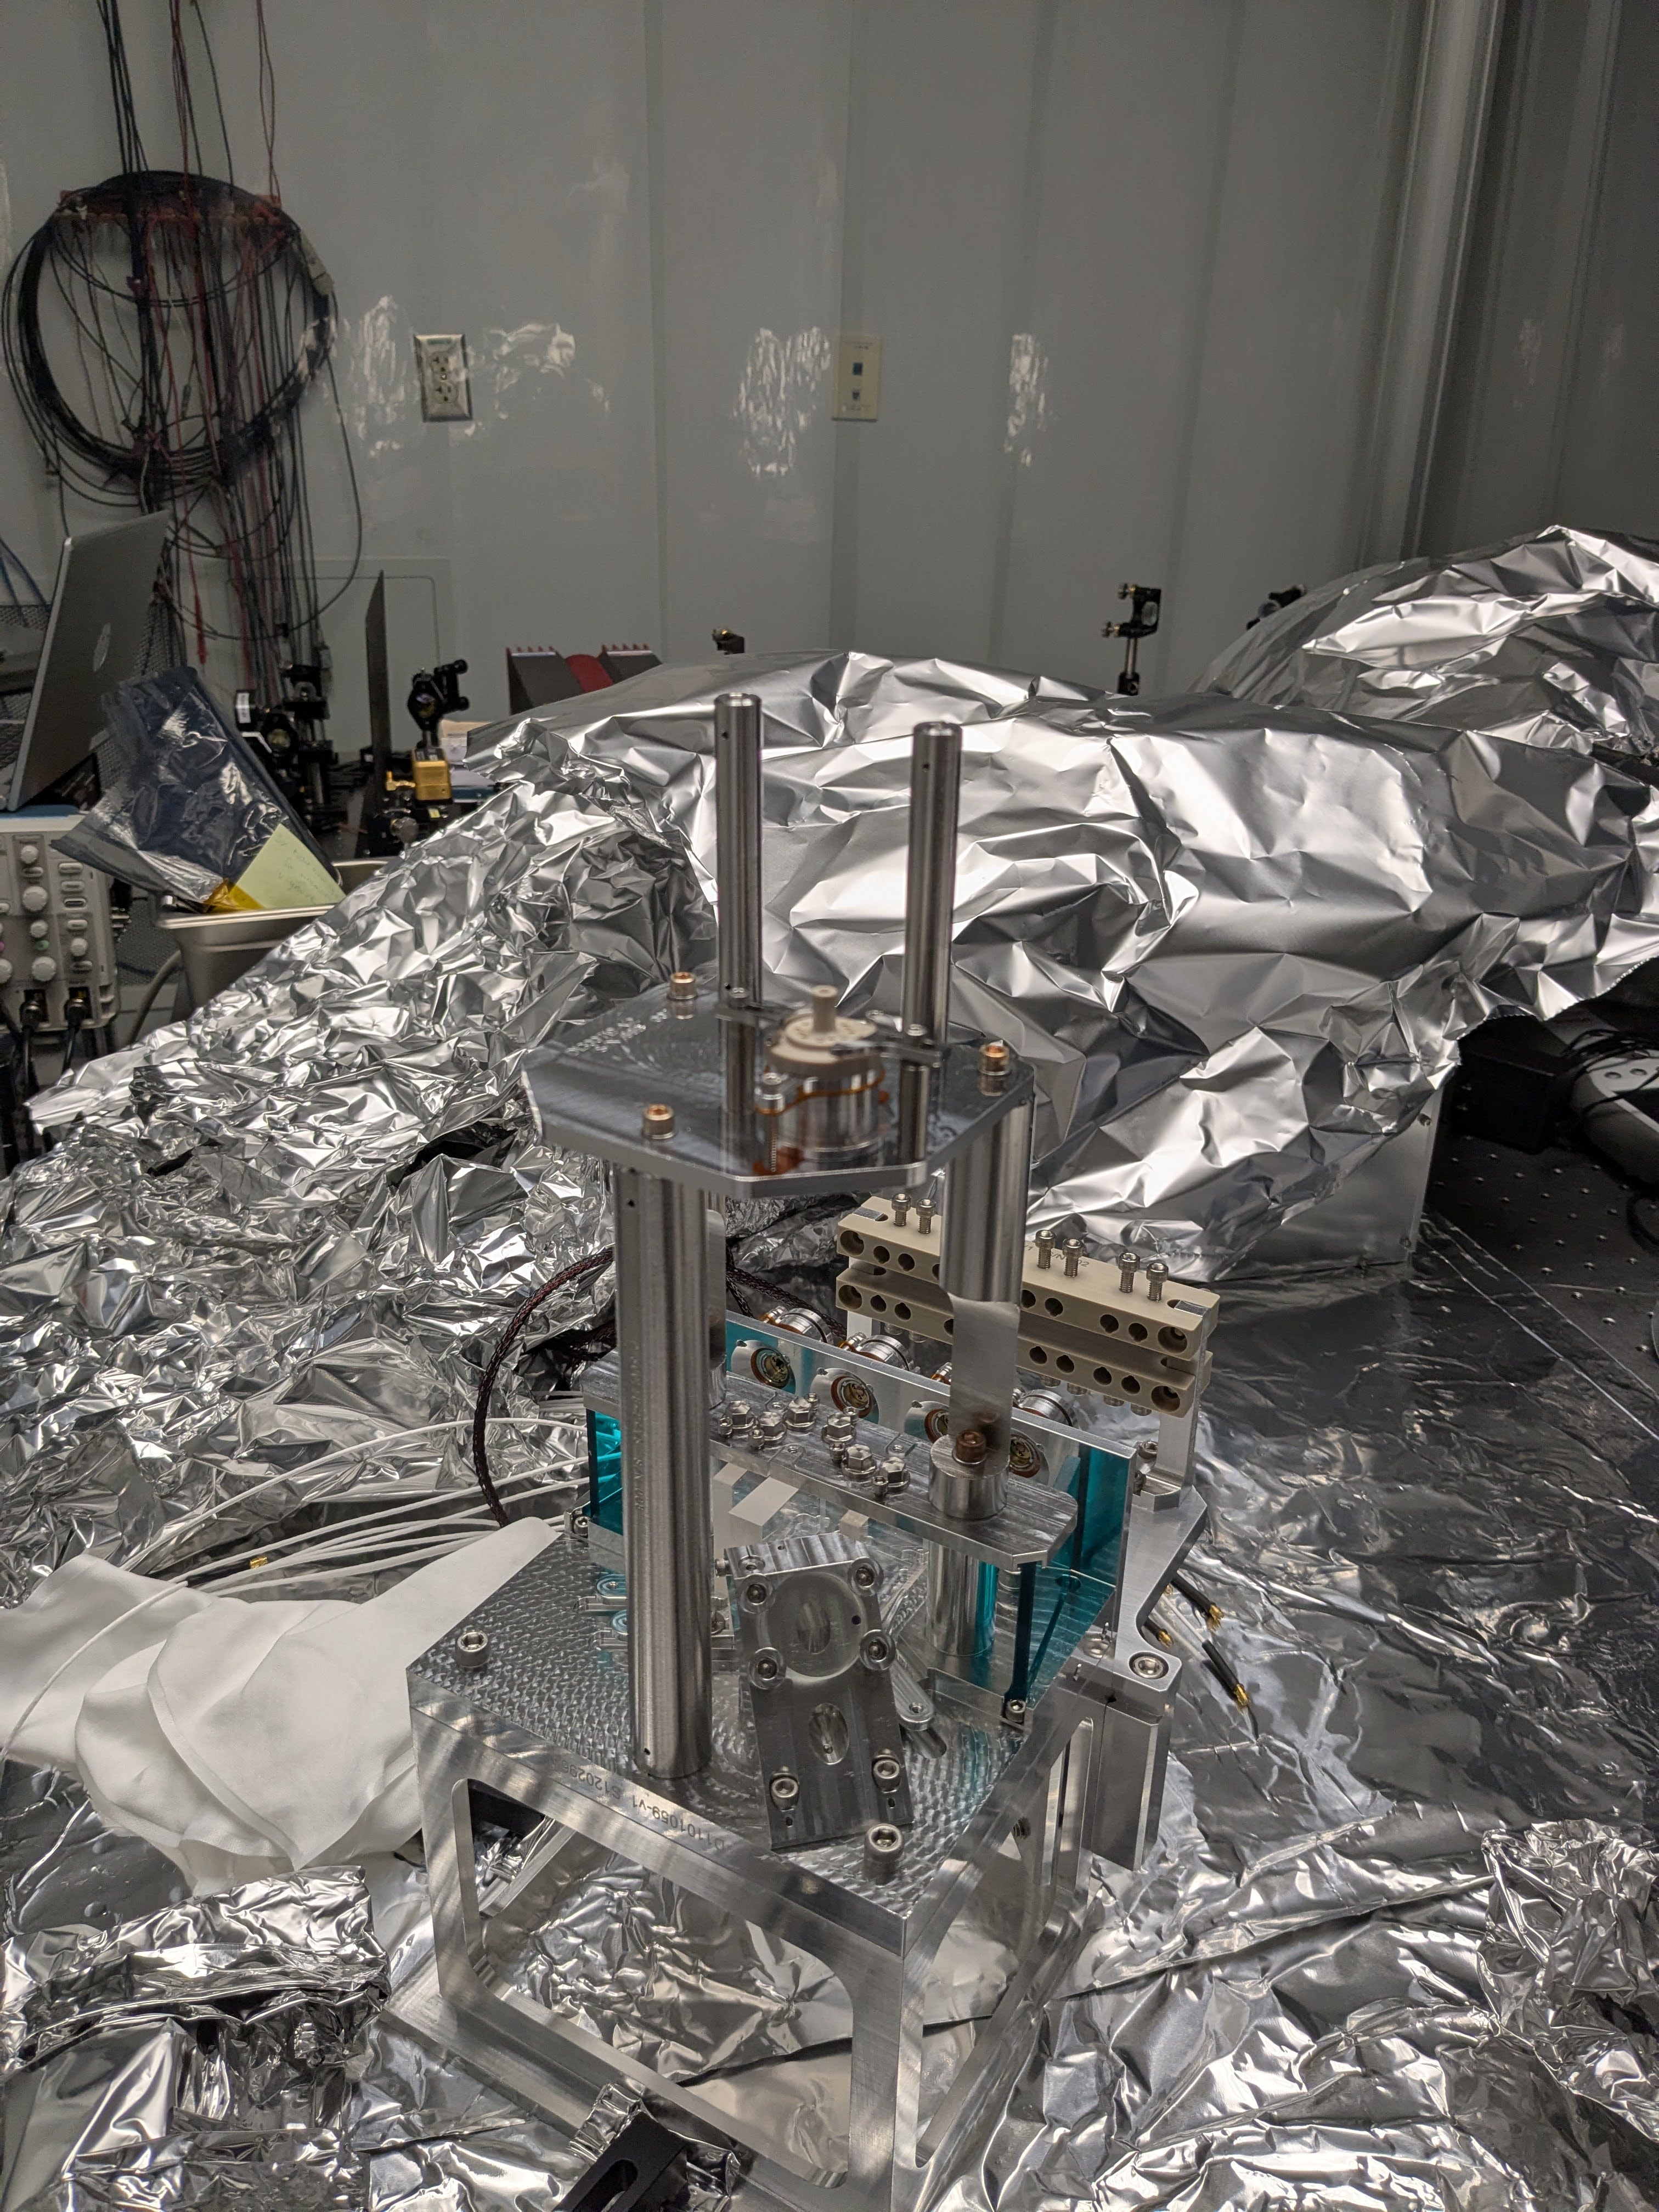
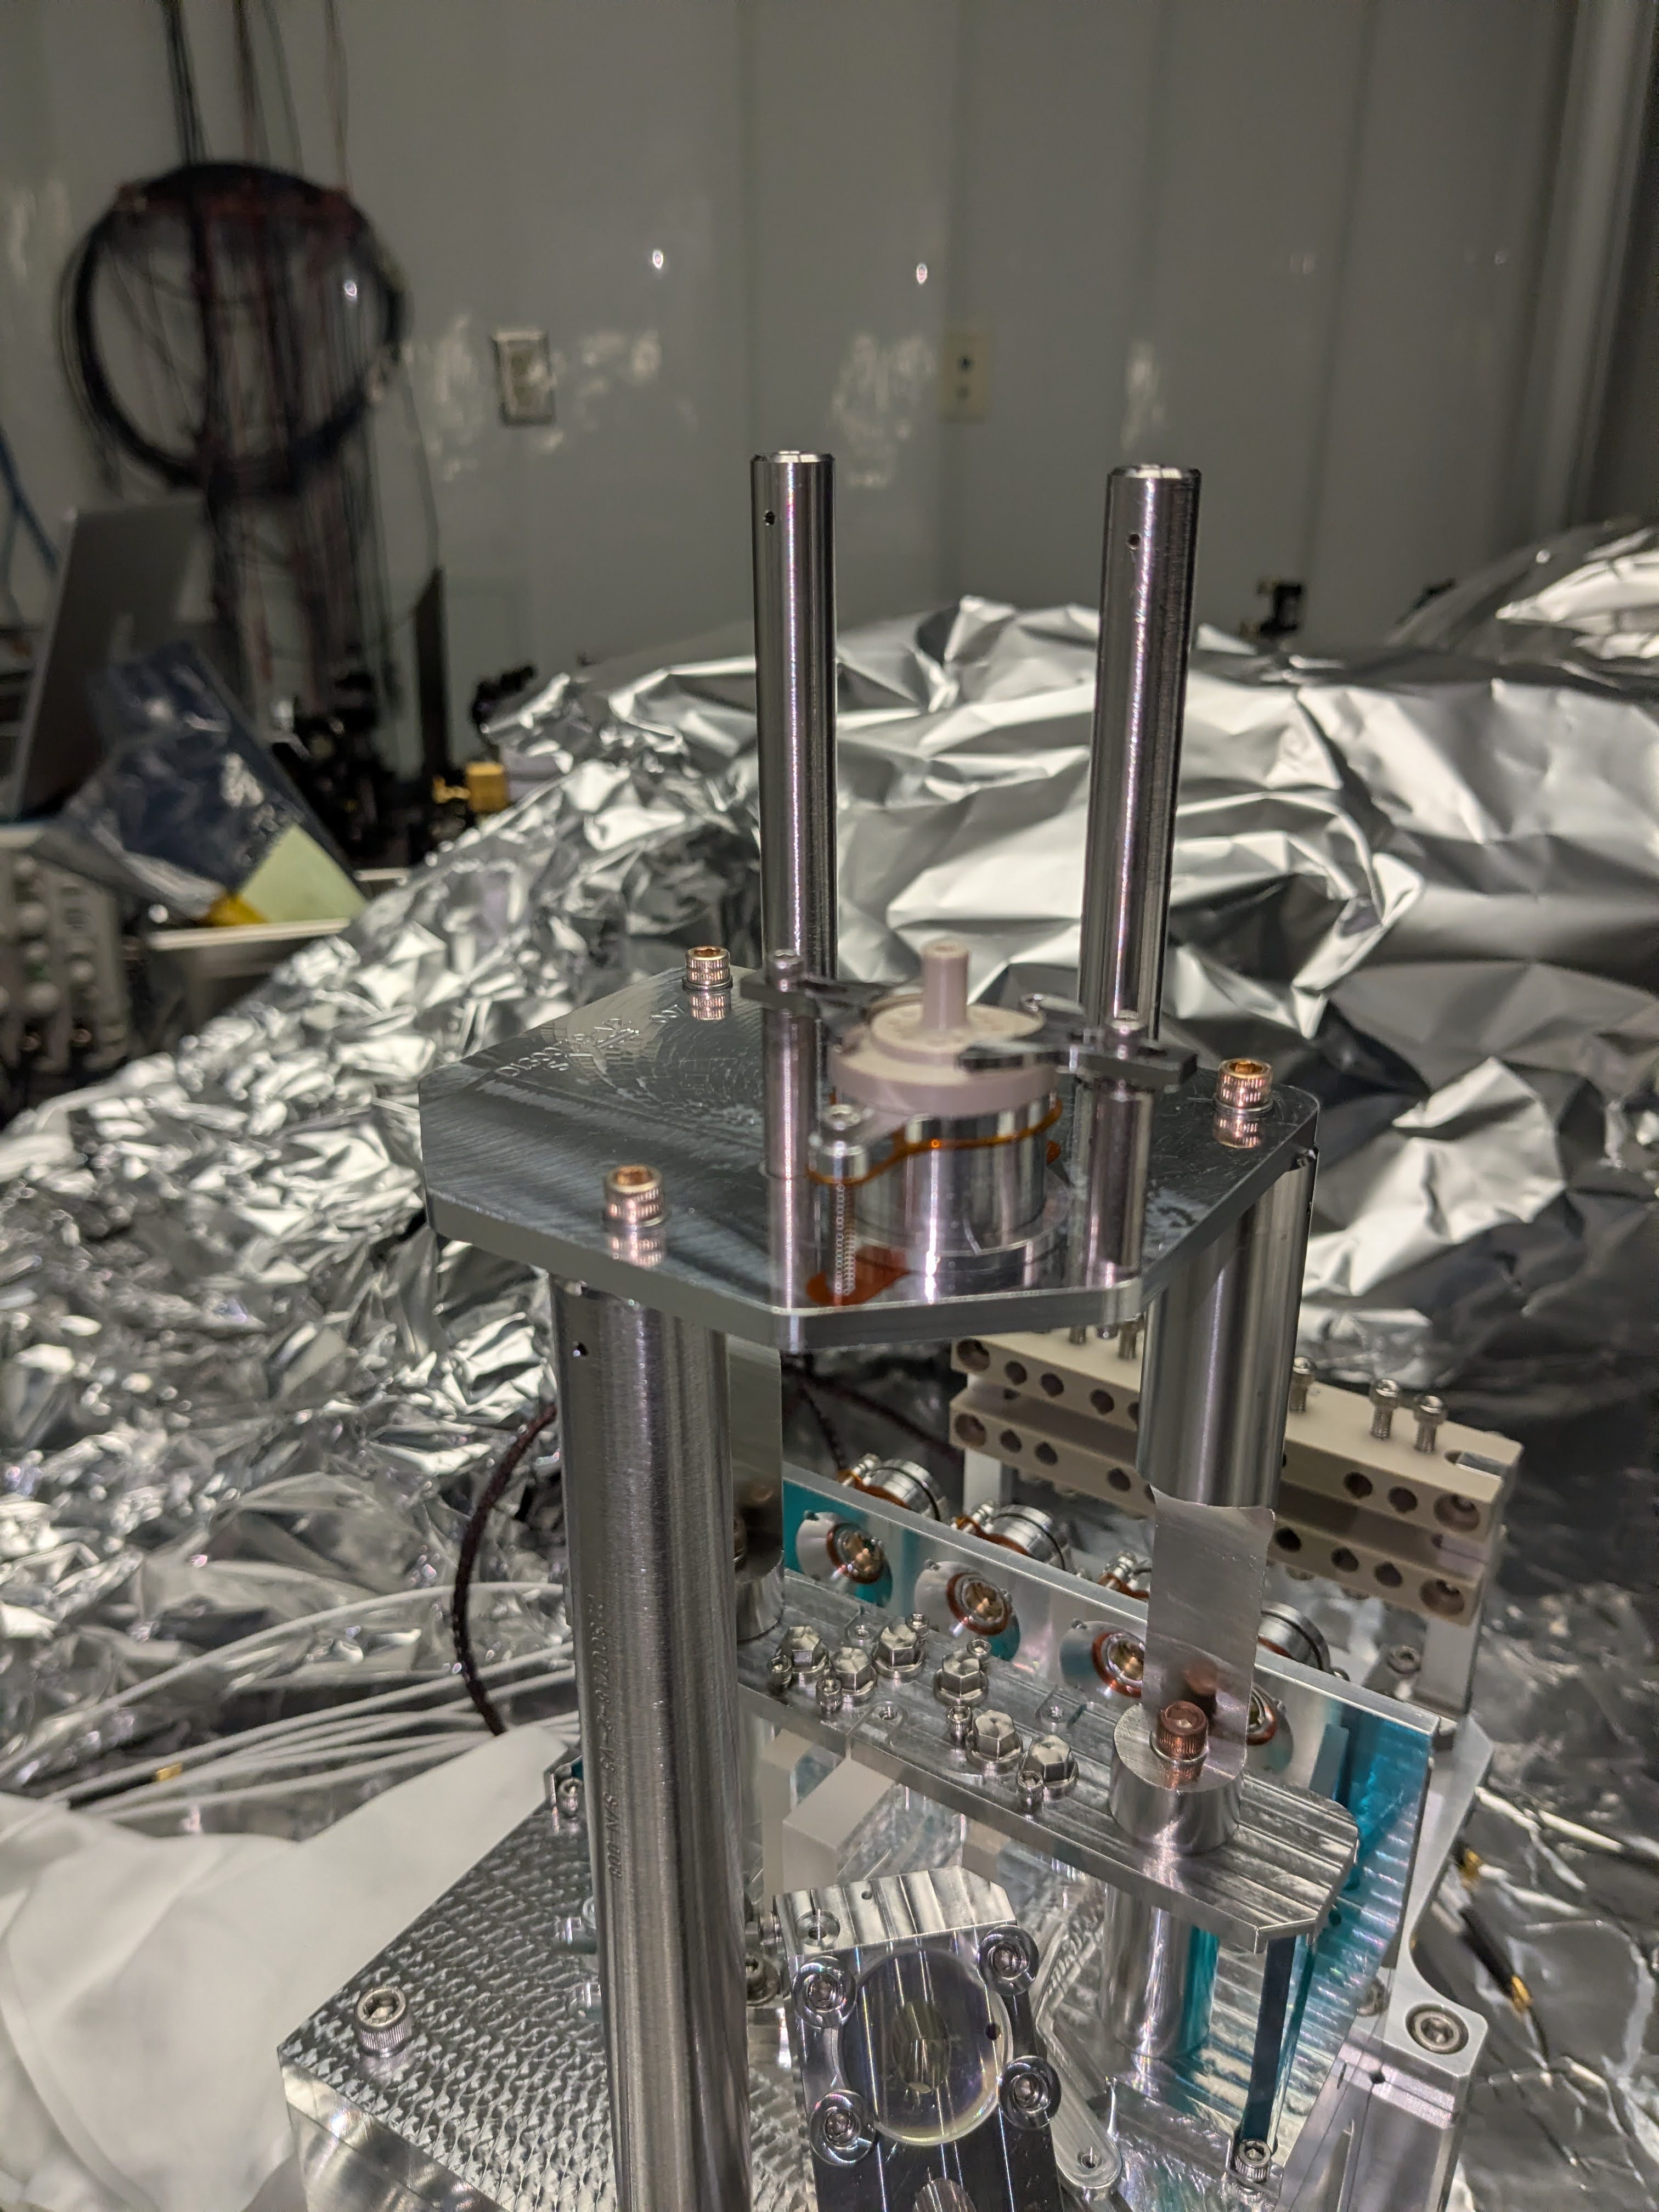
We transferred the OPO from LVEA to optics lab, uncovered the lids and everything looks good.
Touch the mirror mounts and mirrors, no failure except for M3, which swivels off the mount, only part of the glue holding the mirror on the mount.
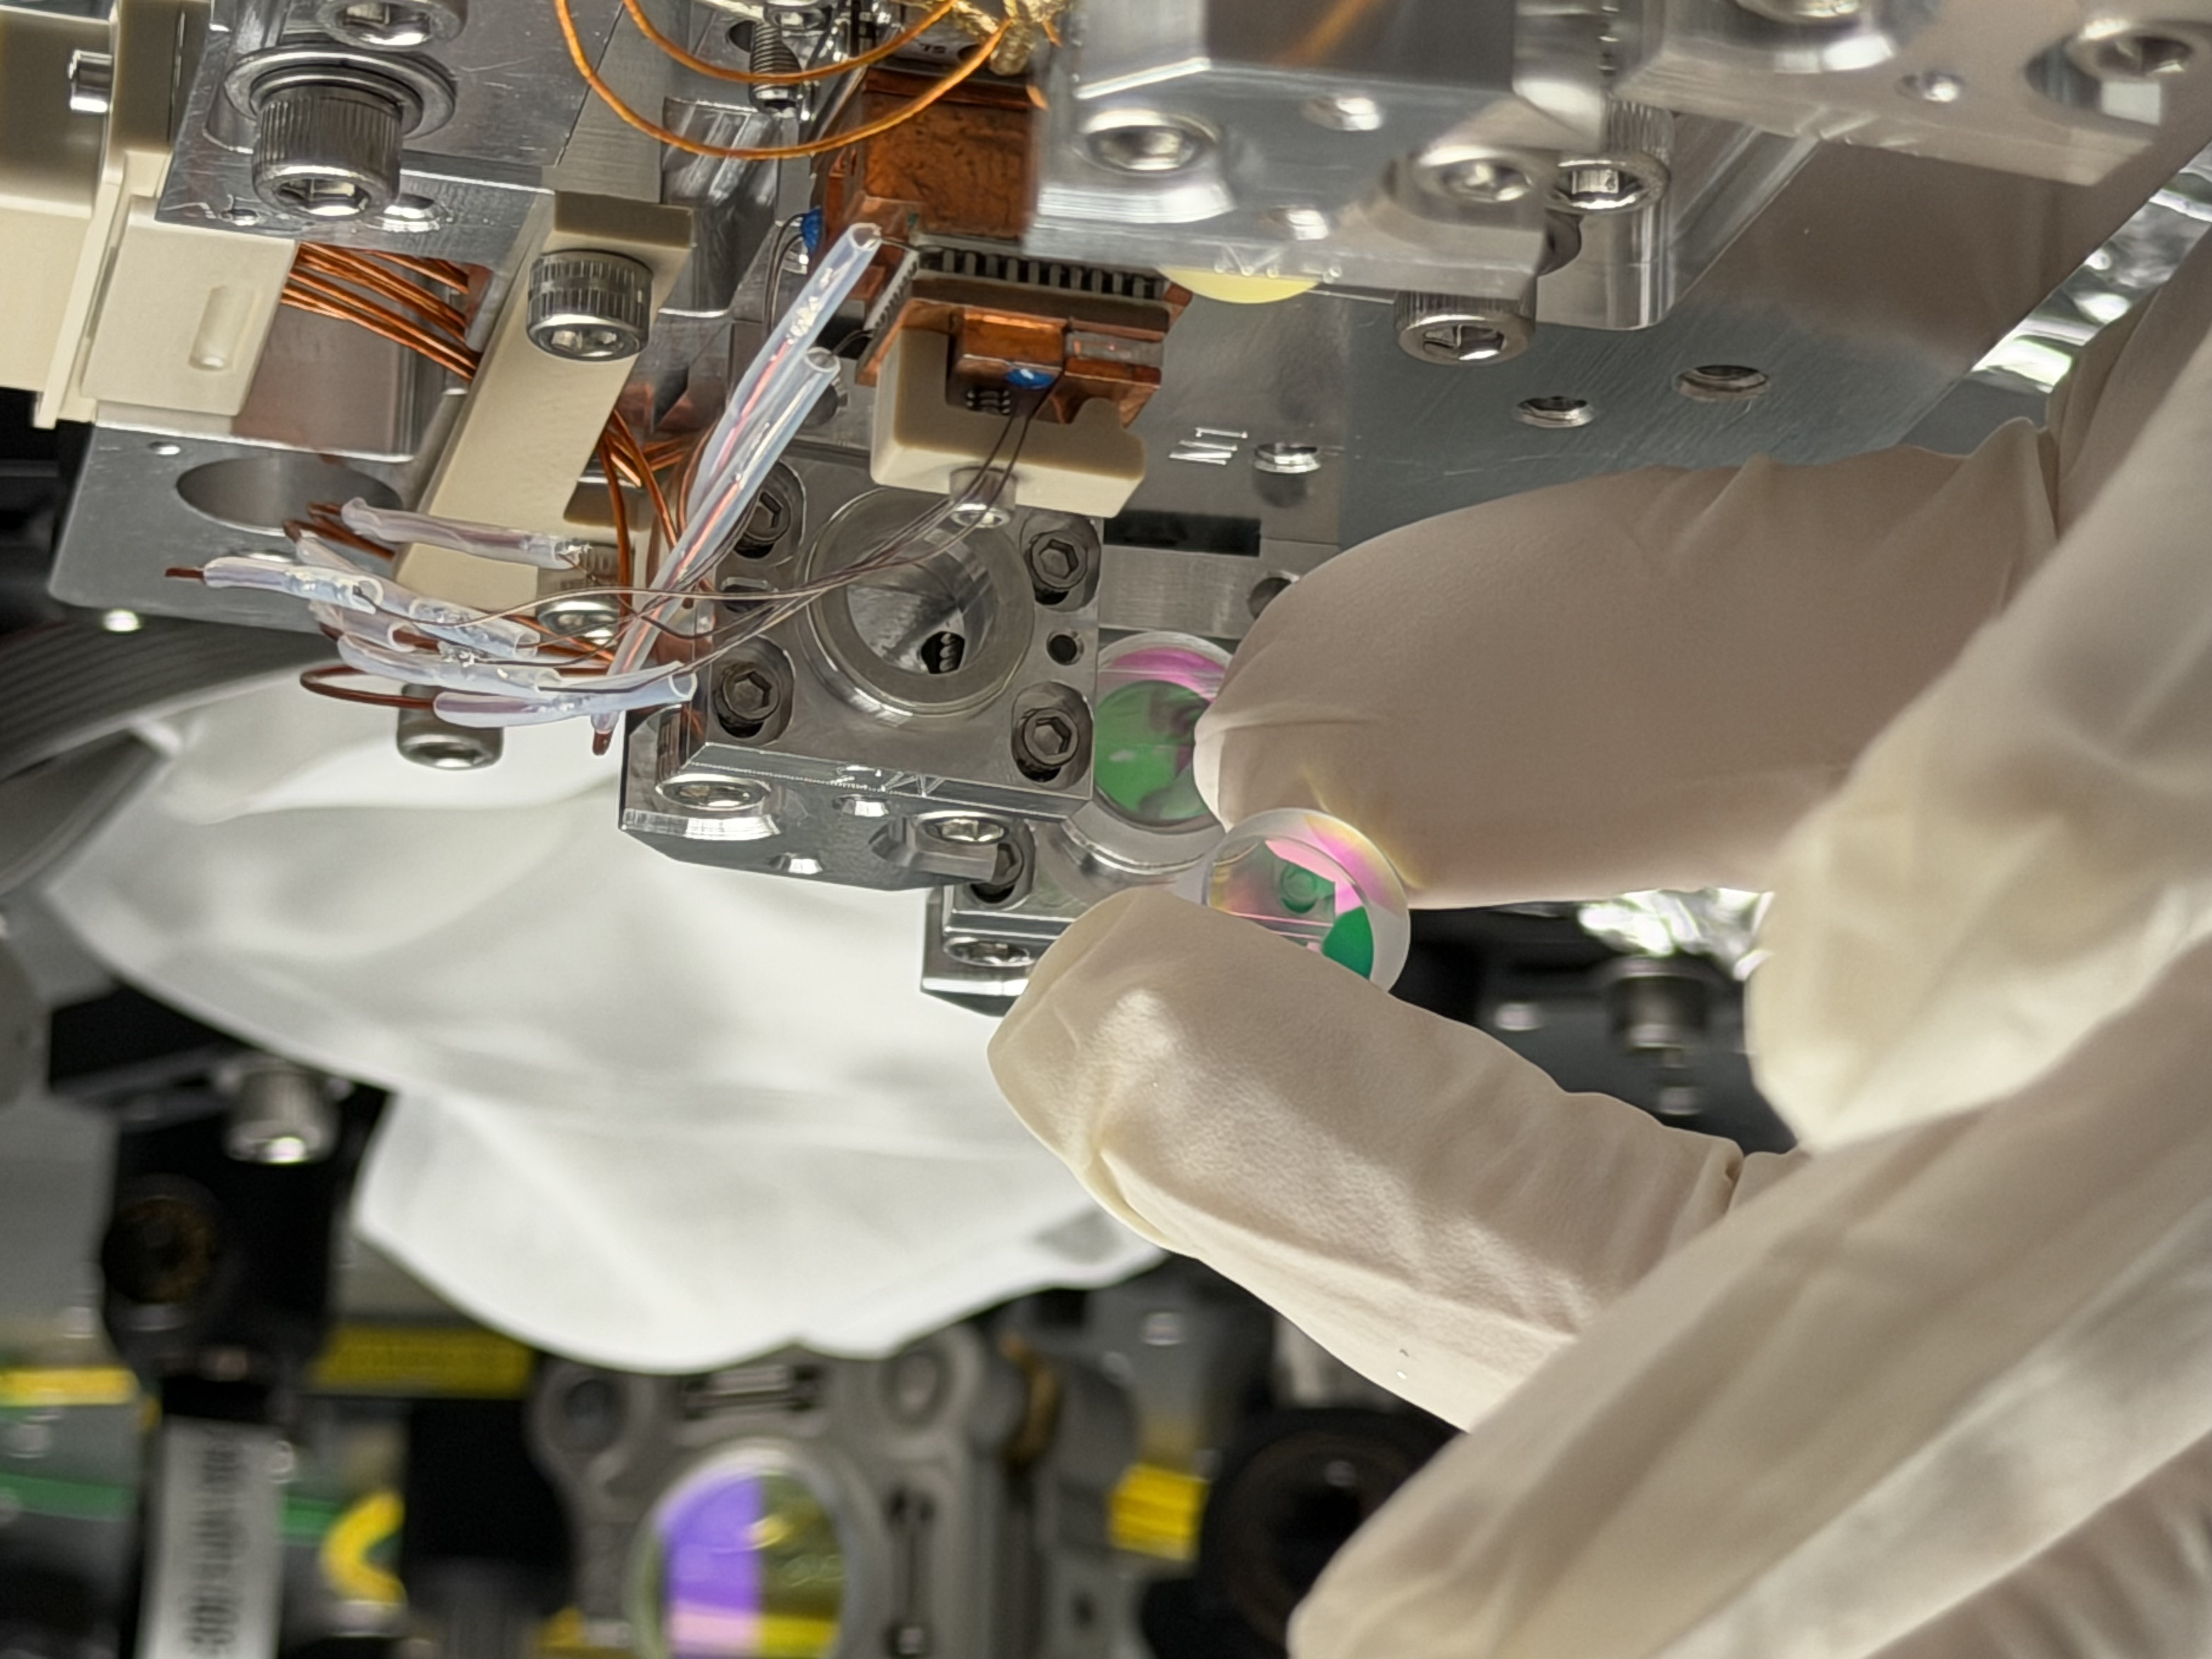
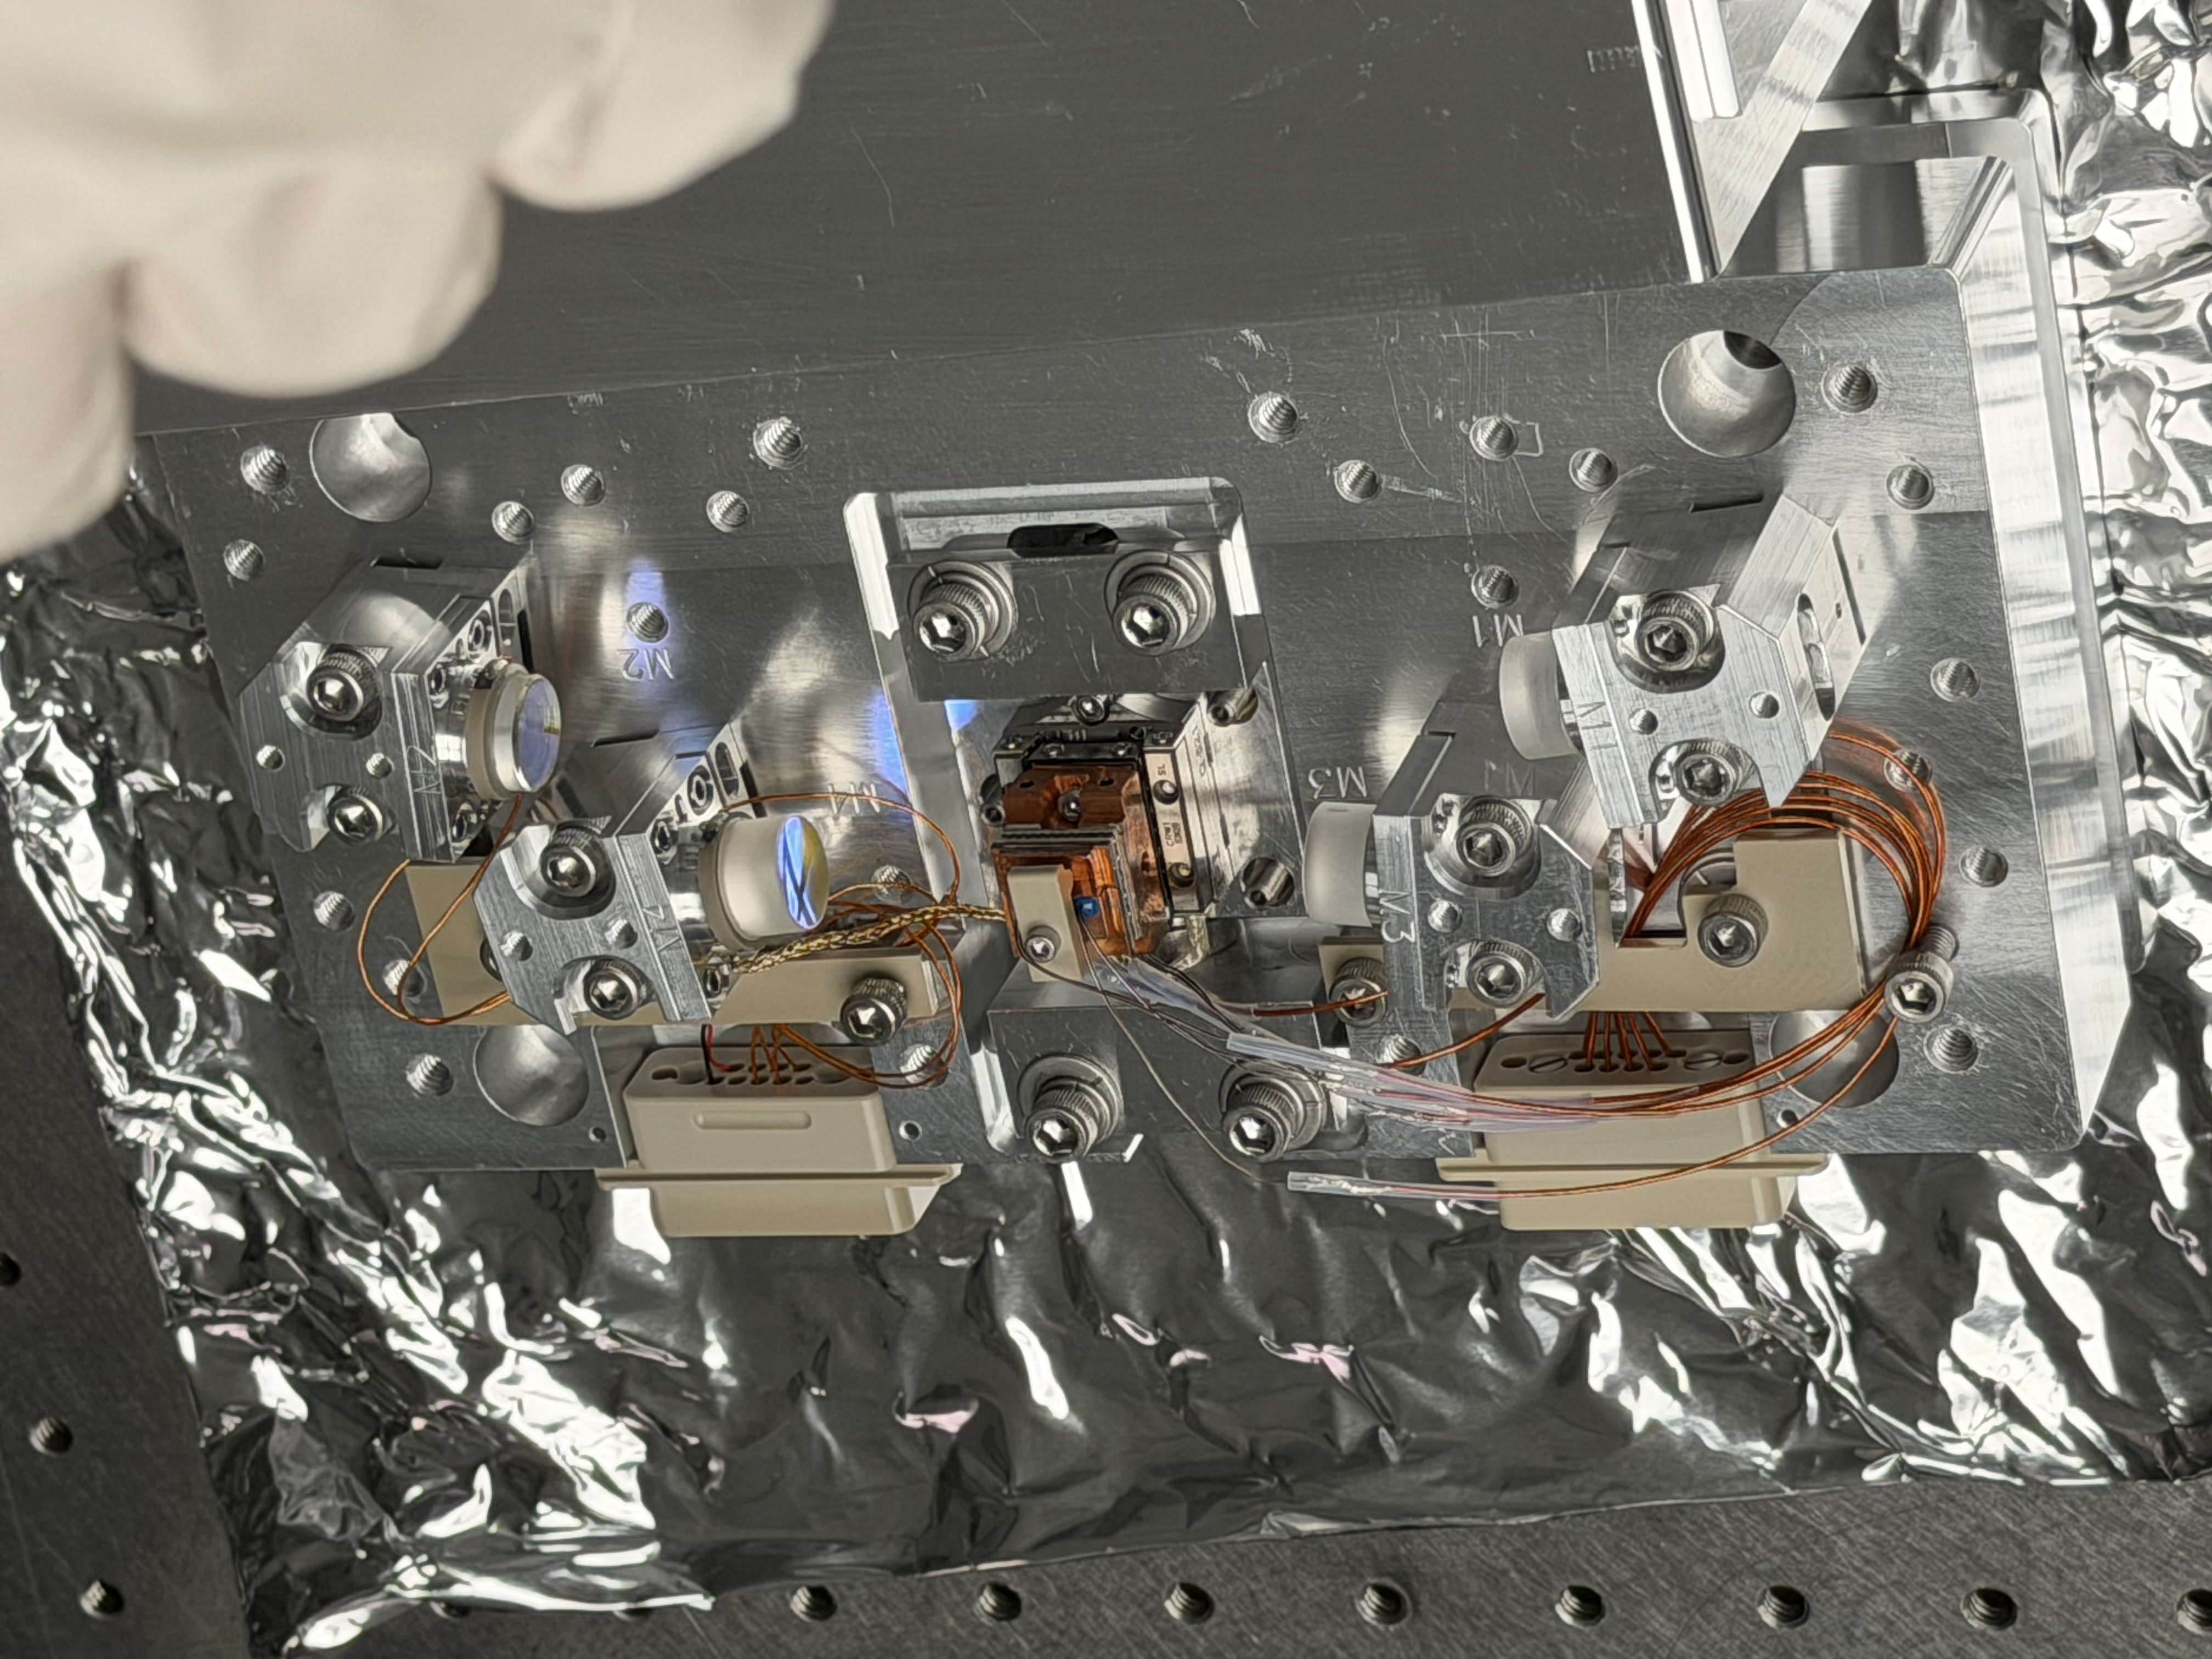
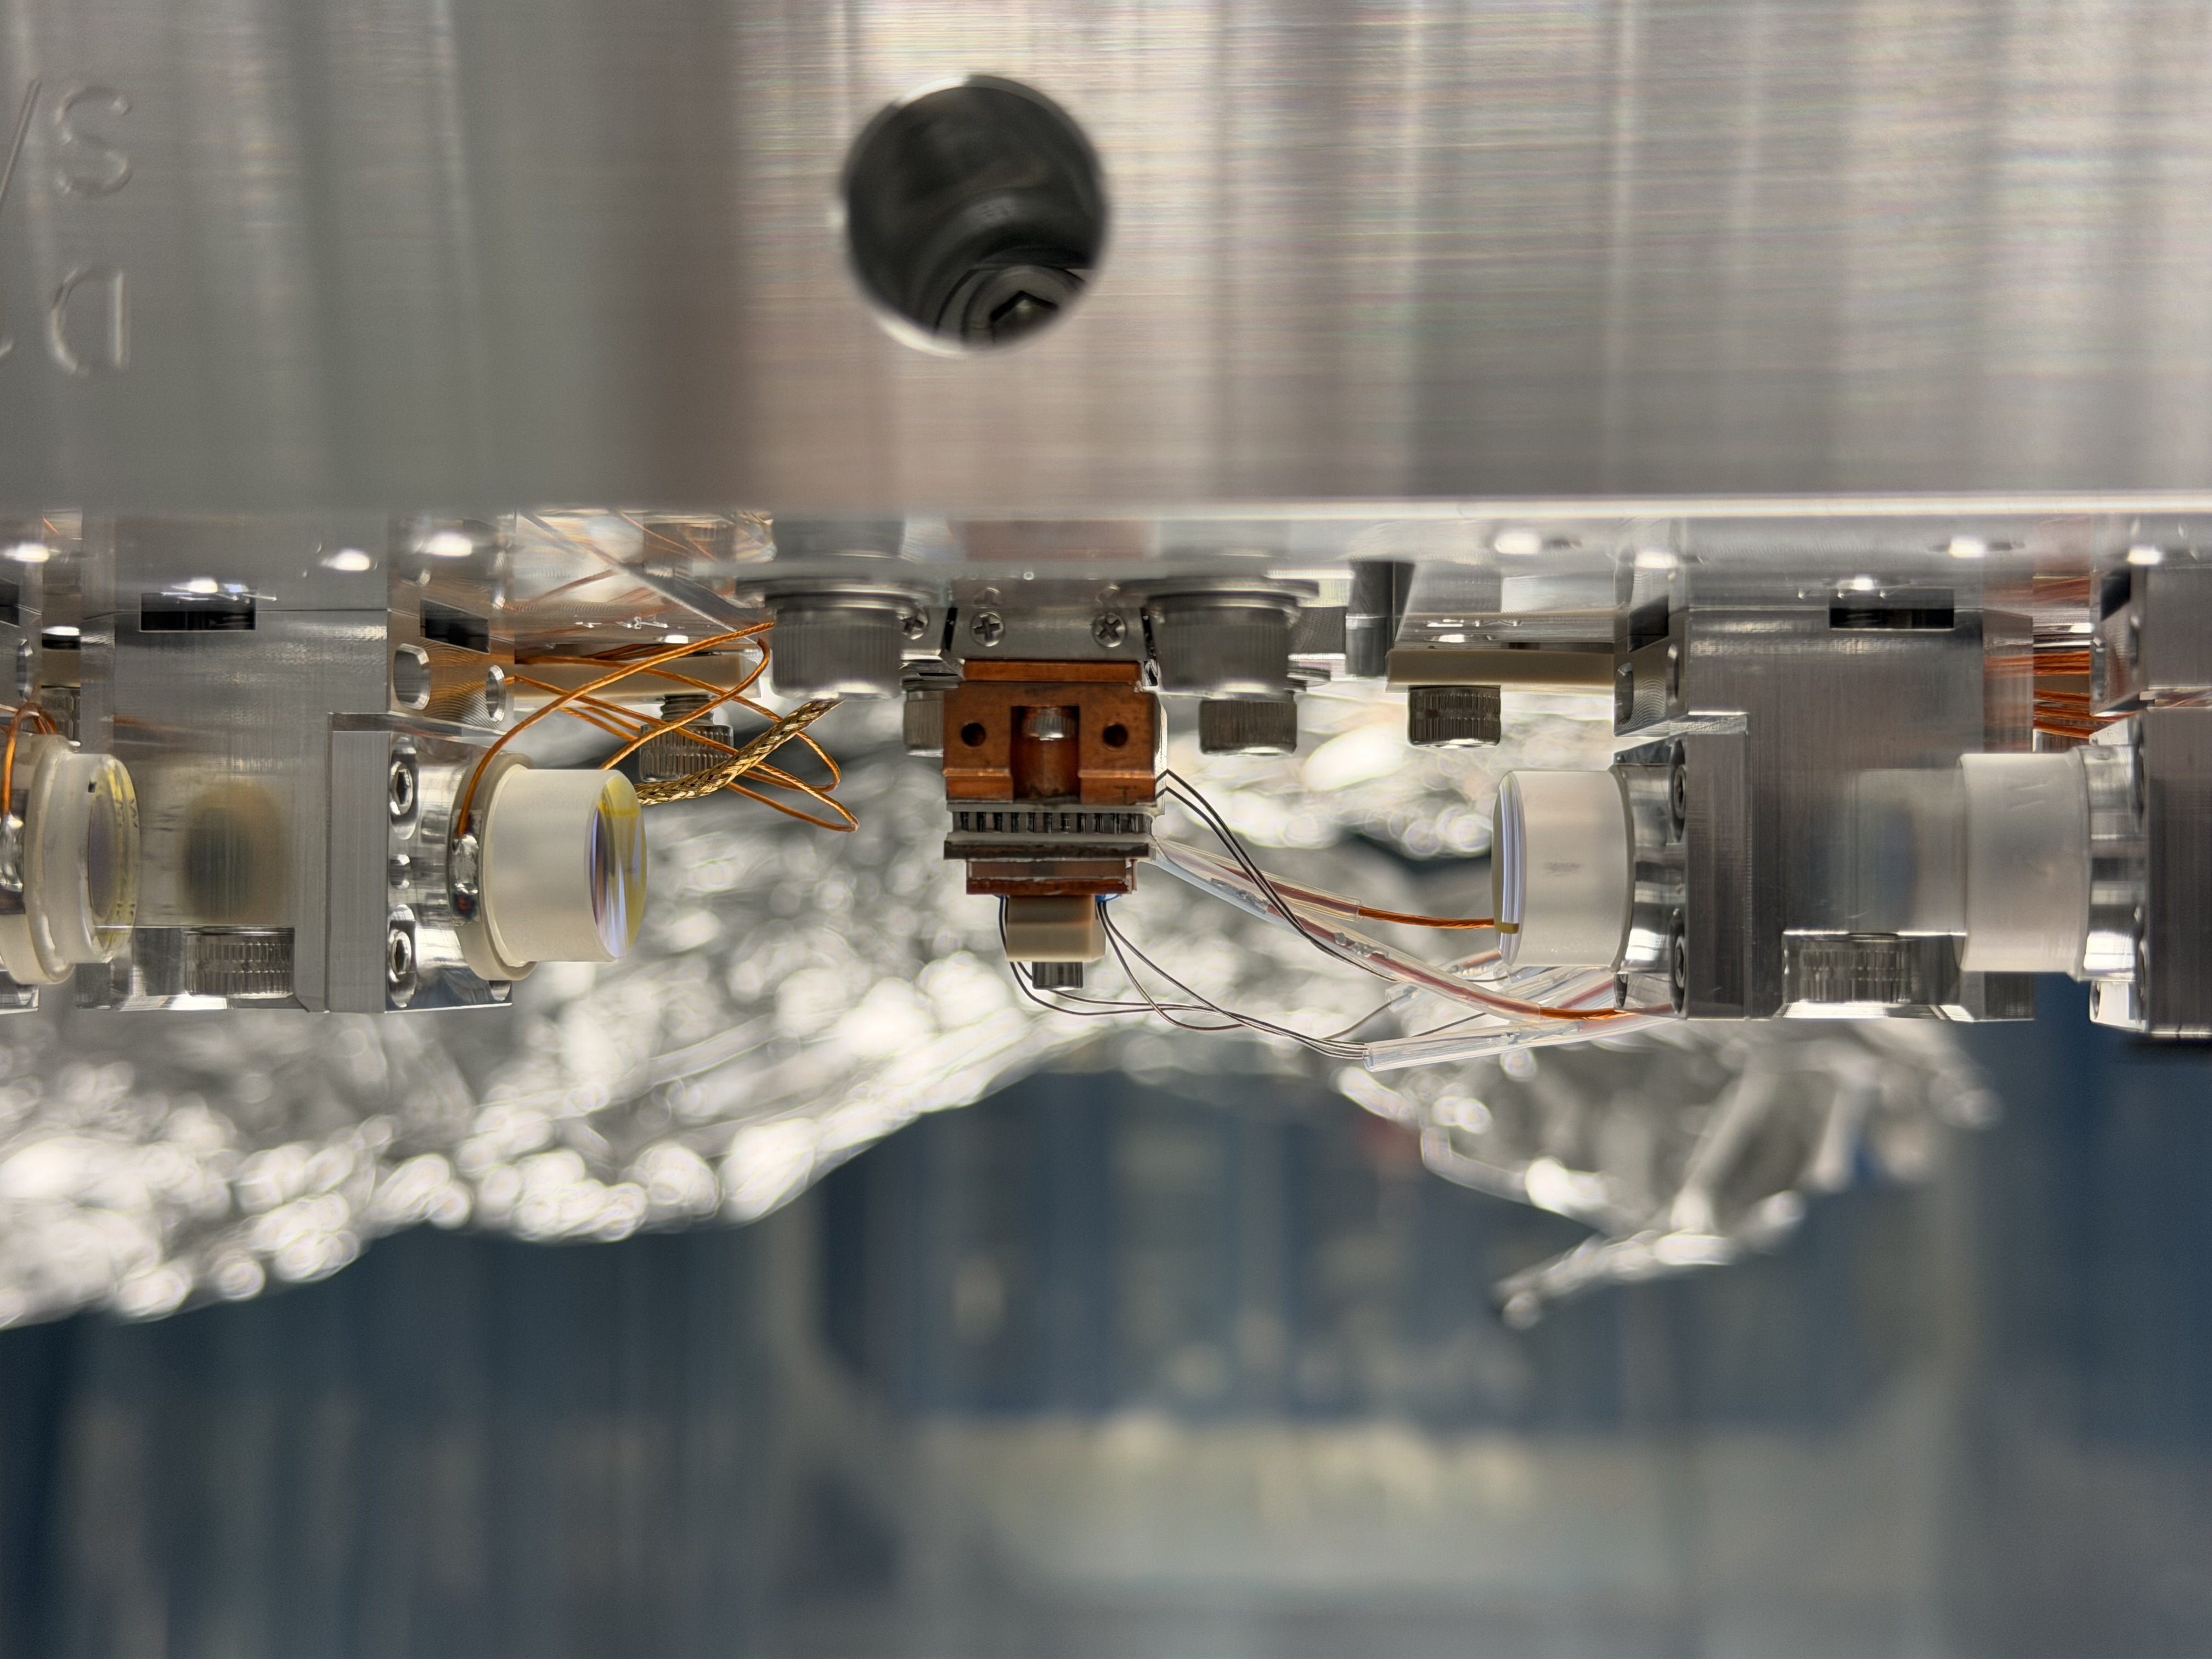
EPO-Tagging for cool photos of OPO.
We believe that the loose M3 mirror might explain several of the issues seen with this OPO during O4:
https://services1.ligo-la.caltech.edu/FRS/show_bug.cgi?id=30440
The mirror coming loose likely moved the cavity axis and both misaligned the crystal and miscentered the beam on the M4 PZT mirror. This might explain why the cavity alignment would change whenever the crystal was moved or when the M4 PZT was scanned.
TITLE: 12/04 Day Shift: 1530-0030 UTC (0730-1630 PST), all times posted in UTC
STATE of H1: Planned Engineering
INCOMING OPERATOR: None
SHIFT SUMMARY:
After CDS & H1-Locking work of yesterday, today we transitioned to starting prep work for the upcoming vent of HAM7.
However, there was more CDS work today which was related to ISC Slow Controls....but in the middle of this...
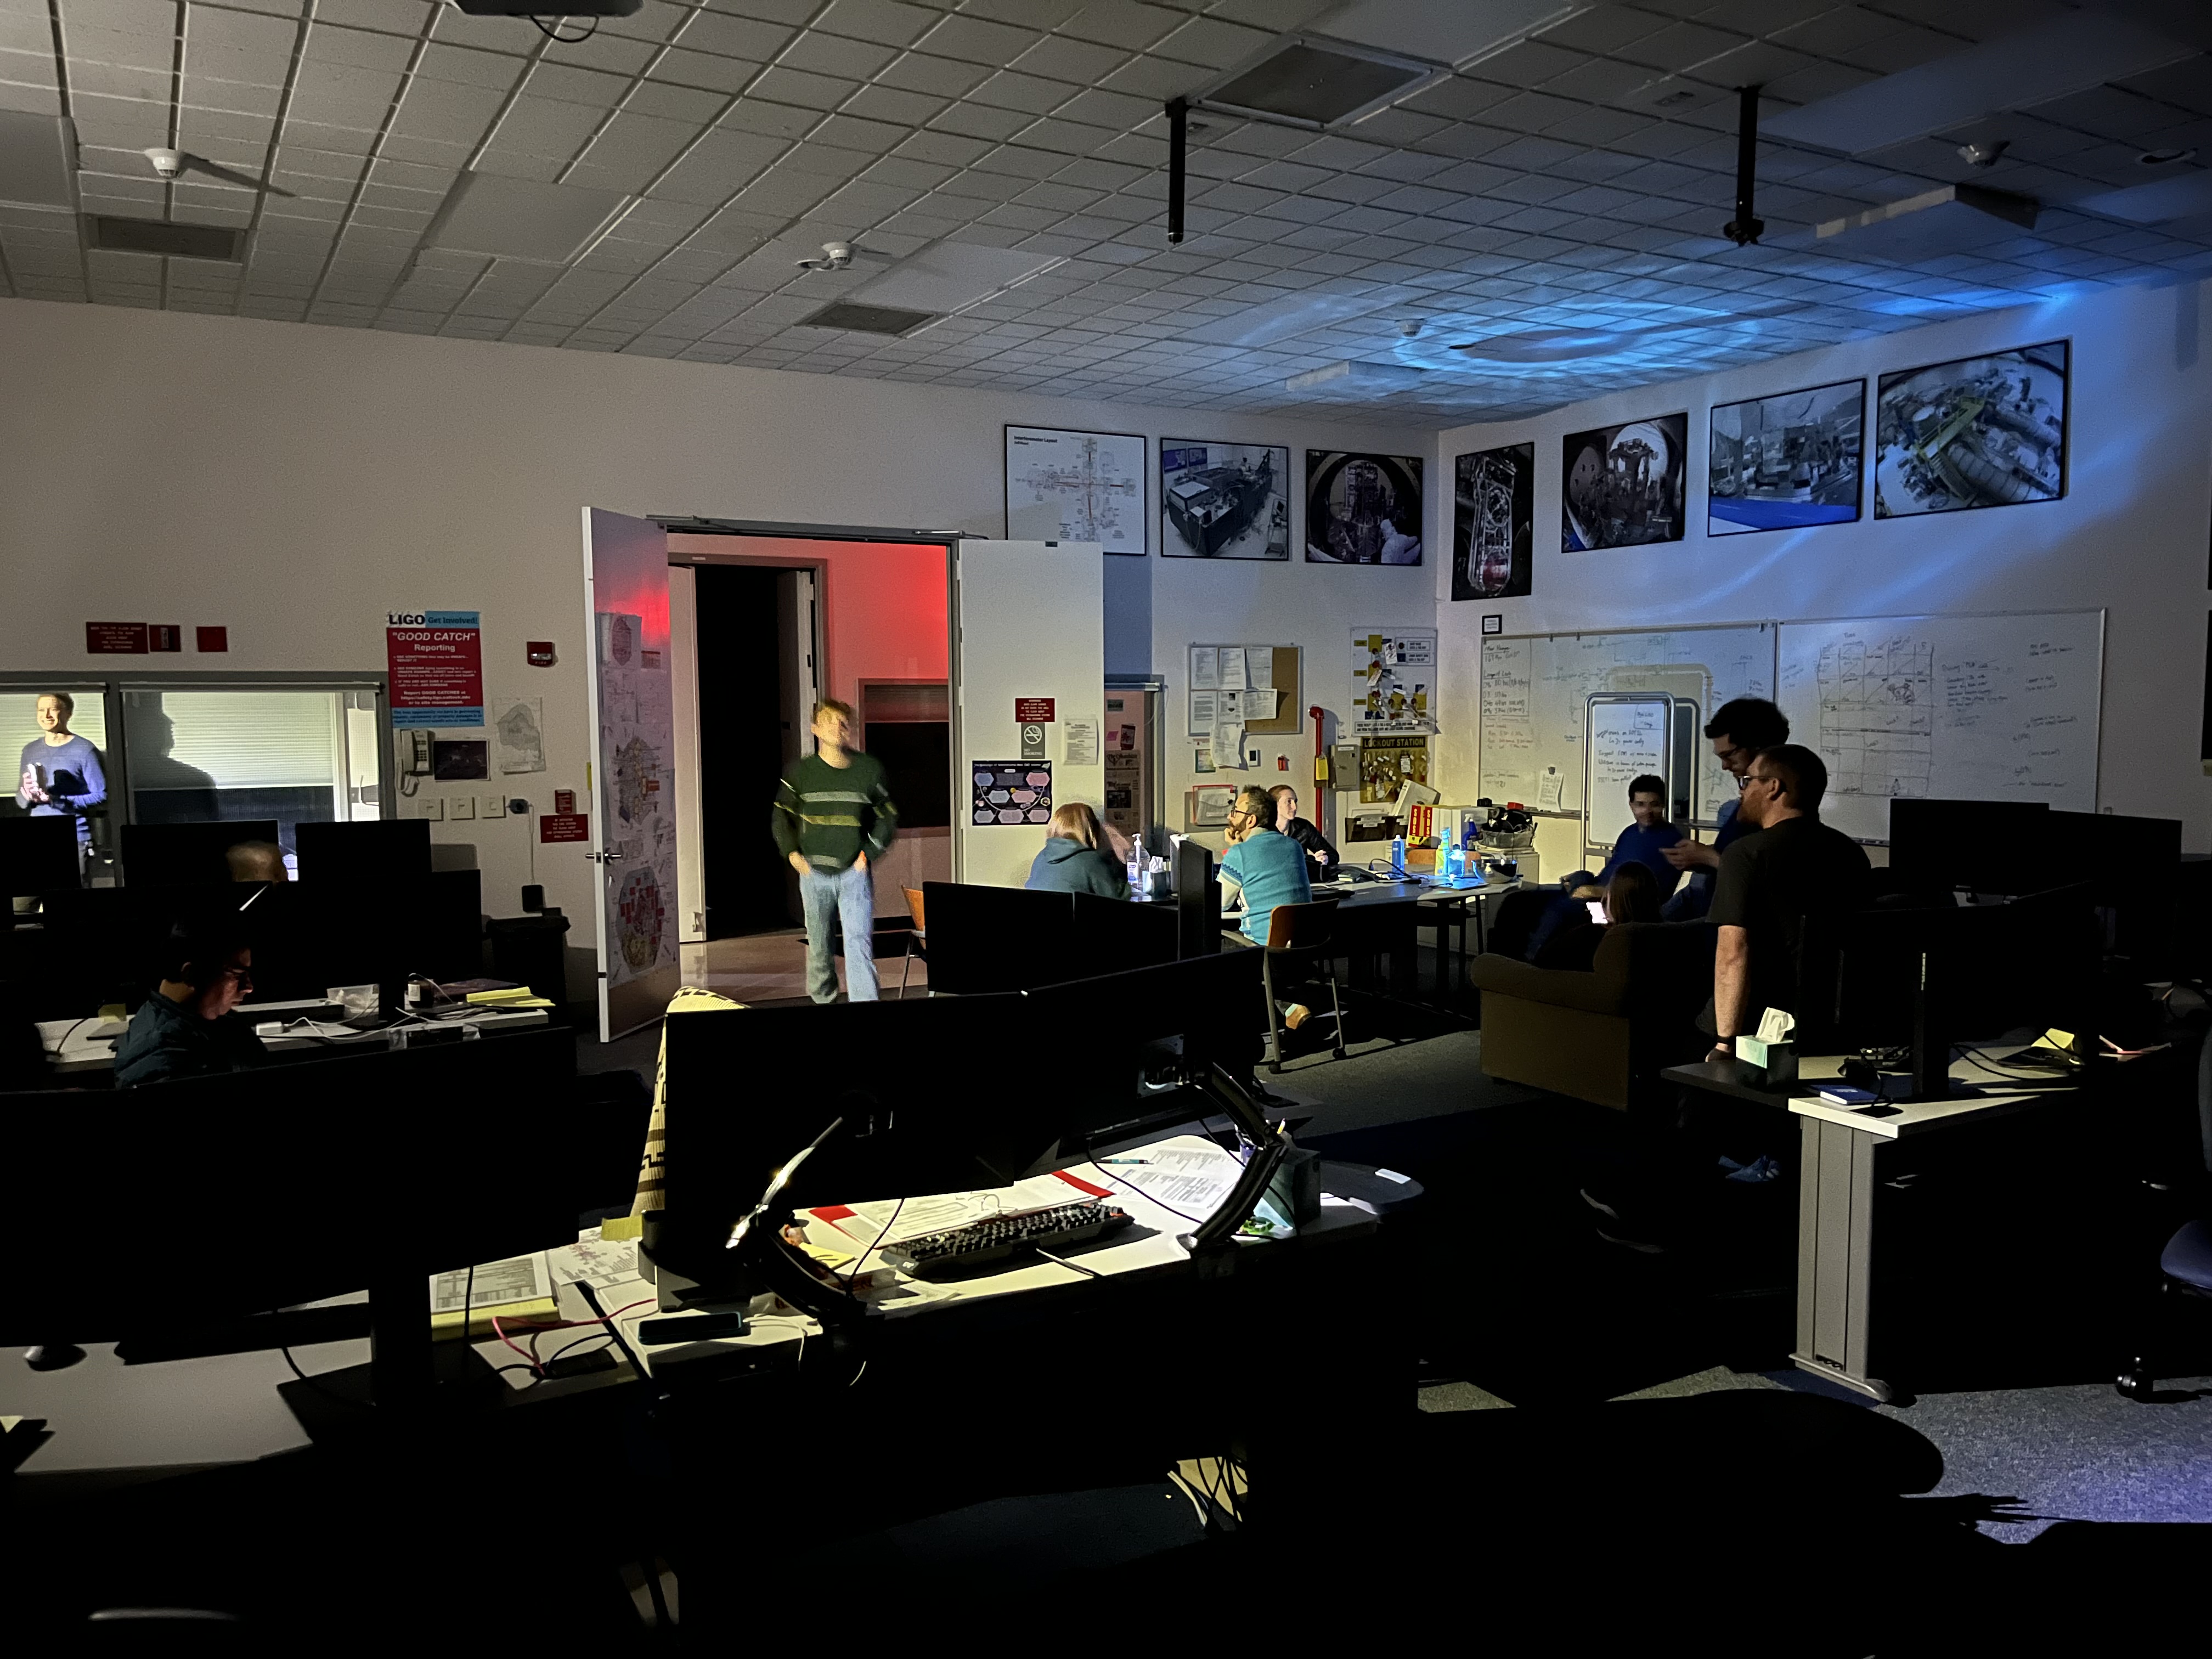
There was a 90min power outage on site!!
LOG:
Recovery milestones:
22:02 Power back-up
22:04 CDS / GC seeing what's on/functional, then bring infrastructure back up
22:10 VAC team starts Kebelco to support the ar pressure that's keeping the cornerstation gate valves for closing
22:13 Phones are back
22:17 LHO GC Internet's back
22:25 GC wifi back up, alog and CDS back up
22:40 RyanS, Jason, Patick got PSL beckoff back up
22:55 VAC in LVEA/FCES back up
22:57 CDS back up (only controls)
23:27 PSL computer back
00:14 Safety interlock is back
00:14 HV and ALSY on at EY
00:35 opslogin0 back up
00:37 CS HV back up
00:53 CS HEPI pump station controller back up
01:05 CO2X and CO2Y back up
01:10 HV and ALSY on at EY
01:22 PSL is alive
Note: EY 24MHz oscillator had to be power cycled to resync
Casualties:
- lost ADC on seiH16
- 18V power supply failure at EY in SUS rack
Log:
| Start Time | System | Name | Location | Lazer_Haz | Task | Time End |
|---|---|---|---|---|---|---|
| 22:32 | VAC | Gerardo | MX, EX, MY, EY | n | Bringing back VAC computers | 23:41 |
| 23:32 | VAC | Jordan | LVEA, FCES | n | Bringing back VAC computers | 22:55 |
| 22:54 | PSL | RyanS, Jason | LVEA | n | Turning PSL chiller back on | 23:27 |
| 23:03 | VAC | Jordan | LVEA | n | Checking out VAC computer | 23:41 |
| 23:56 | SAF | Richard | EY | n | Looking at safety system | 00:25 |
| 00:02 | JAC | Jennie | JOAT, OpticsLab | n | Putting components on table | 01:24 |
| 00:19 | SAF | TJ | EX | n | Turning on HV and ALSX | 00:49 |
| 00:38 | TCS | RyanC | LVEA | n | Turning CO2 lasers back on | 01:06 |
| 01:03 | EE | Marc | CER | n | Power cycling io chassis | 01:14 |
| 01:06 | PSL | RyanS, Jason | LVEA | n | Checking makeup air for PSL | 01:10 |
| 01:07 | JAC | Jennie | LVEA | n | Grabbing parts | 01:14 |
| 01:08 | beckhoff | patrick | cr | - | BRSx recovery | 02:20 |
| 01:08 | sei | jim | EX.EY | - | HEPI pump station recovery | 01:58 |
| 01:25 | SEI | Patrick | EX | n | BRSX troubleshooting | 01:54 |
| 01:27 | EE | Marc | EX | n | Looking at RF sources | 02:09 |
| 02:00 | EE | Fil | EY | n | Power cycling SUSEY | 02:19 |
| 02:09 | VAC | Gerardo | MX | N | Troubleshooting VAC computer | 02:27 |
| 02:12 | EE | Marc | CER | N | Checking power supplies | 02:16 |
Since Oli's alog, I tried to keep a rough outline of the goings-on:
Marc and Fil went down to EY to replace the failed power supply, which brought life back to the EY frondends.
Dave noticed several models across site had timing errors, so he restarted them.
Gerardo continued to torubleshoot VAC computers at the mid-stations.
Once CDS boots were finished, I brought all suspension Guardians to either ALIGNED or MISALIGNED so that they're damped overnight.
I started to recover some of the Guardian nodes that didn't come up initially. When TJ started the Guardian service earlier, it took a very long time, but most of the nodes came up and he put them into good states for the night. The ones that didn't come up (still white on the GRD overview screen) I've been able to revive with a 'guardctrl restart' command, but I can only do a couple at a time or else the process times out. Even this way, the nodes take several minutes to come online. I got through many of the dead nodes, but I did not finish as I am very tired.
Main things still to do for recovery: (off the top of my head)
EPO-tagging for power outage
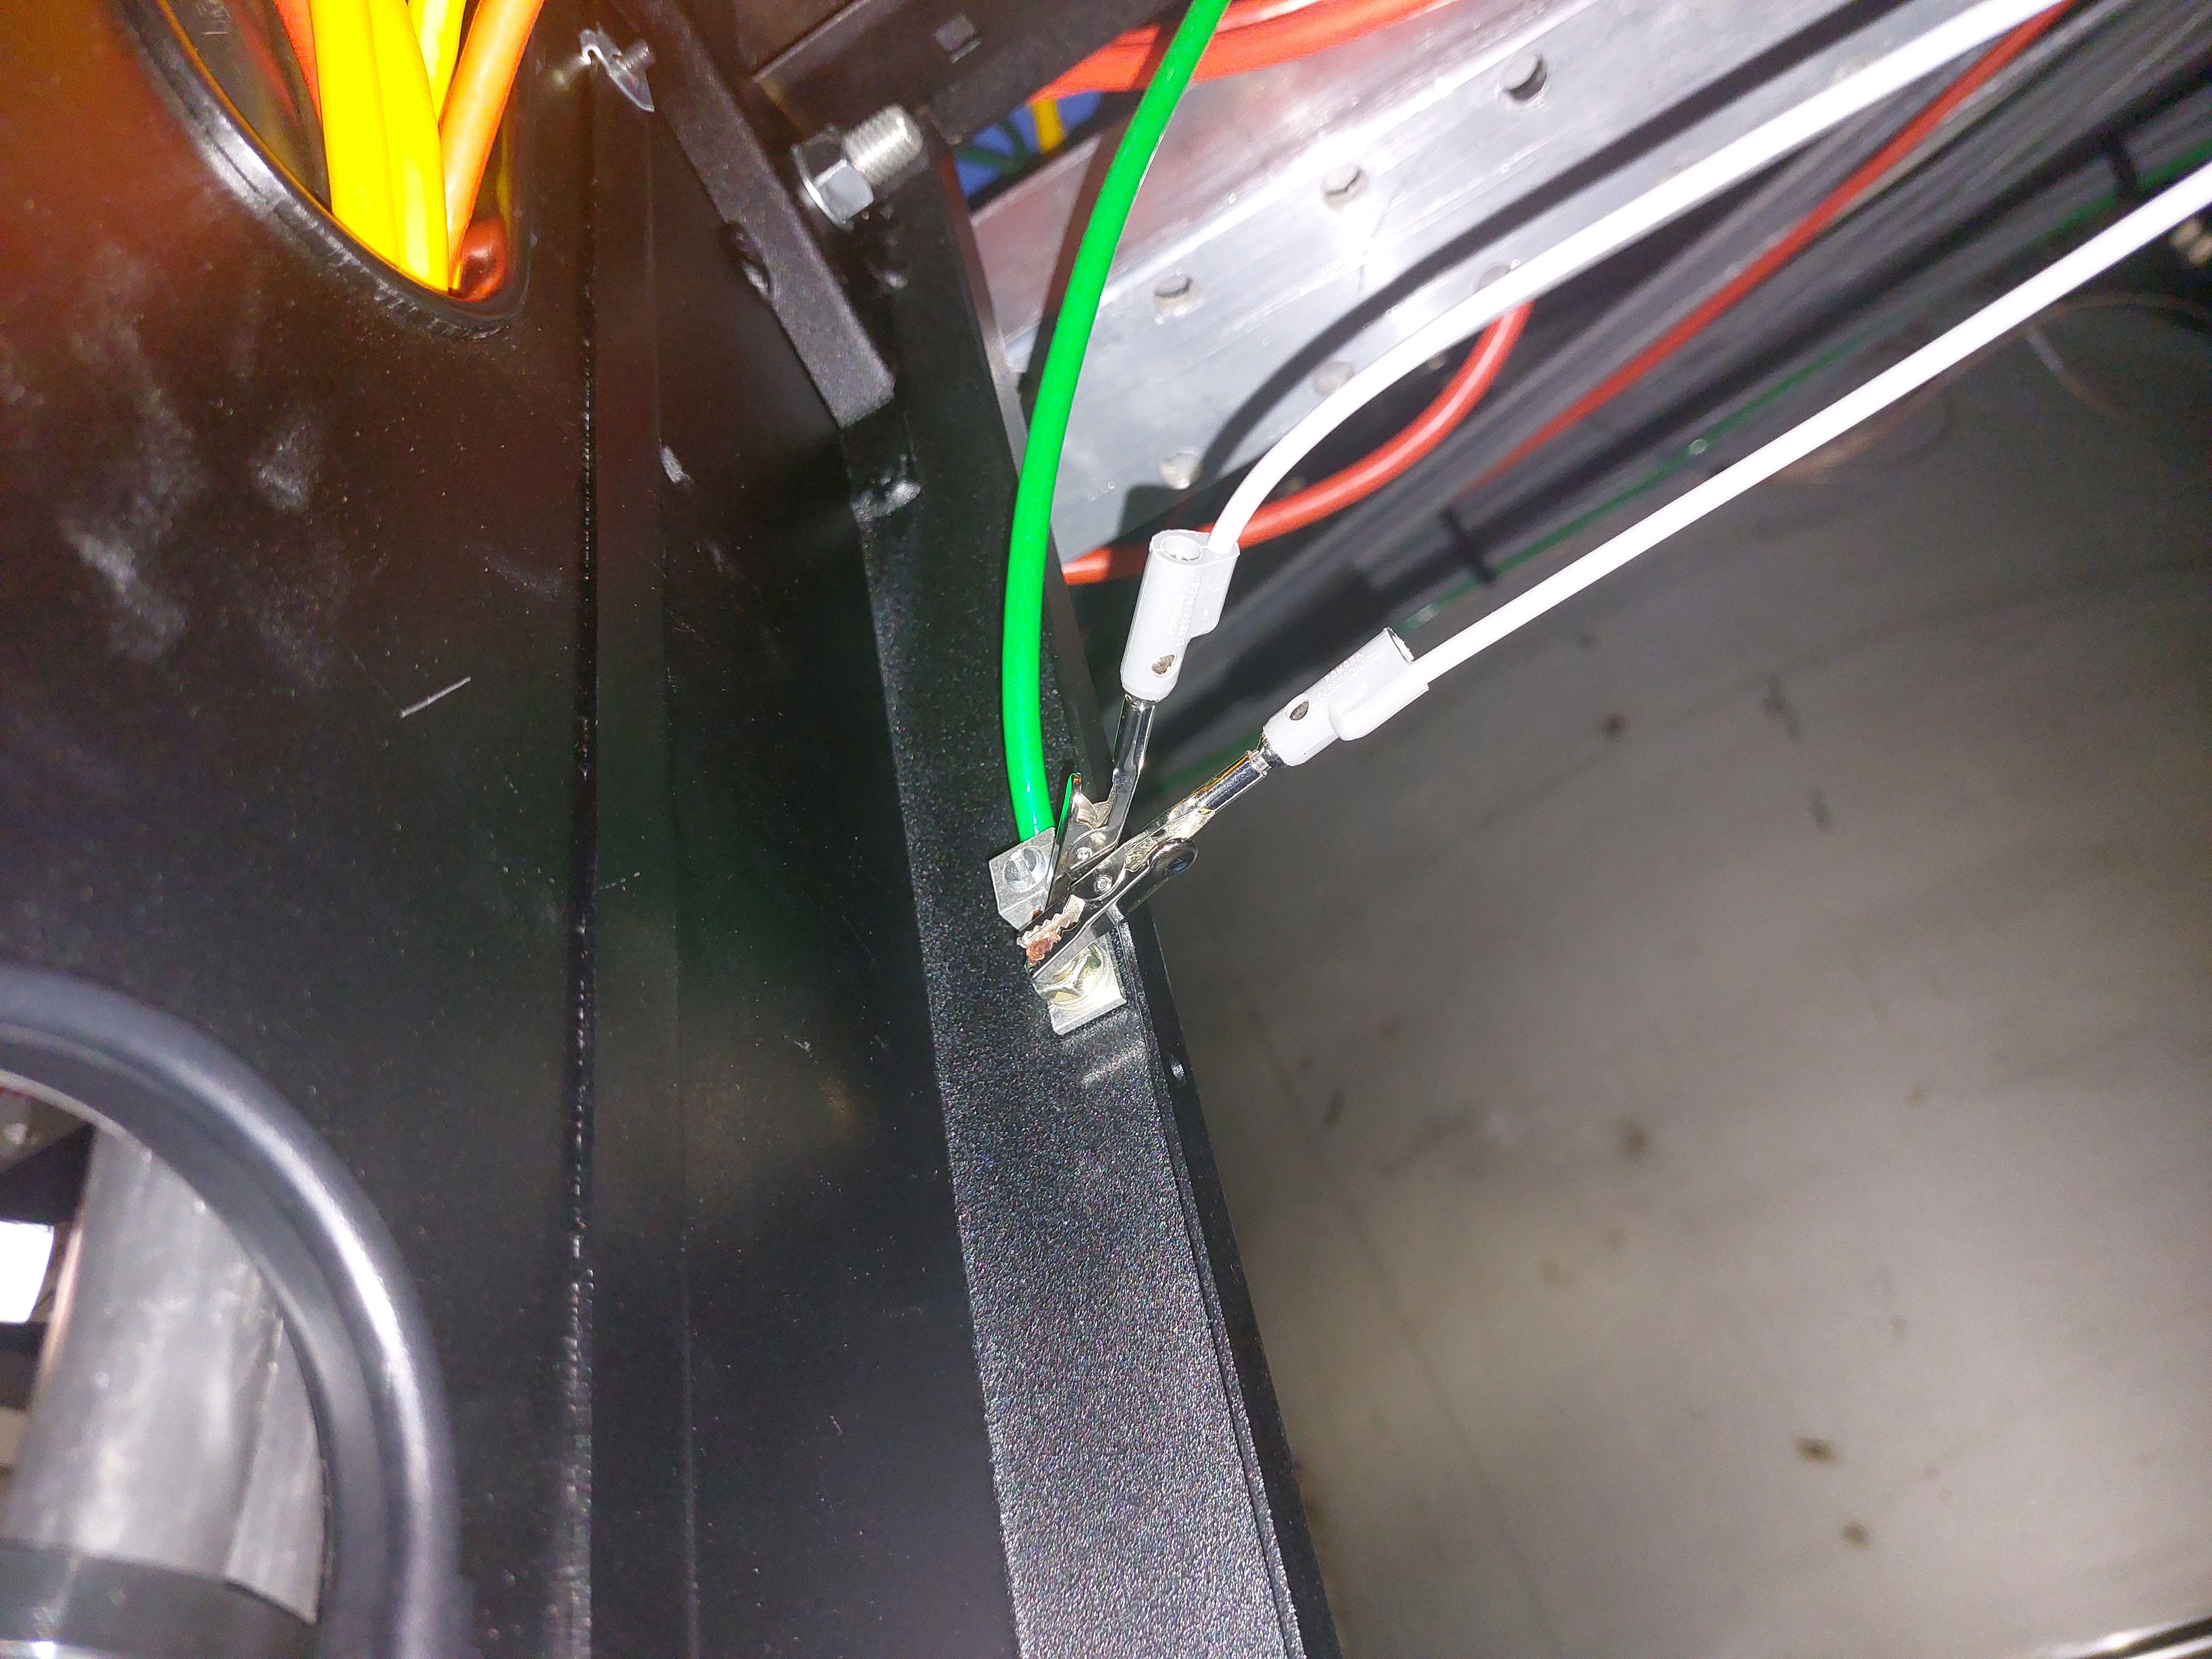
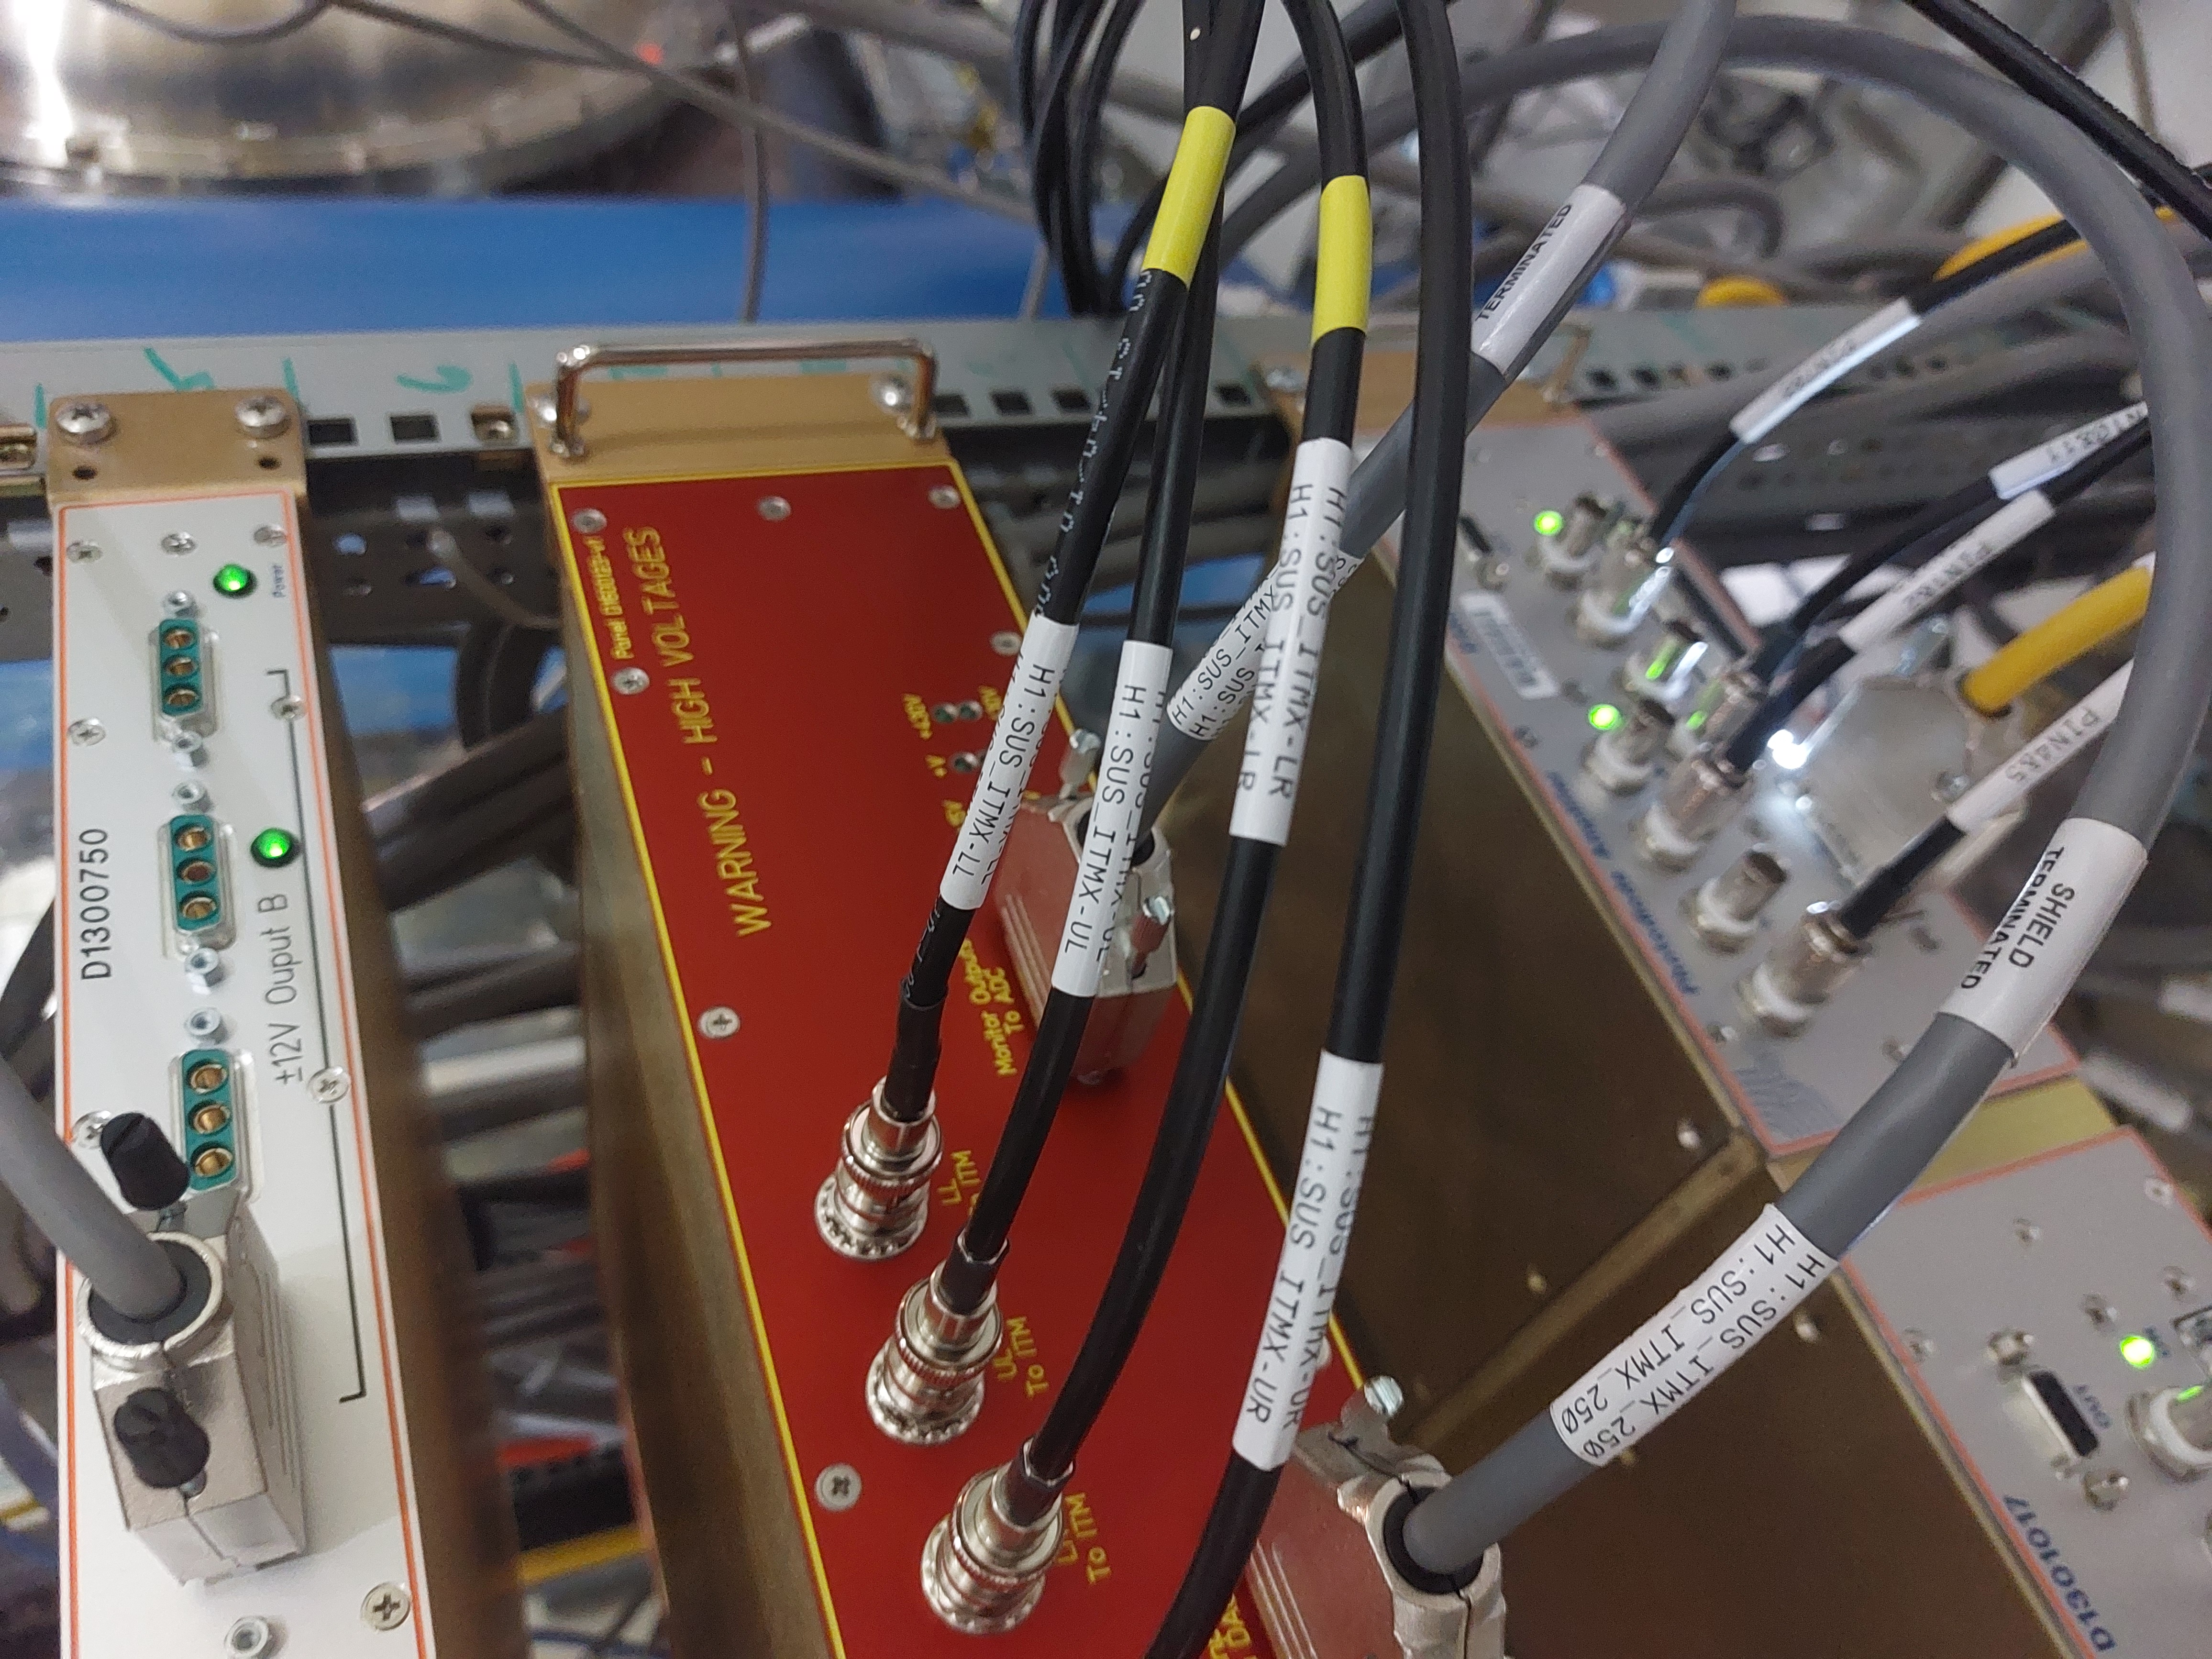
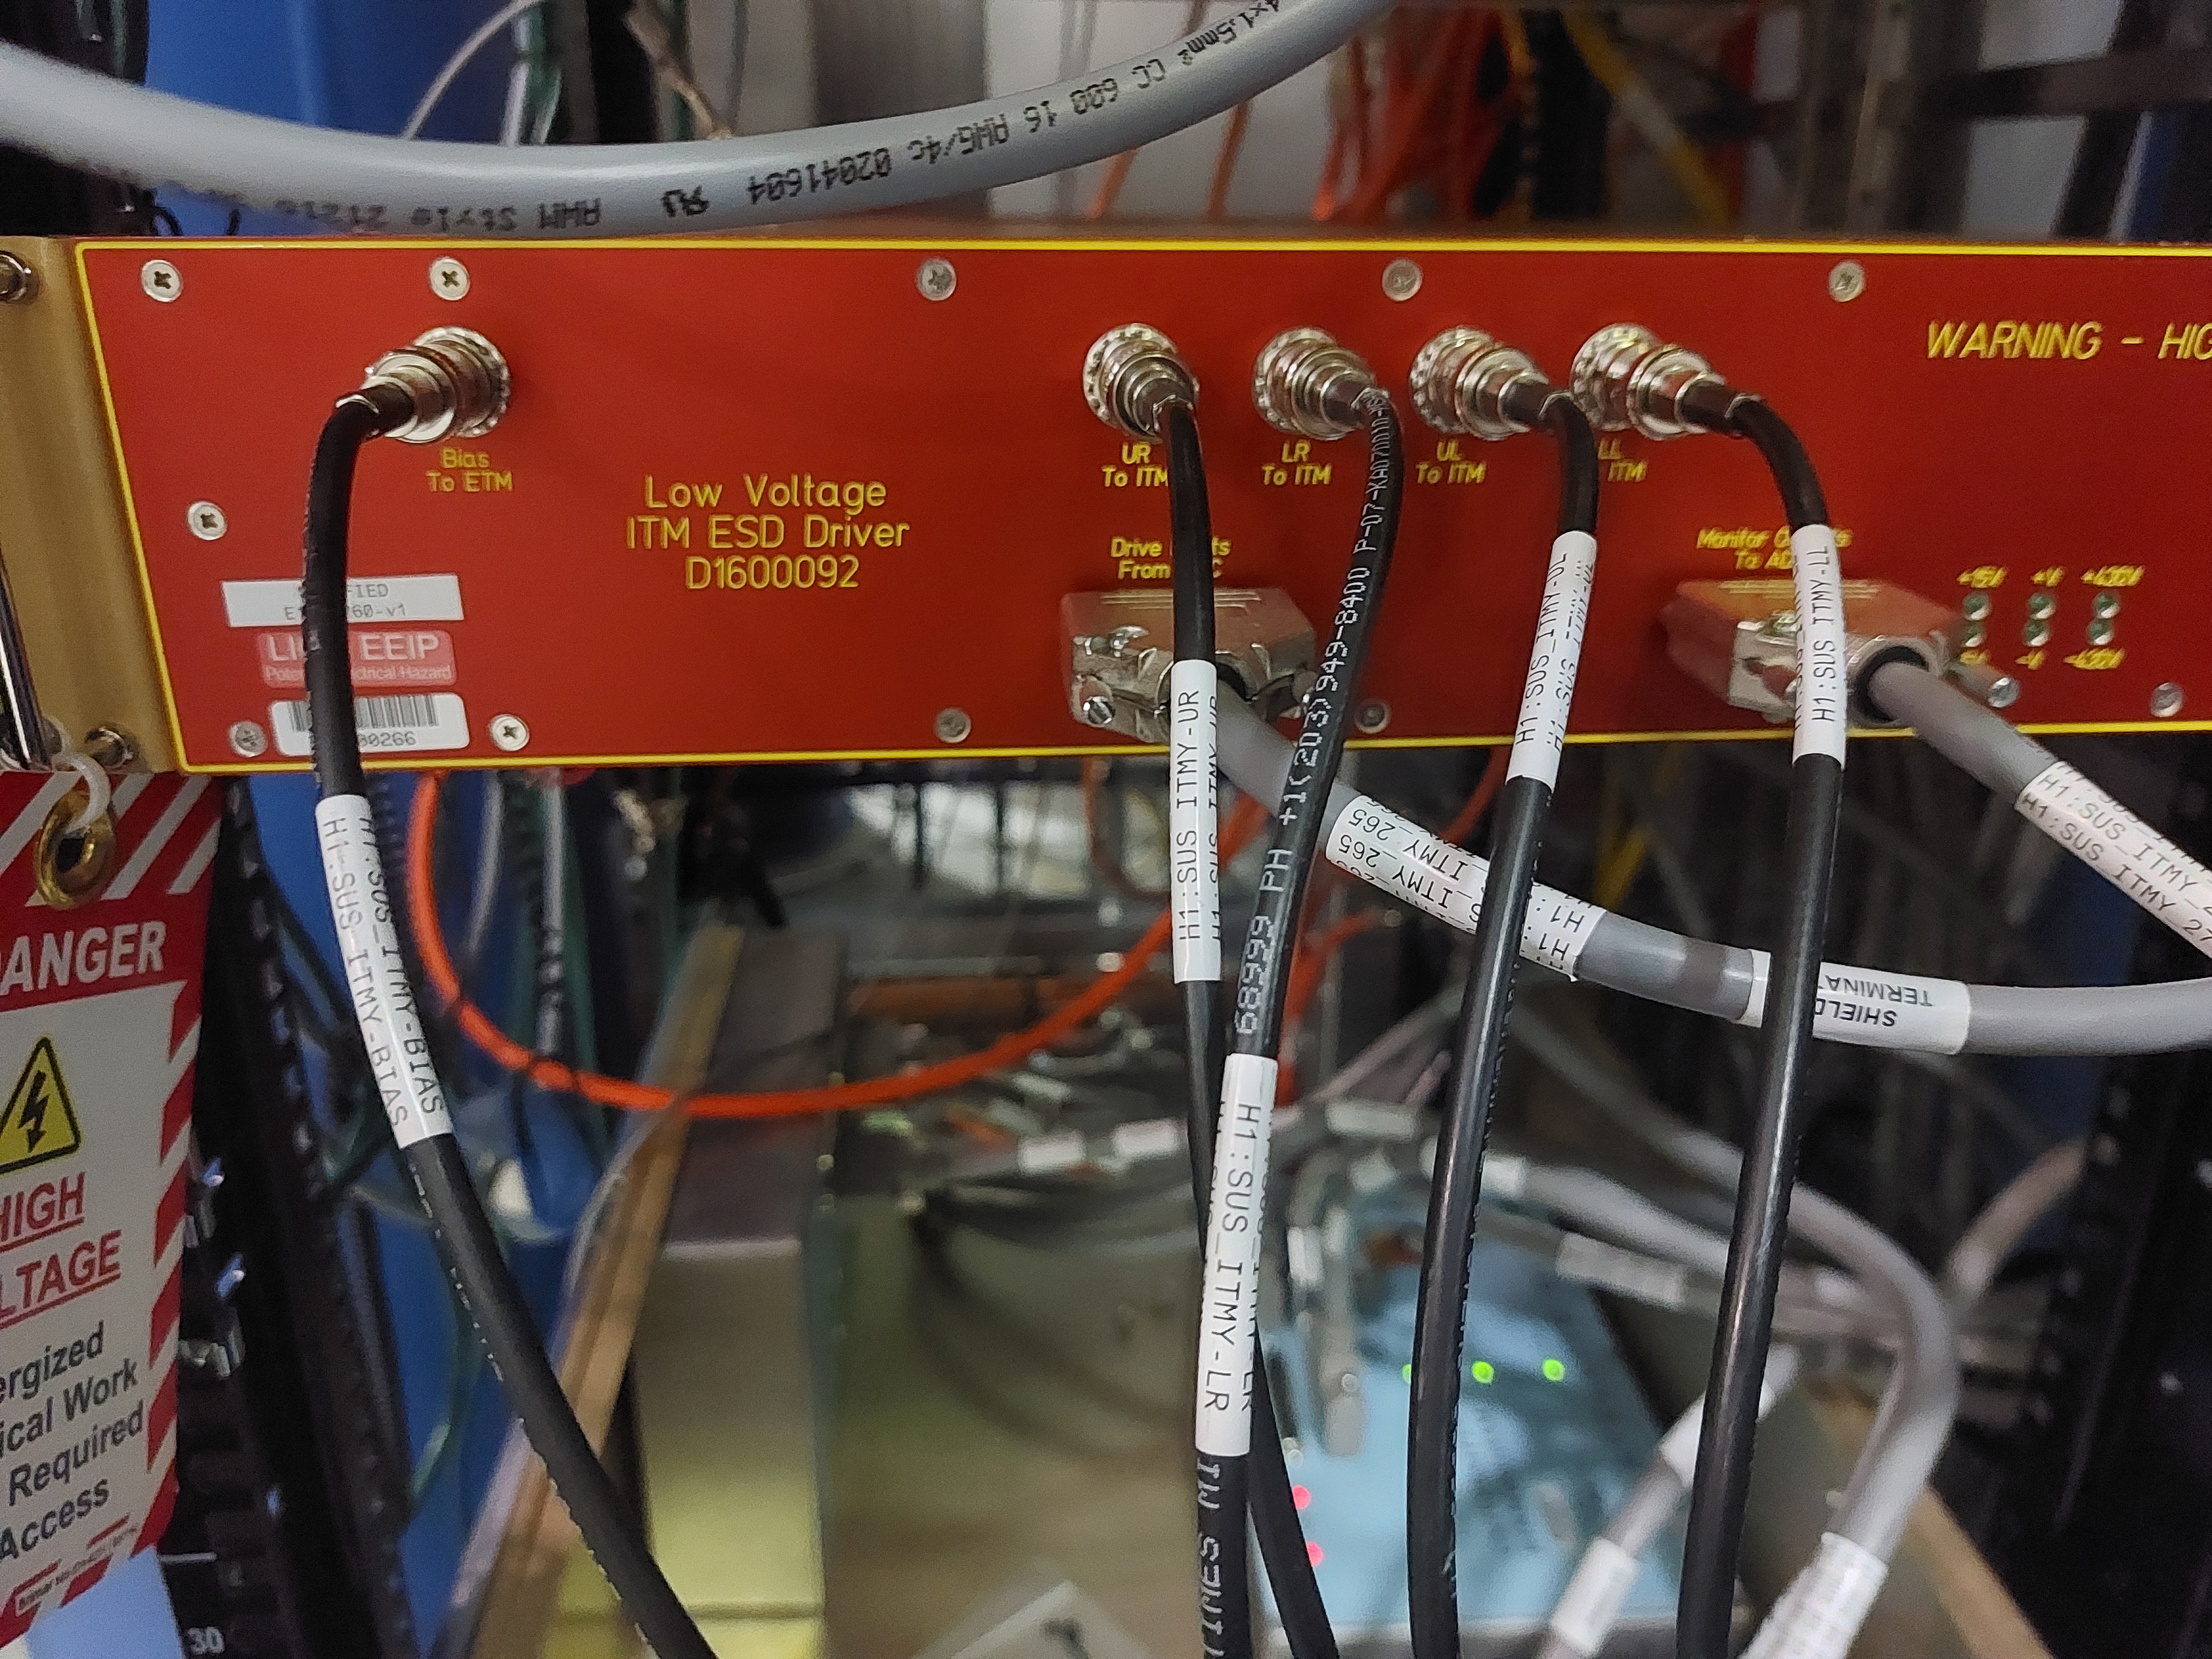
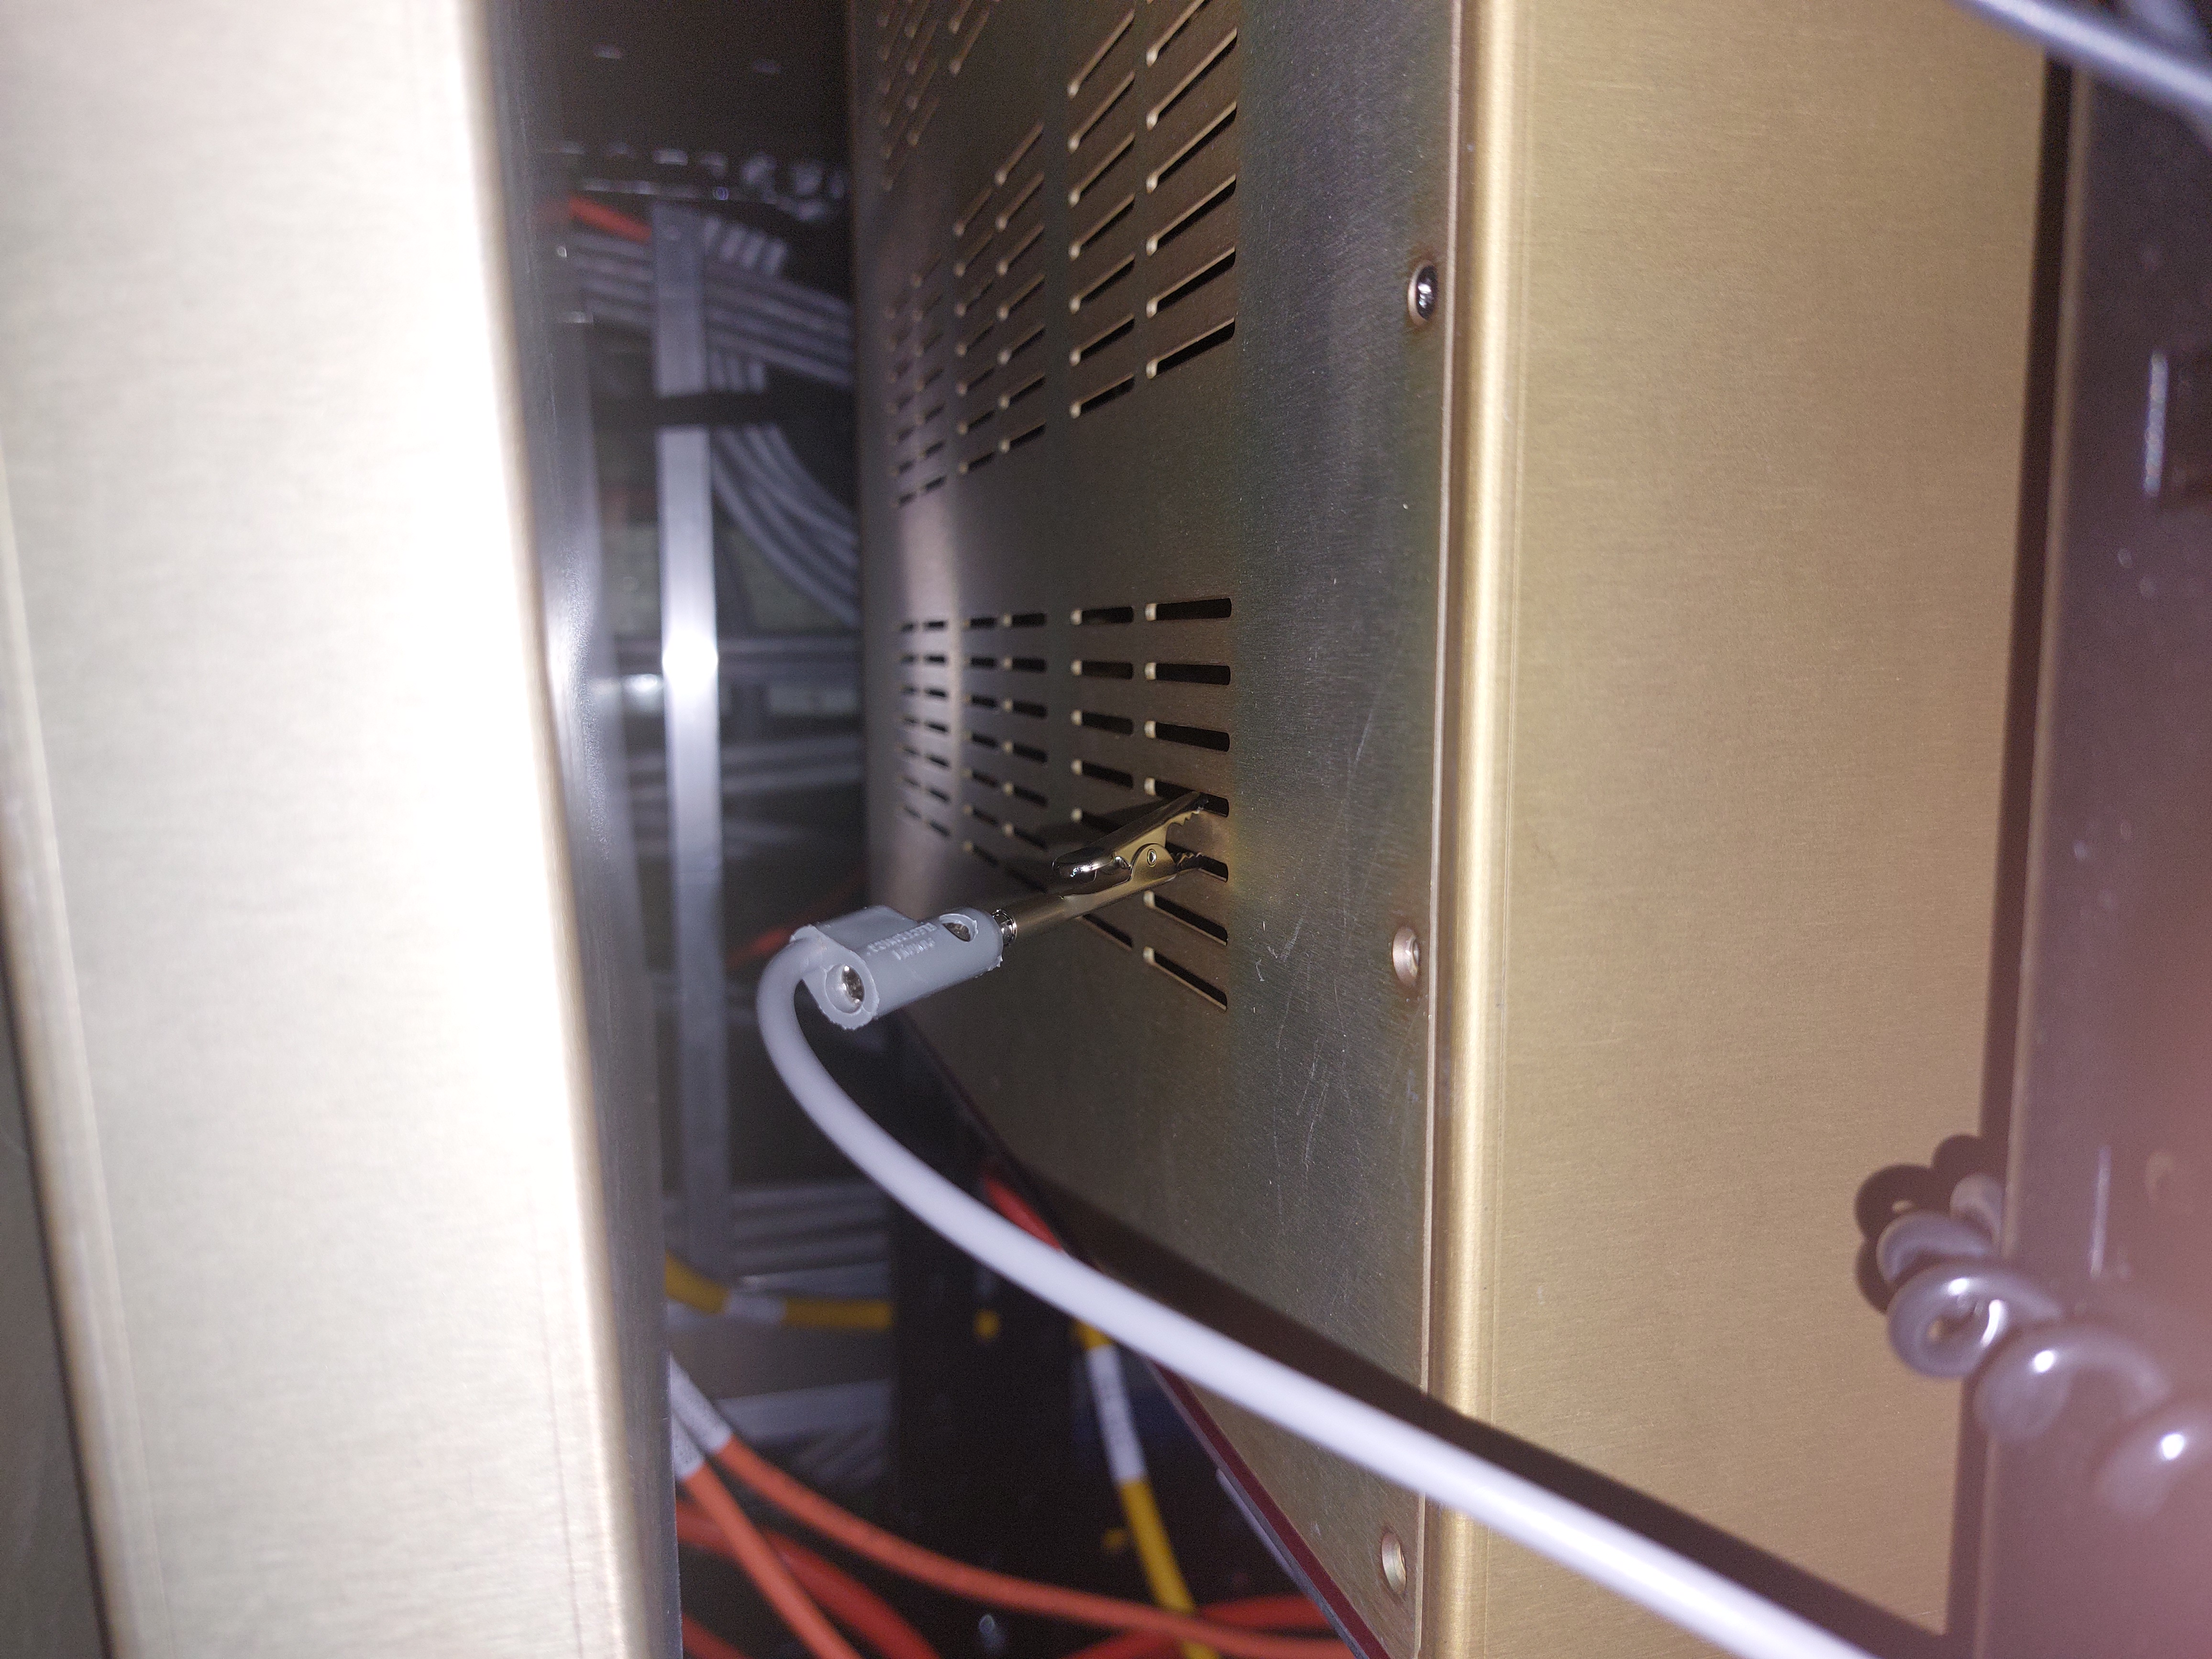
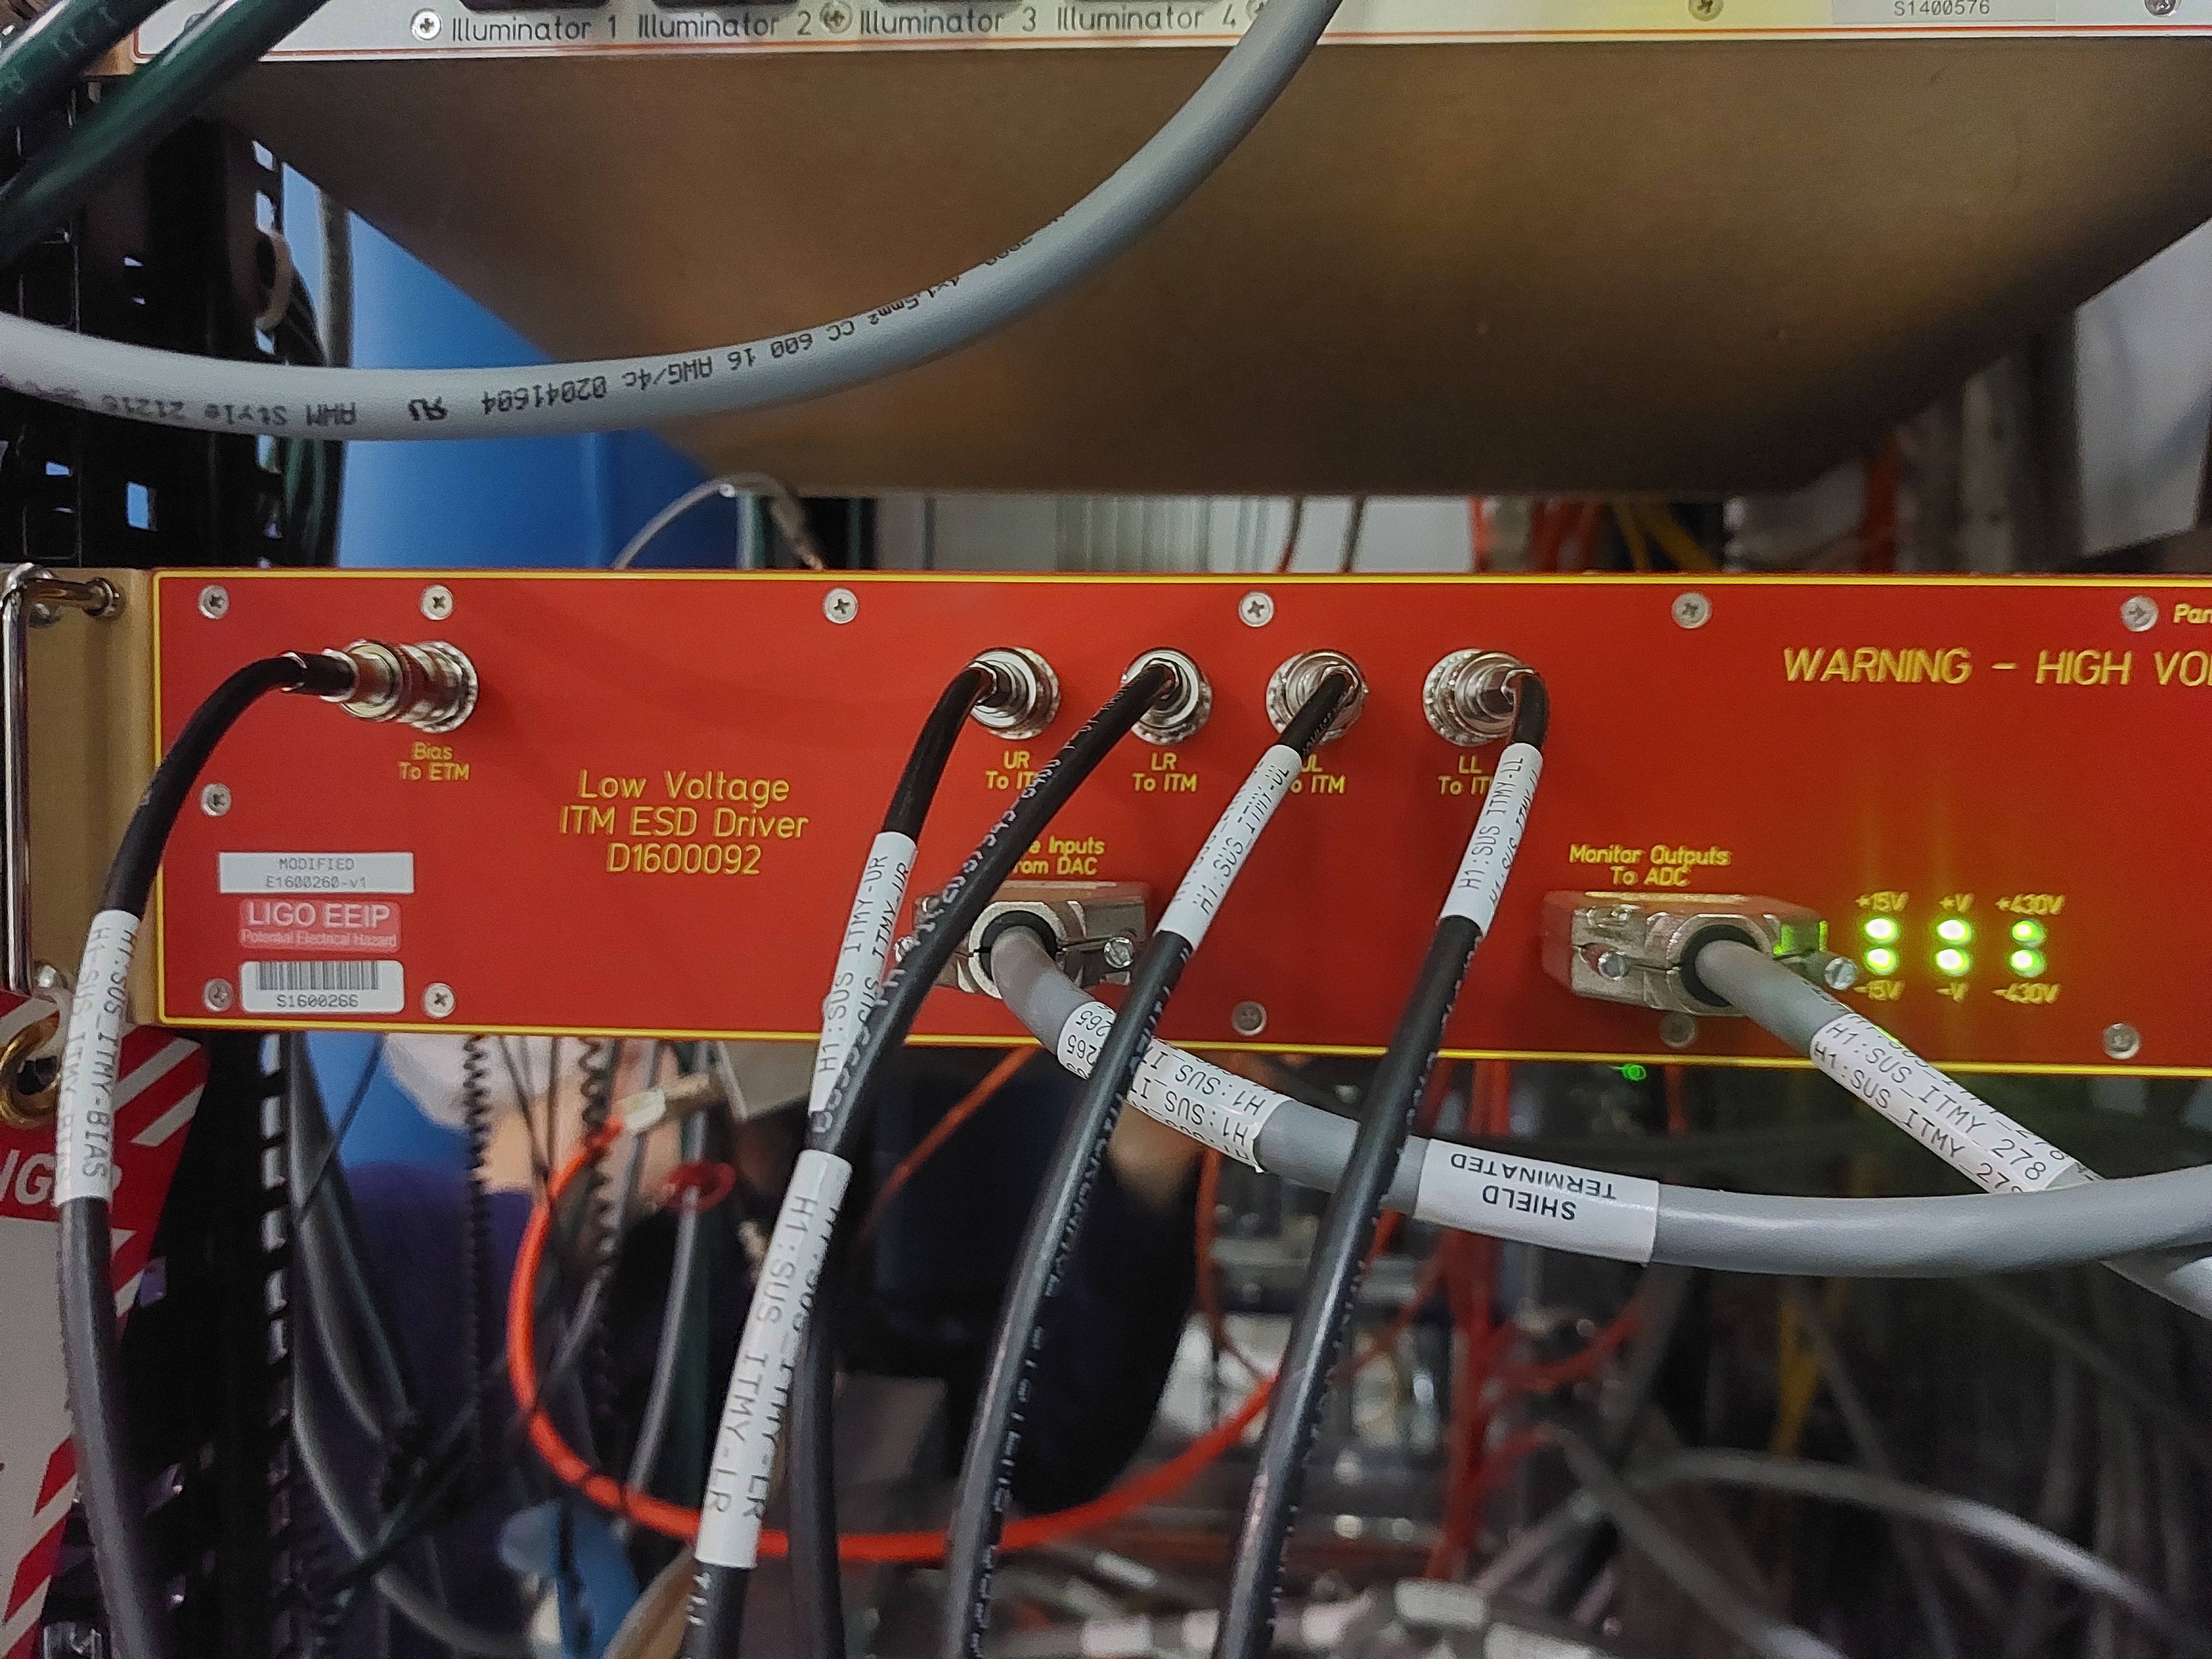
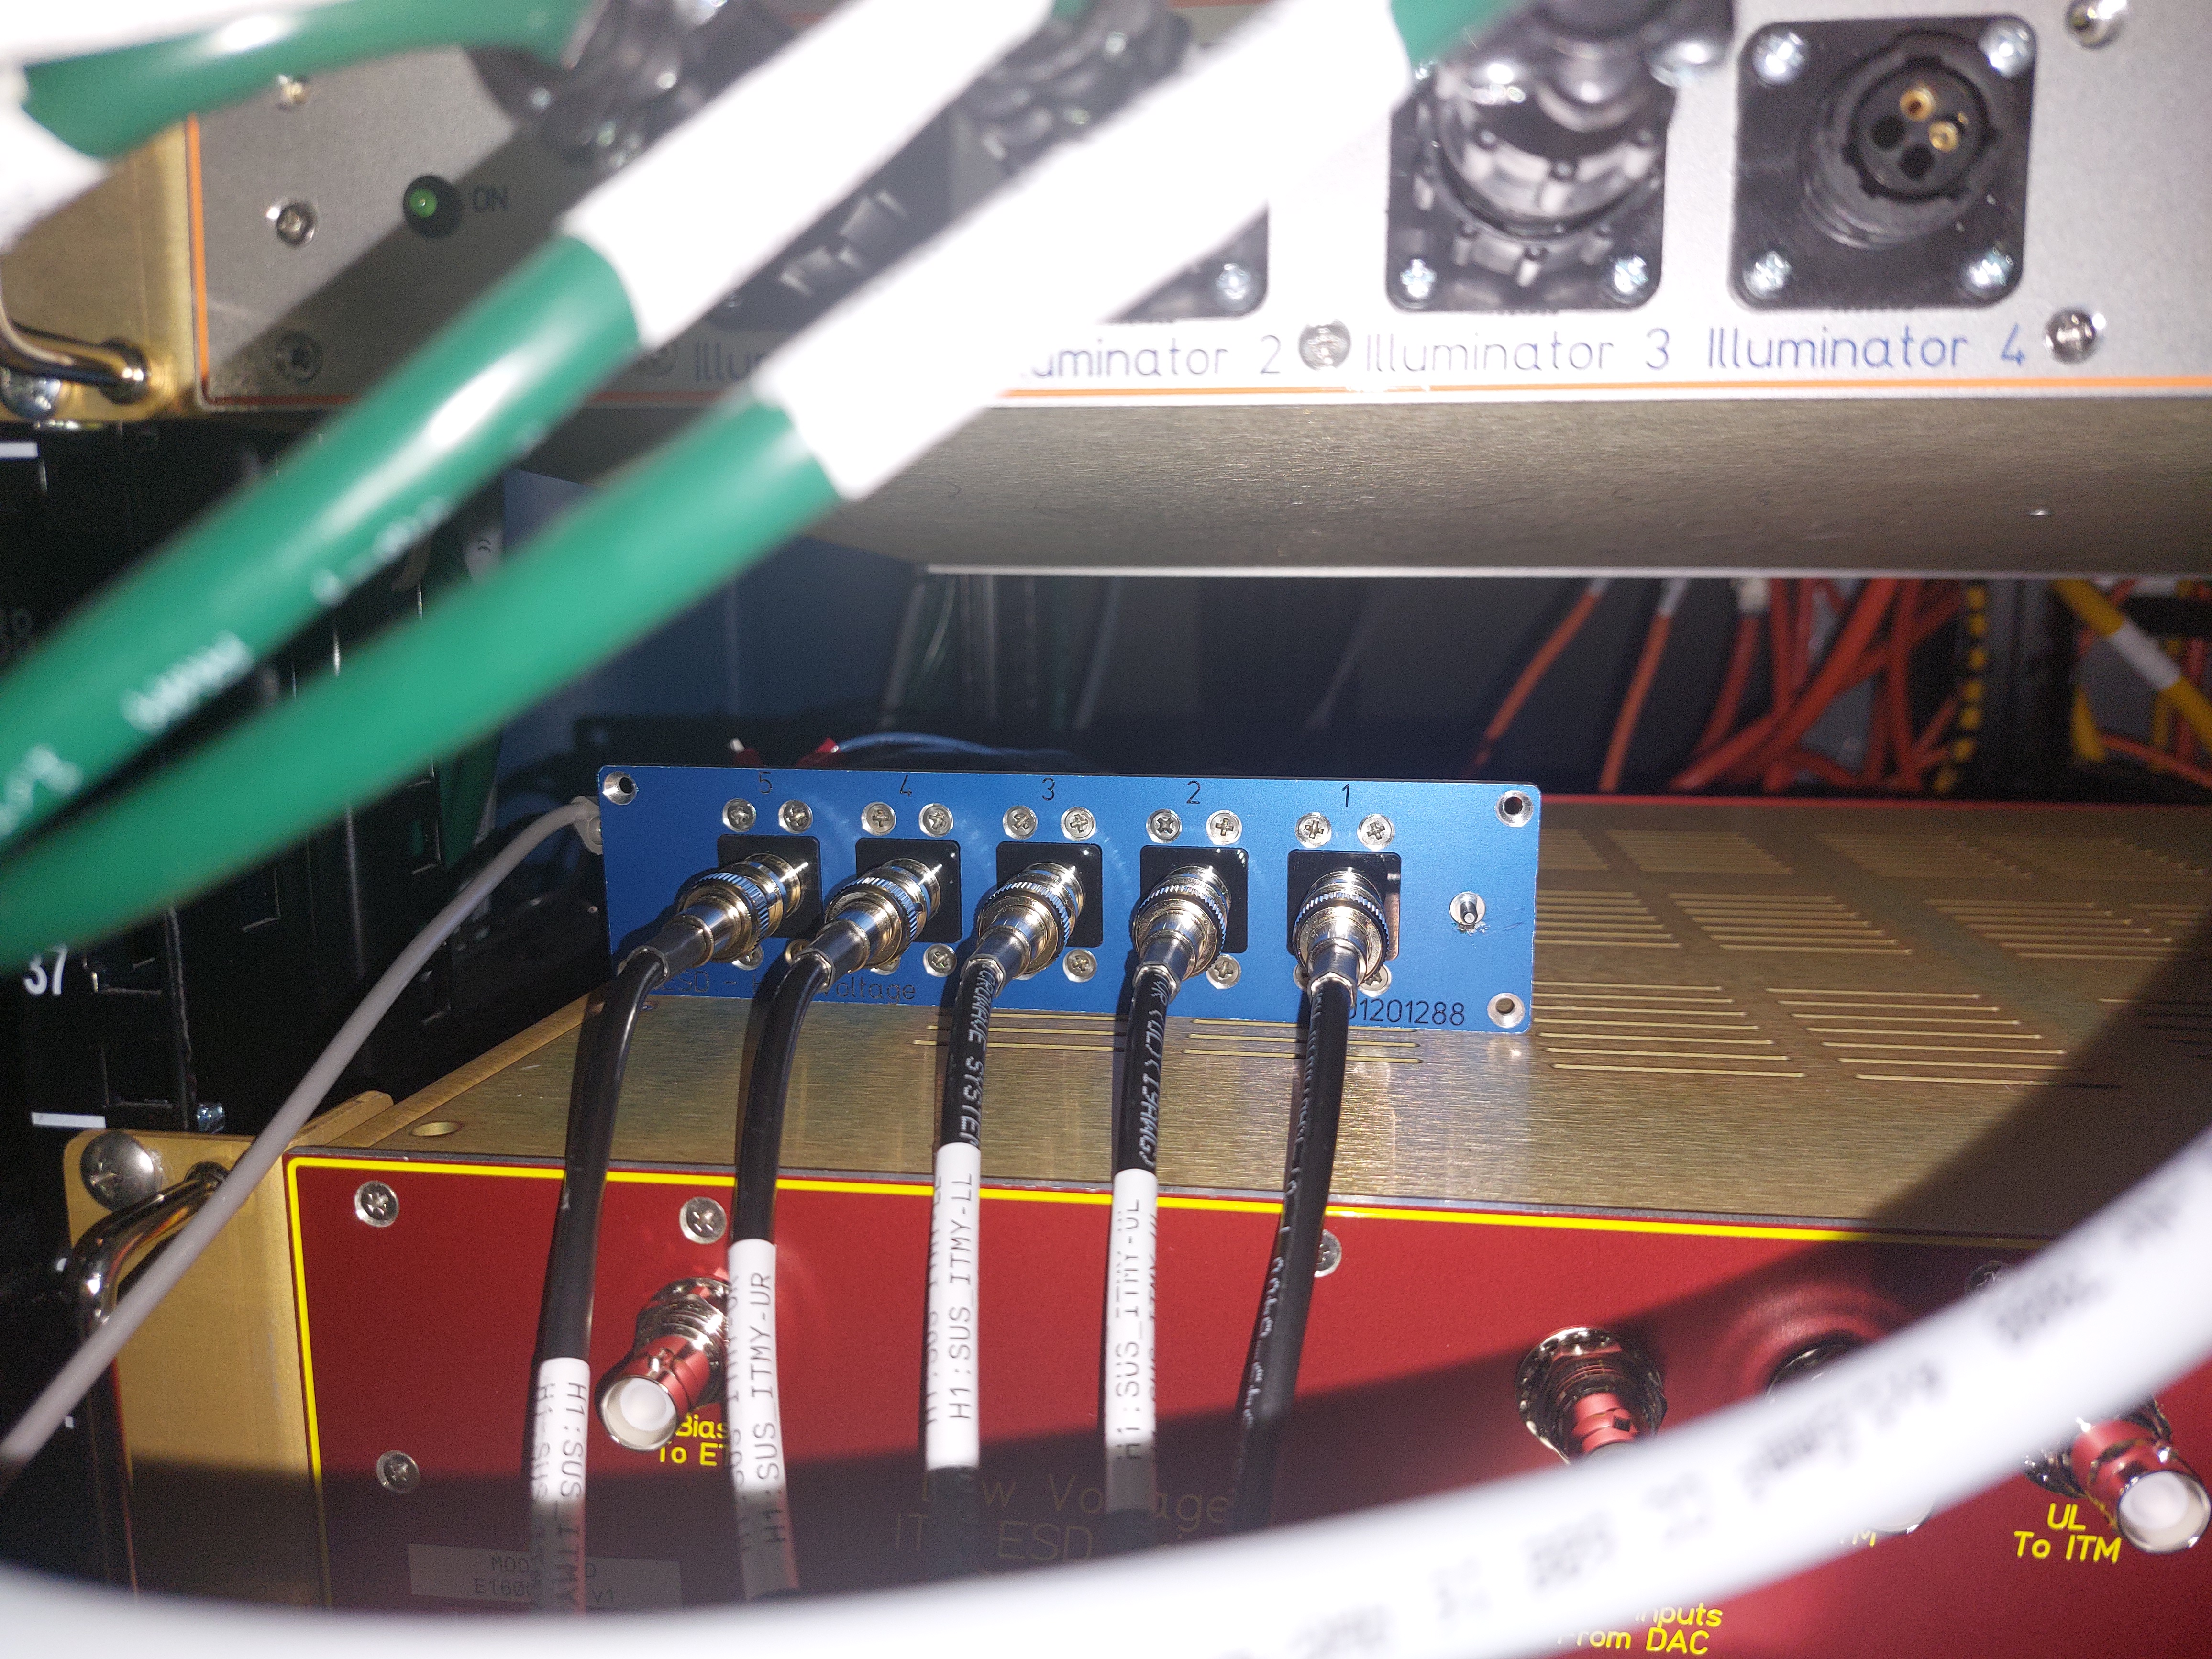
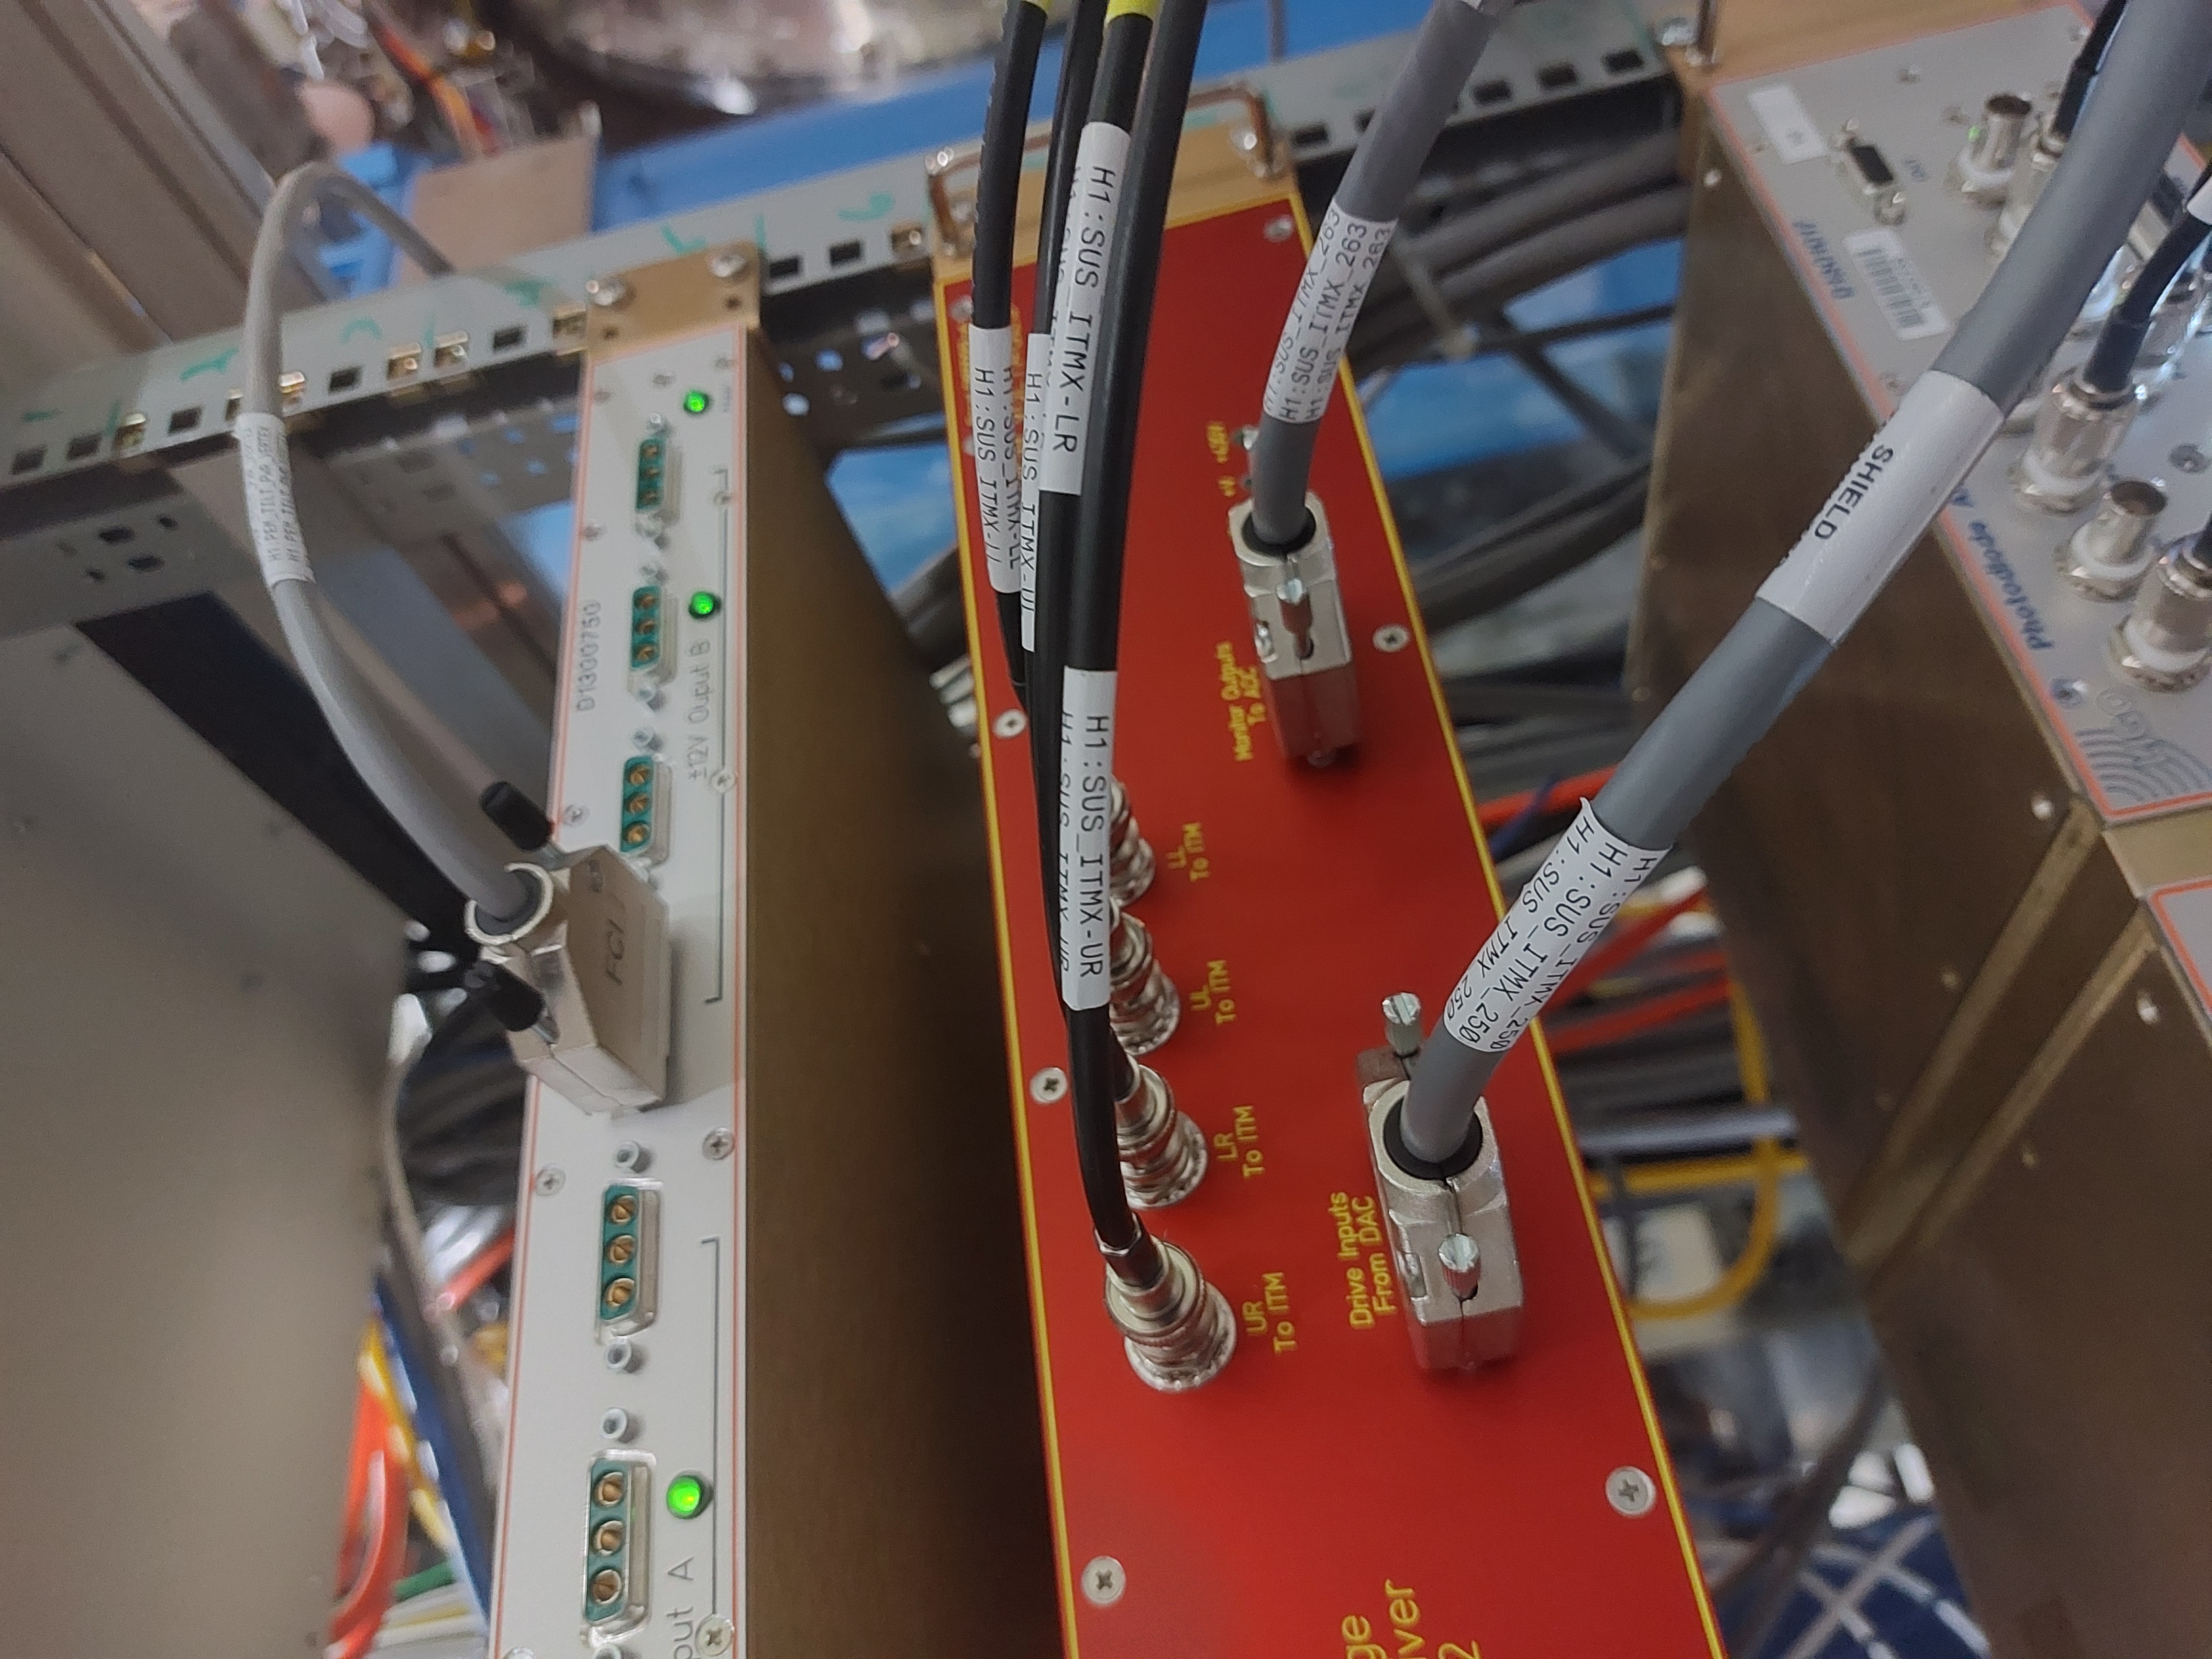
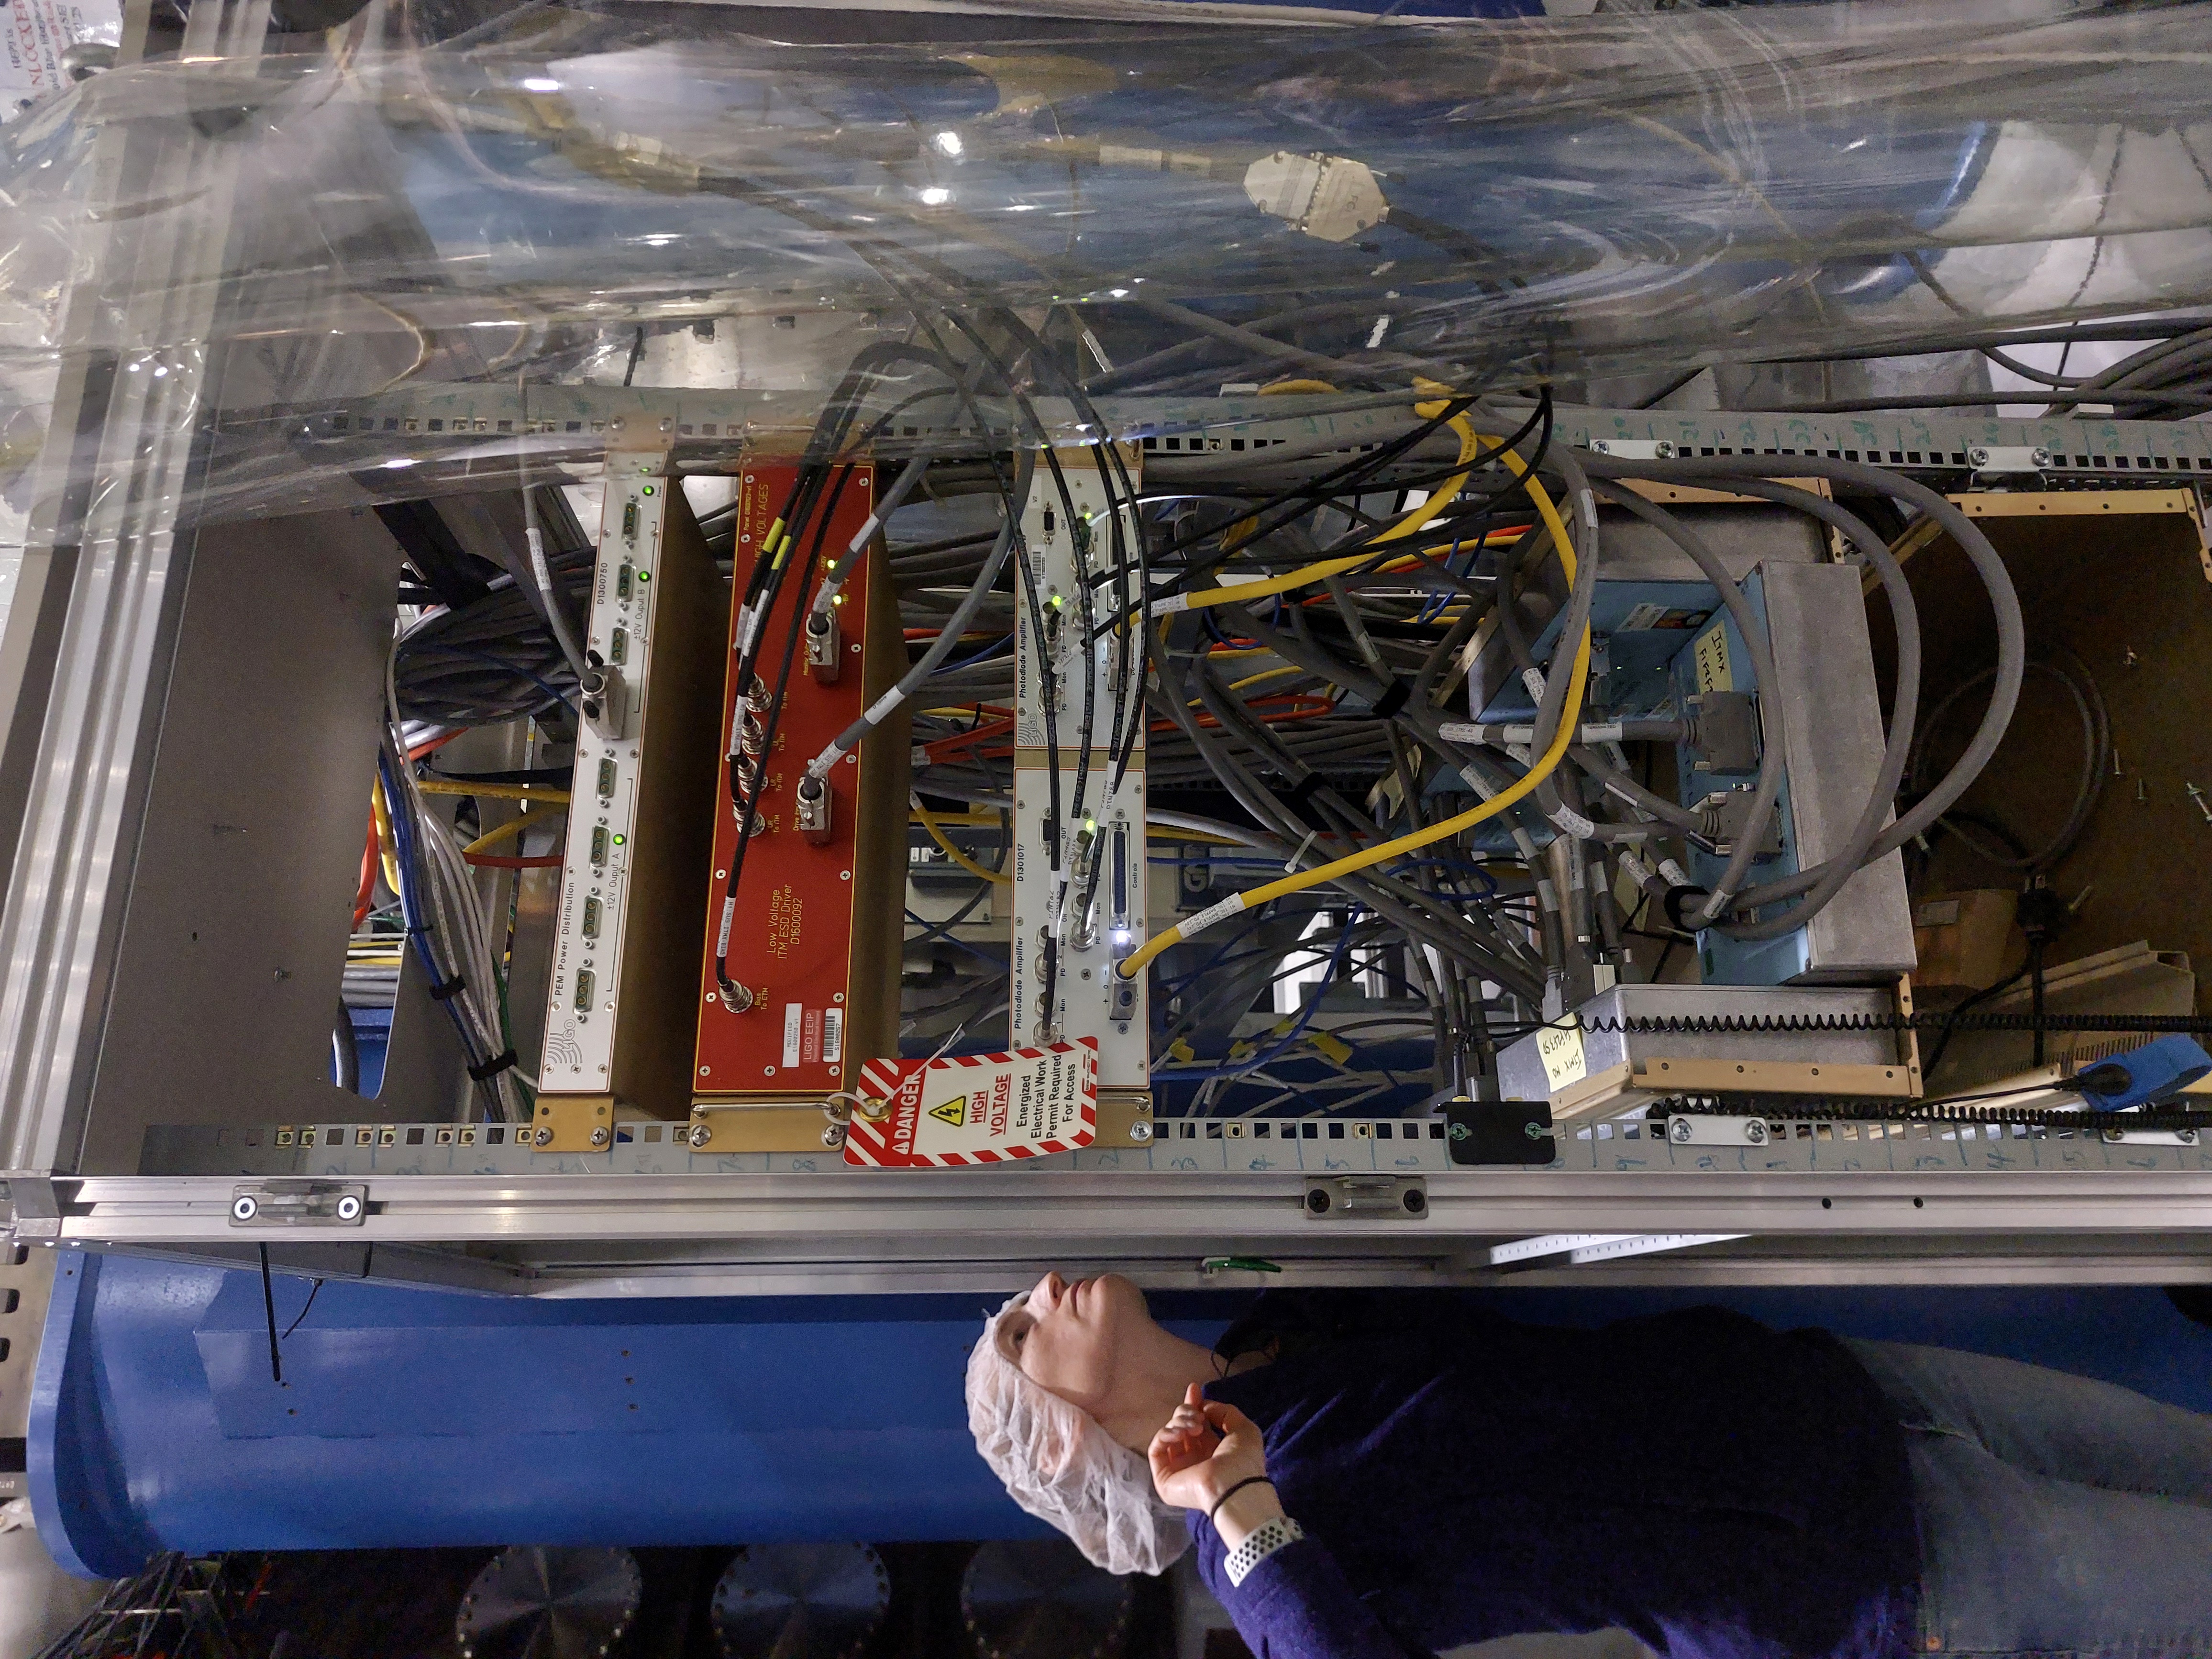
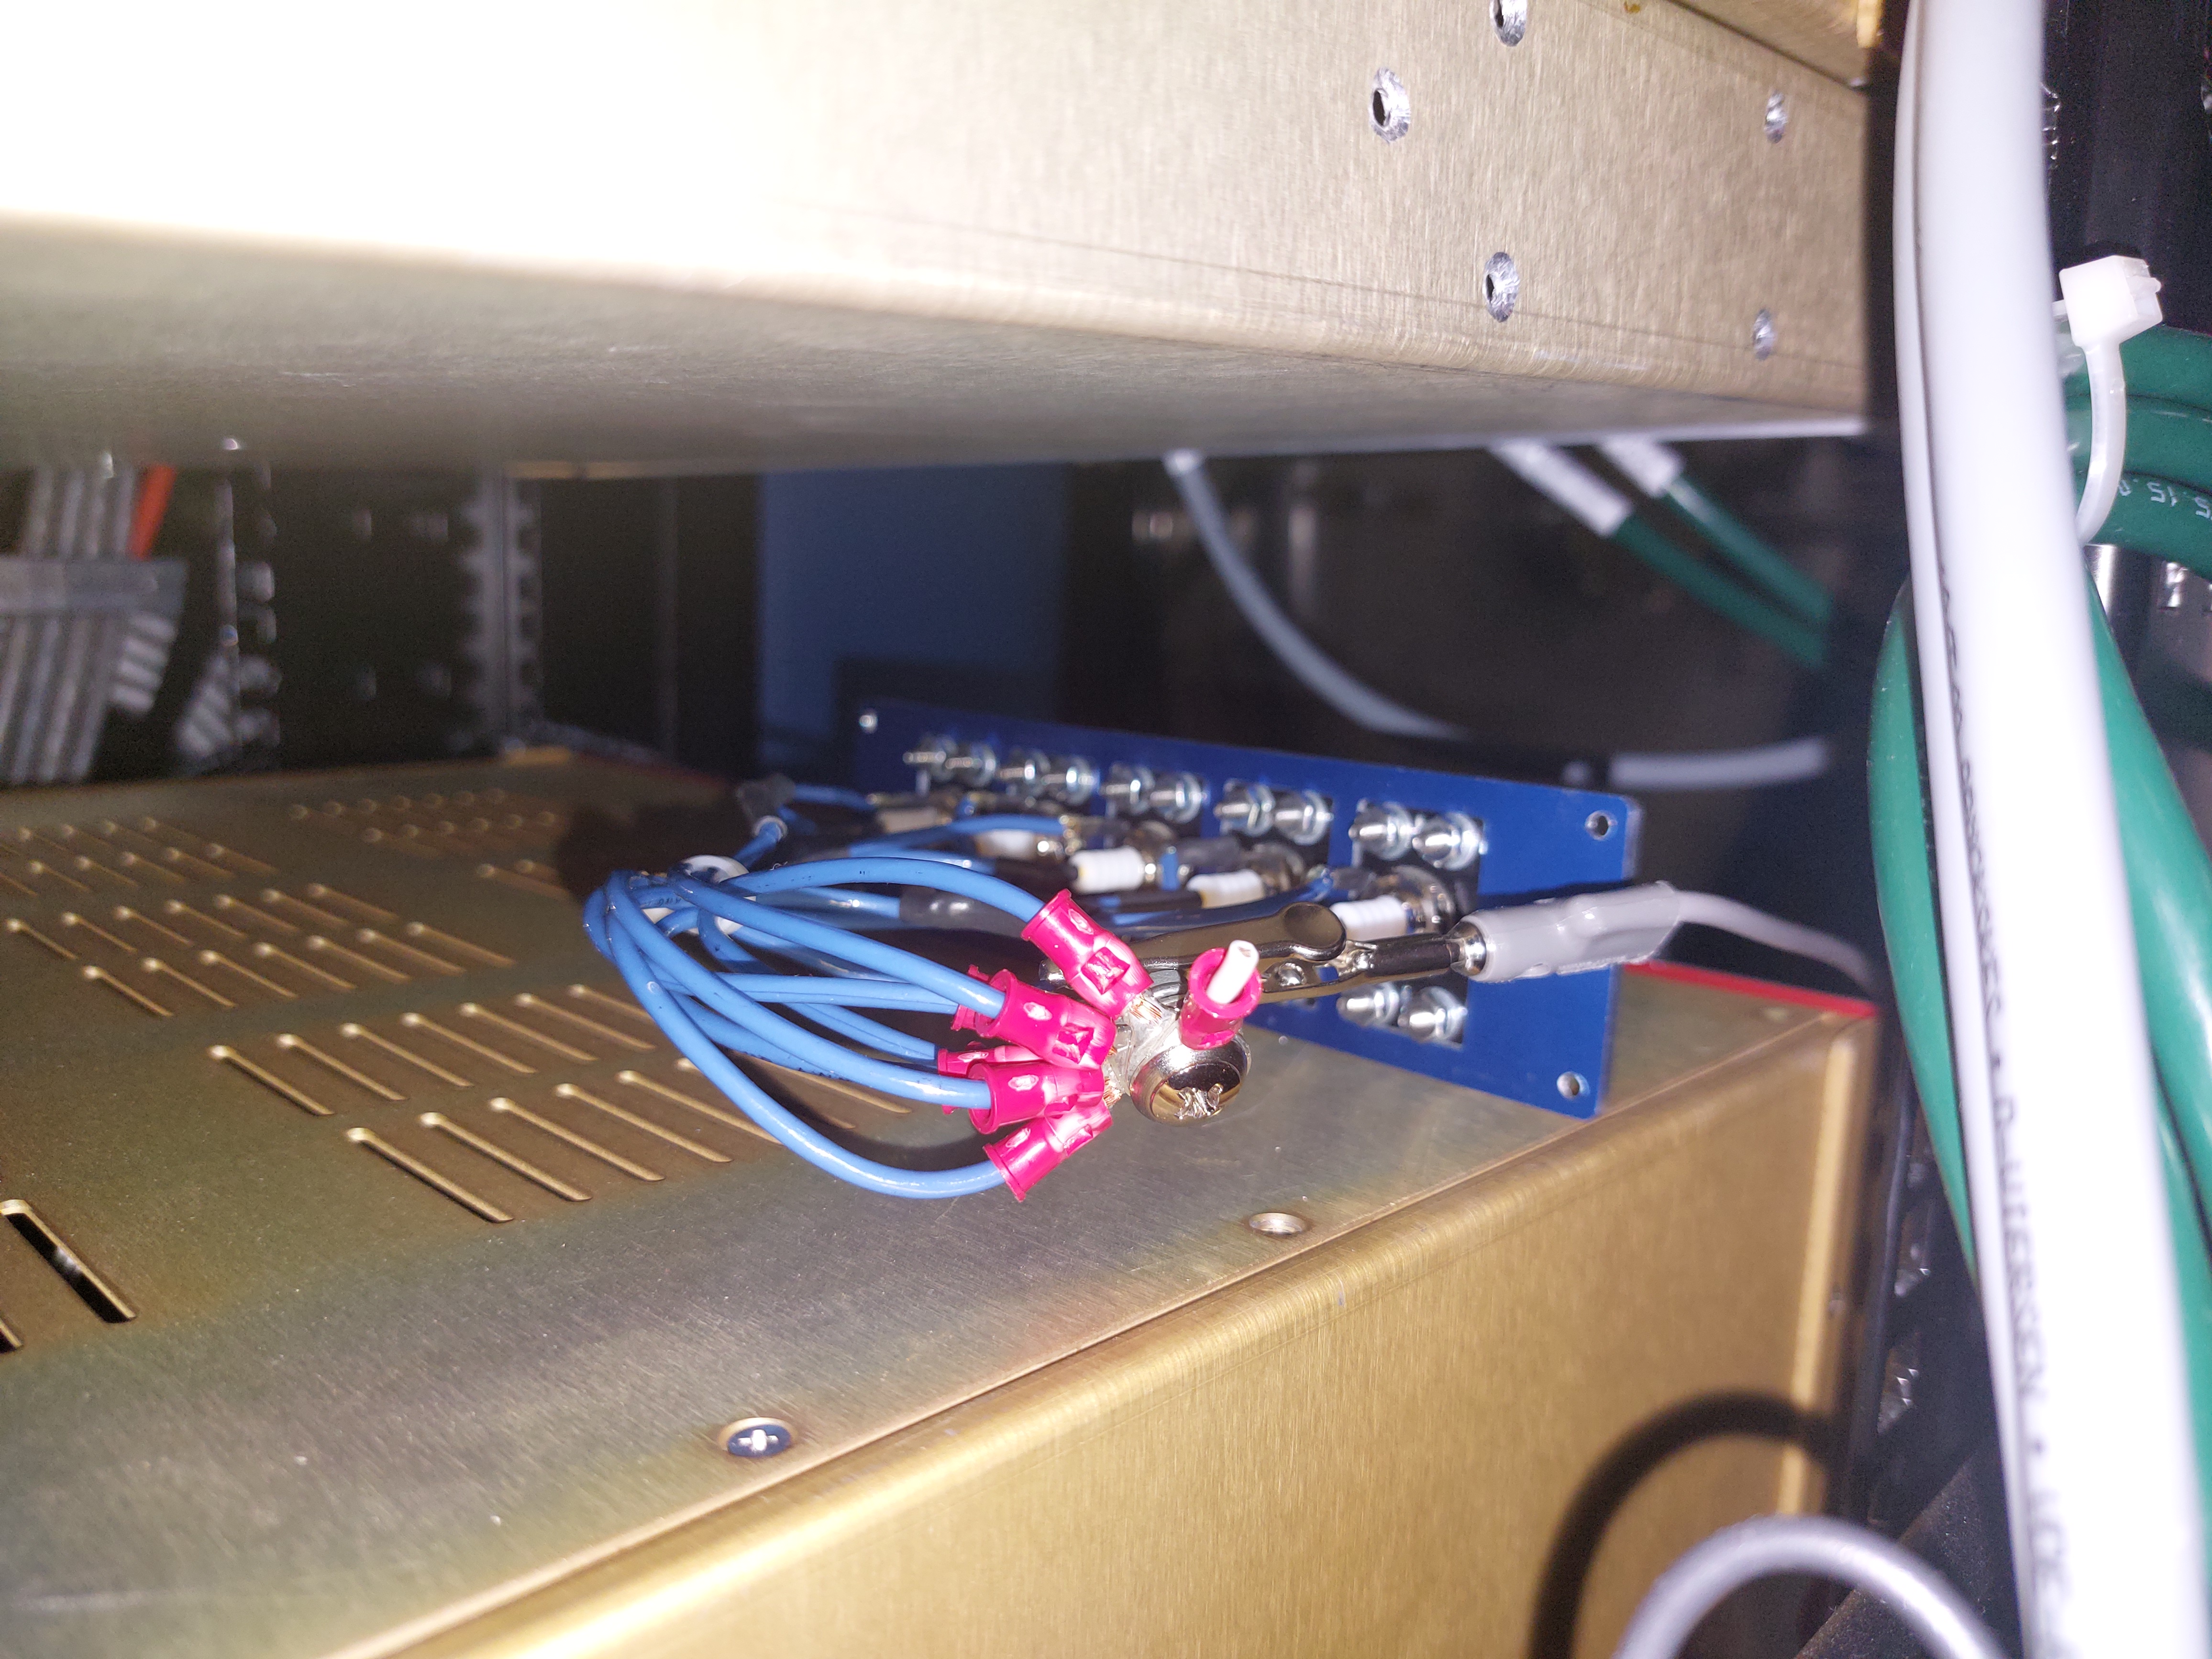
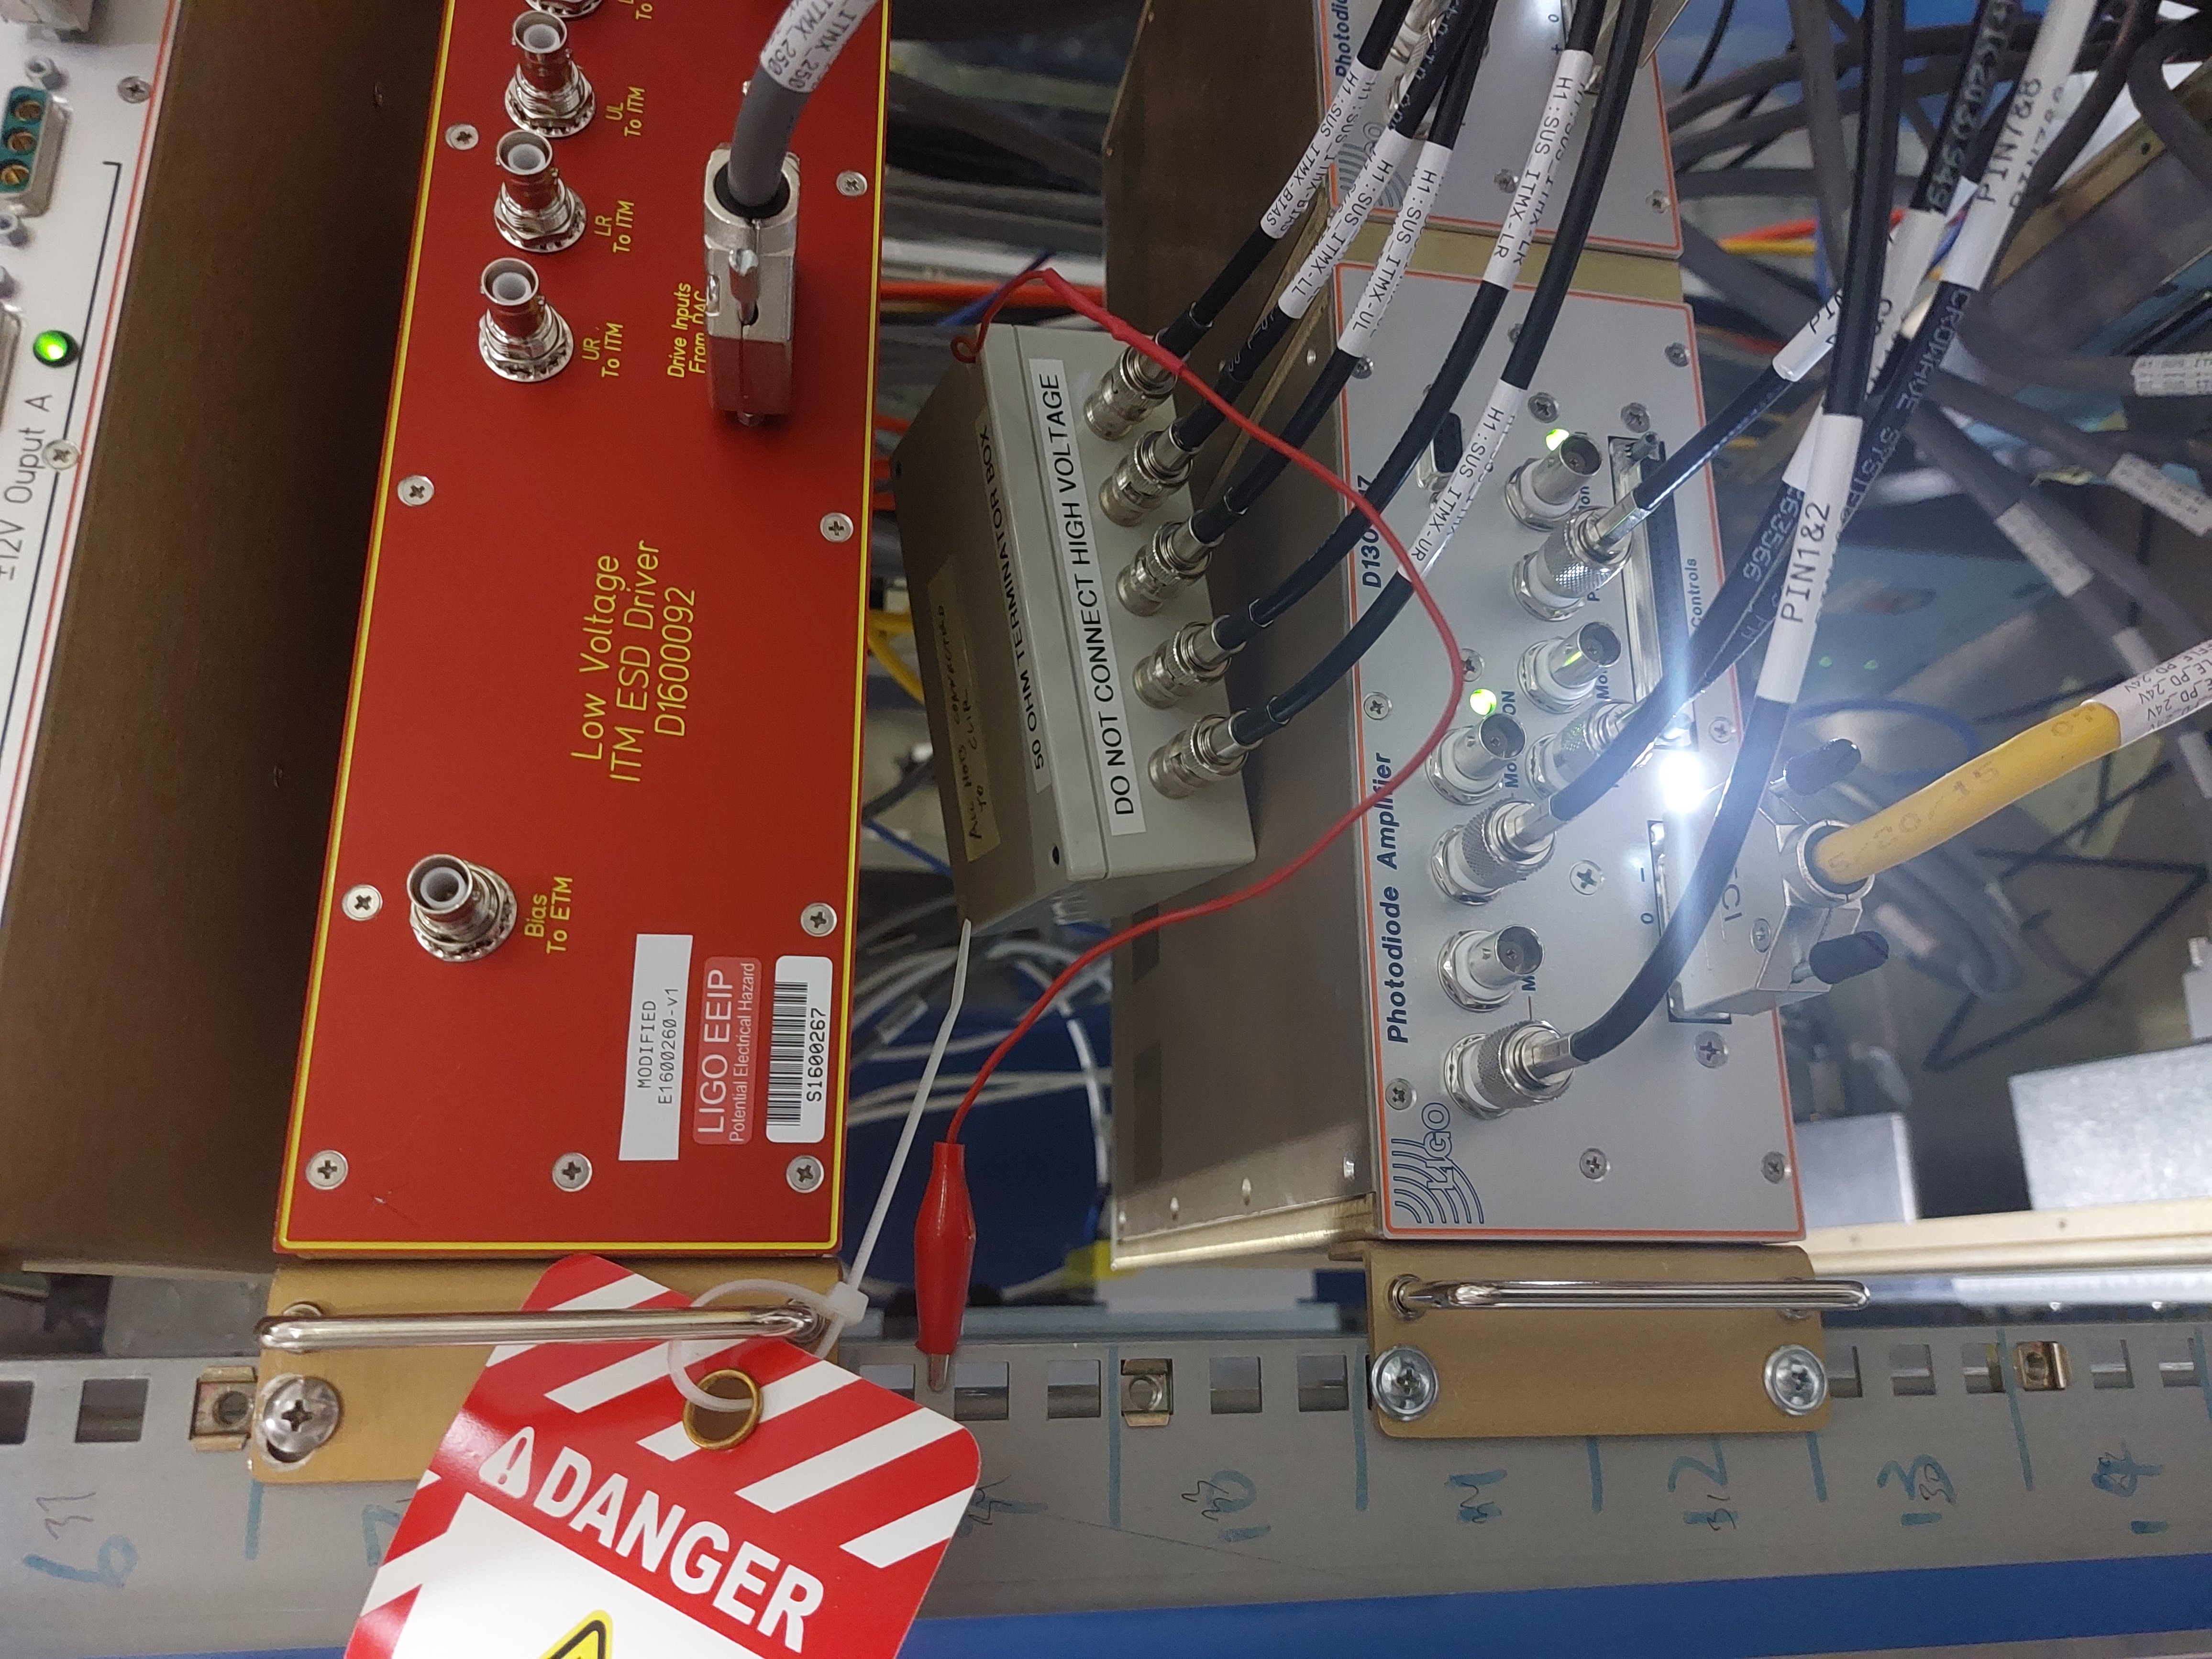
[Joan-Rene Merou, Alicia Calafat, Sheila Dwyer, Jenne Driggers]

We have entered the LVEA and went to the Beer garden. There, we first turned off the Low Voltage ITM ESD Driver D1600092, first the 15V switch and then the medium voltage switch. In order to turn it on again, it should be reconnected in the opposite order. With the voltage request set to 0 and chassis powered off, we have unplugged the SHV cables going to the chamber and plugged into Robert's ground boxes, which we used to ground to the rack which is grounded to the chamber. This has been done at both drivers (See attached photos).

Afterwards, we have changed the code at /opt/rtcds/userapps/release/isc/h1/guardian/ISC_LOCK.py in order that the LOWNOISE_COIL_DRIVERS will go to LOWNOISE_ESD_ETMY instead of TRANSITION_FROM_ETMX. This has been done by changing lines 6670 and 6674, moving the ", 15" step from line 6670 to 6674. Finally, we communicated the change to the operator and loaded the guardian.
It appears that the grounding did not decrease the amplitude of the combs. As seen in the attached figure, the relative amplitude of the first harmonics of the combs remains mostly the same before and after the change on November 13th.
EPO-Tagging for photo of ESD work
Related: https://alog.ligo-wa.caltech.edu/aLOG/index.php?callRep=87729
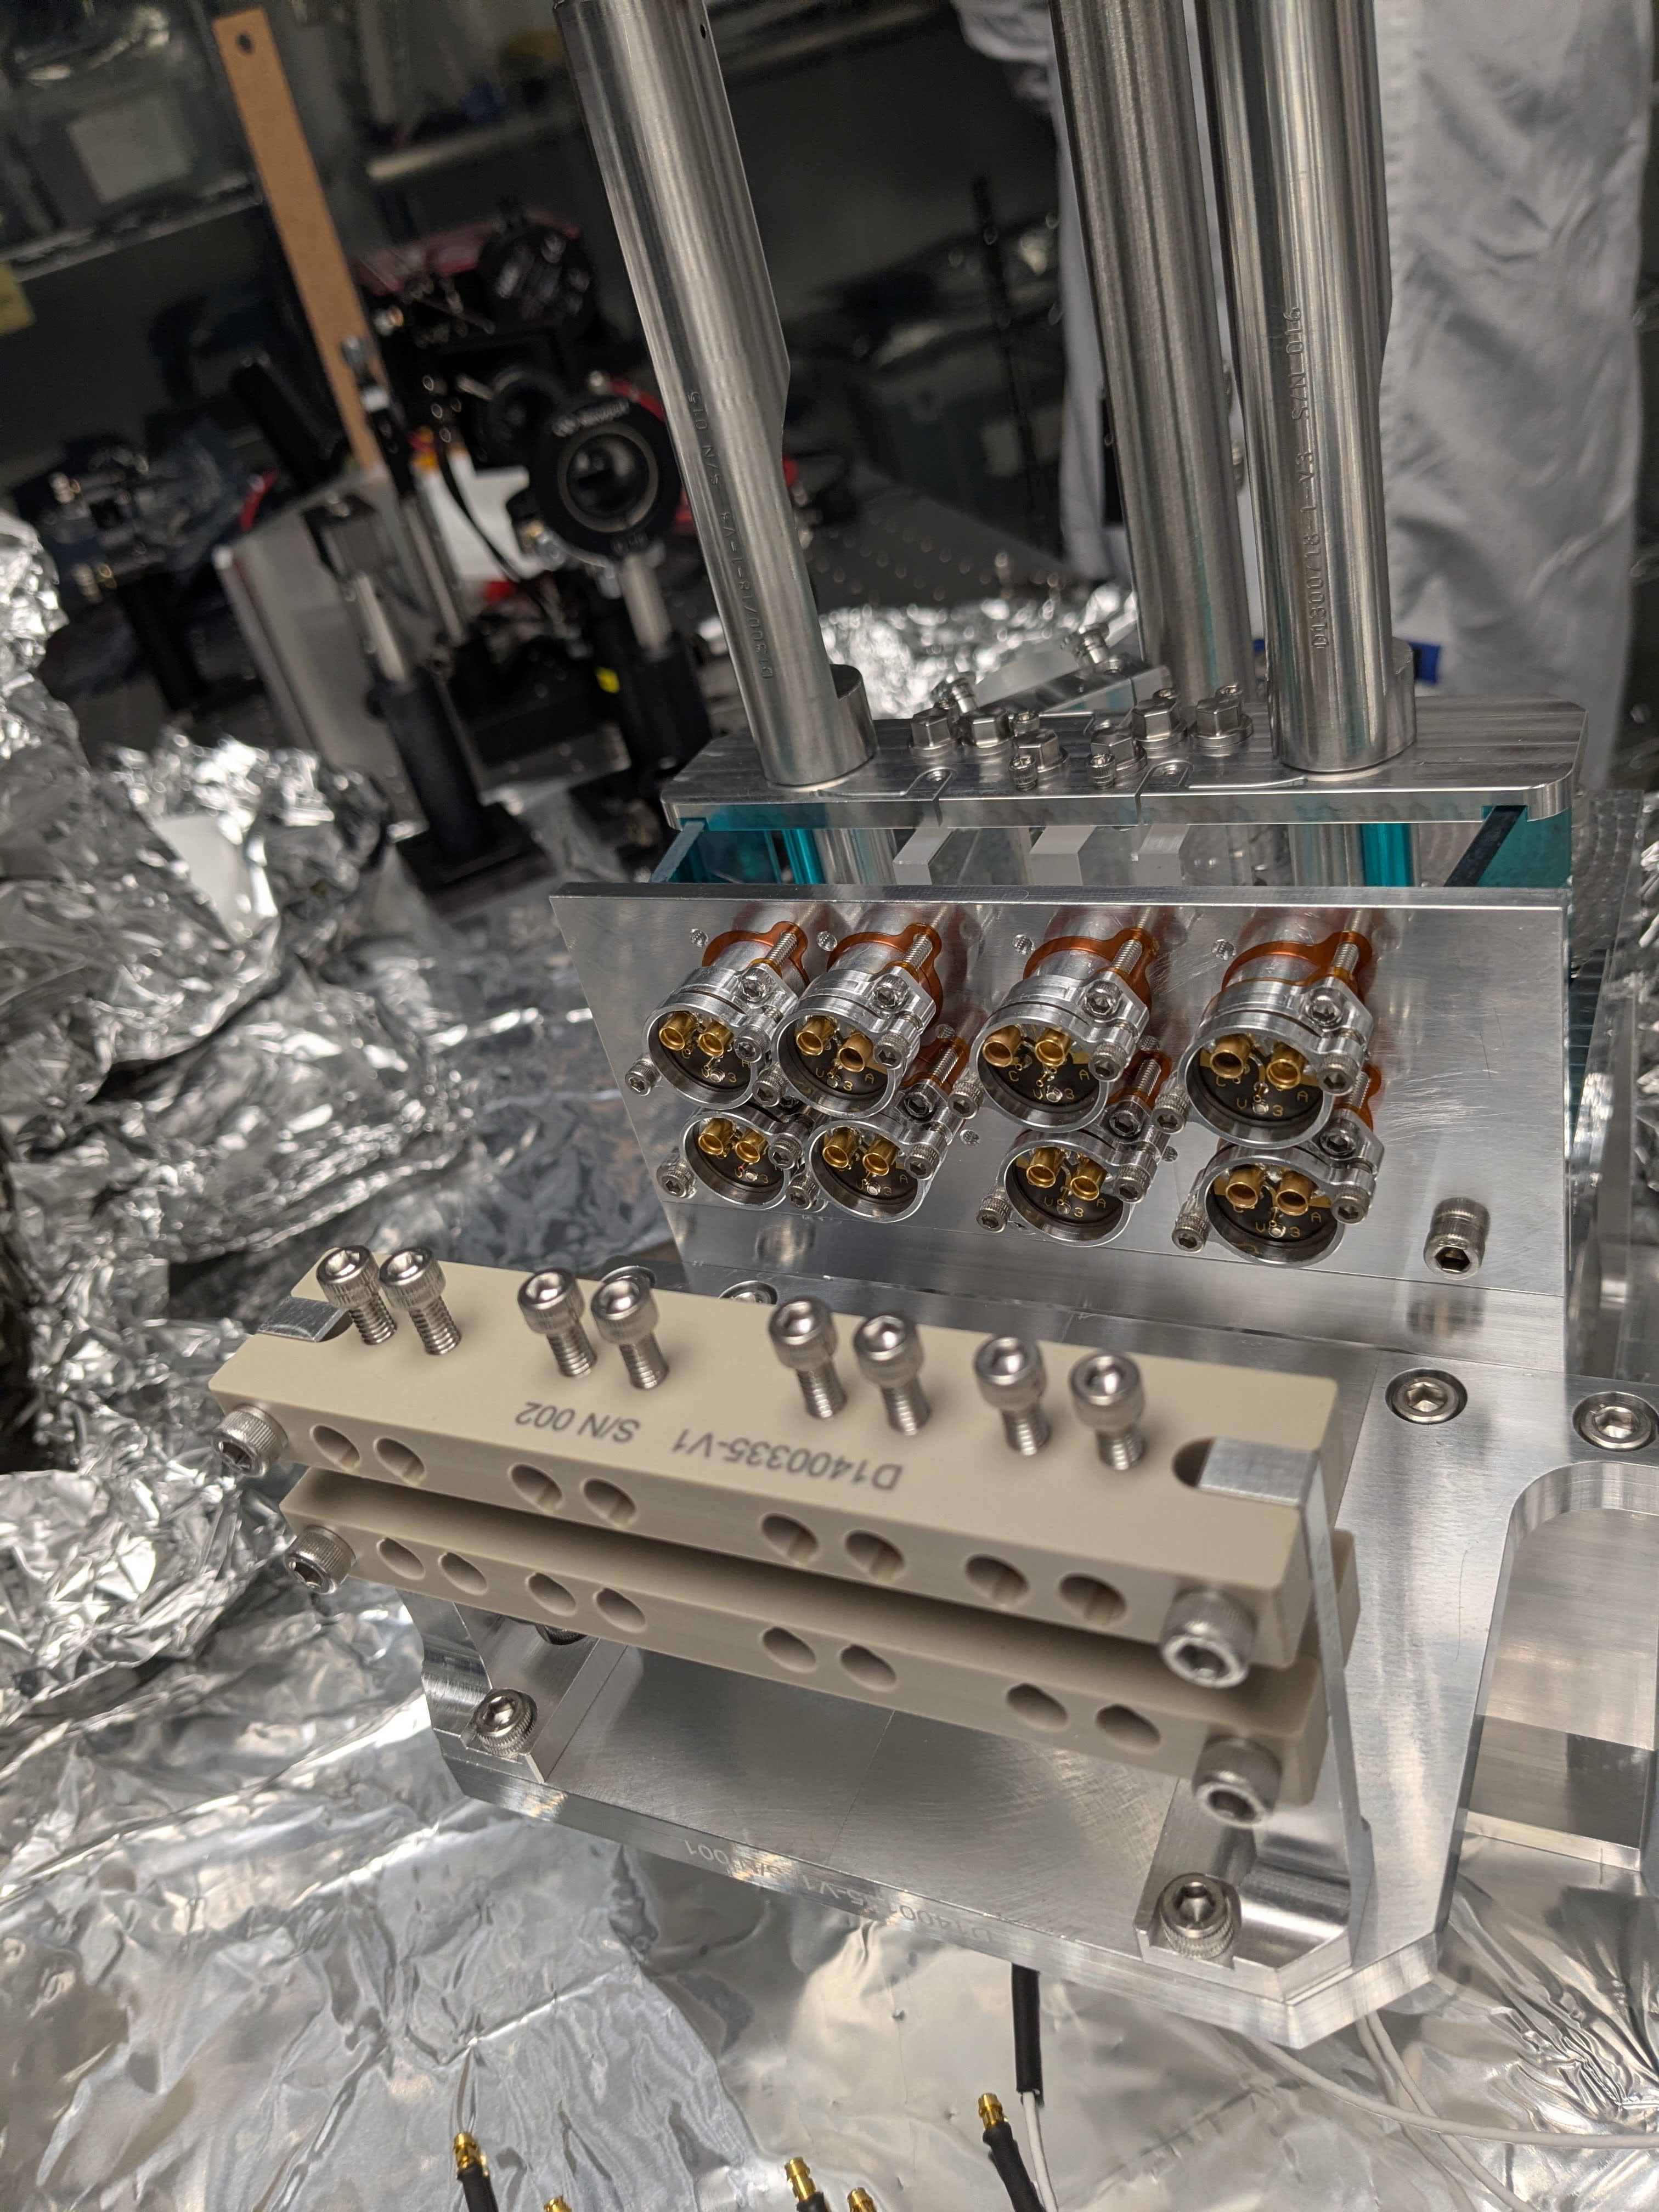
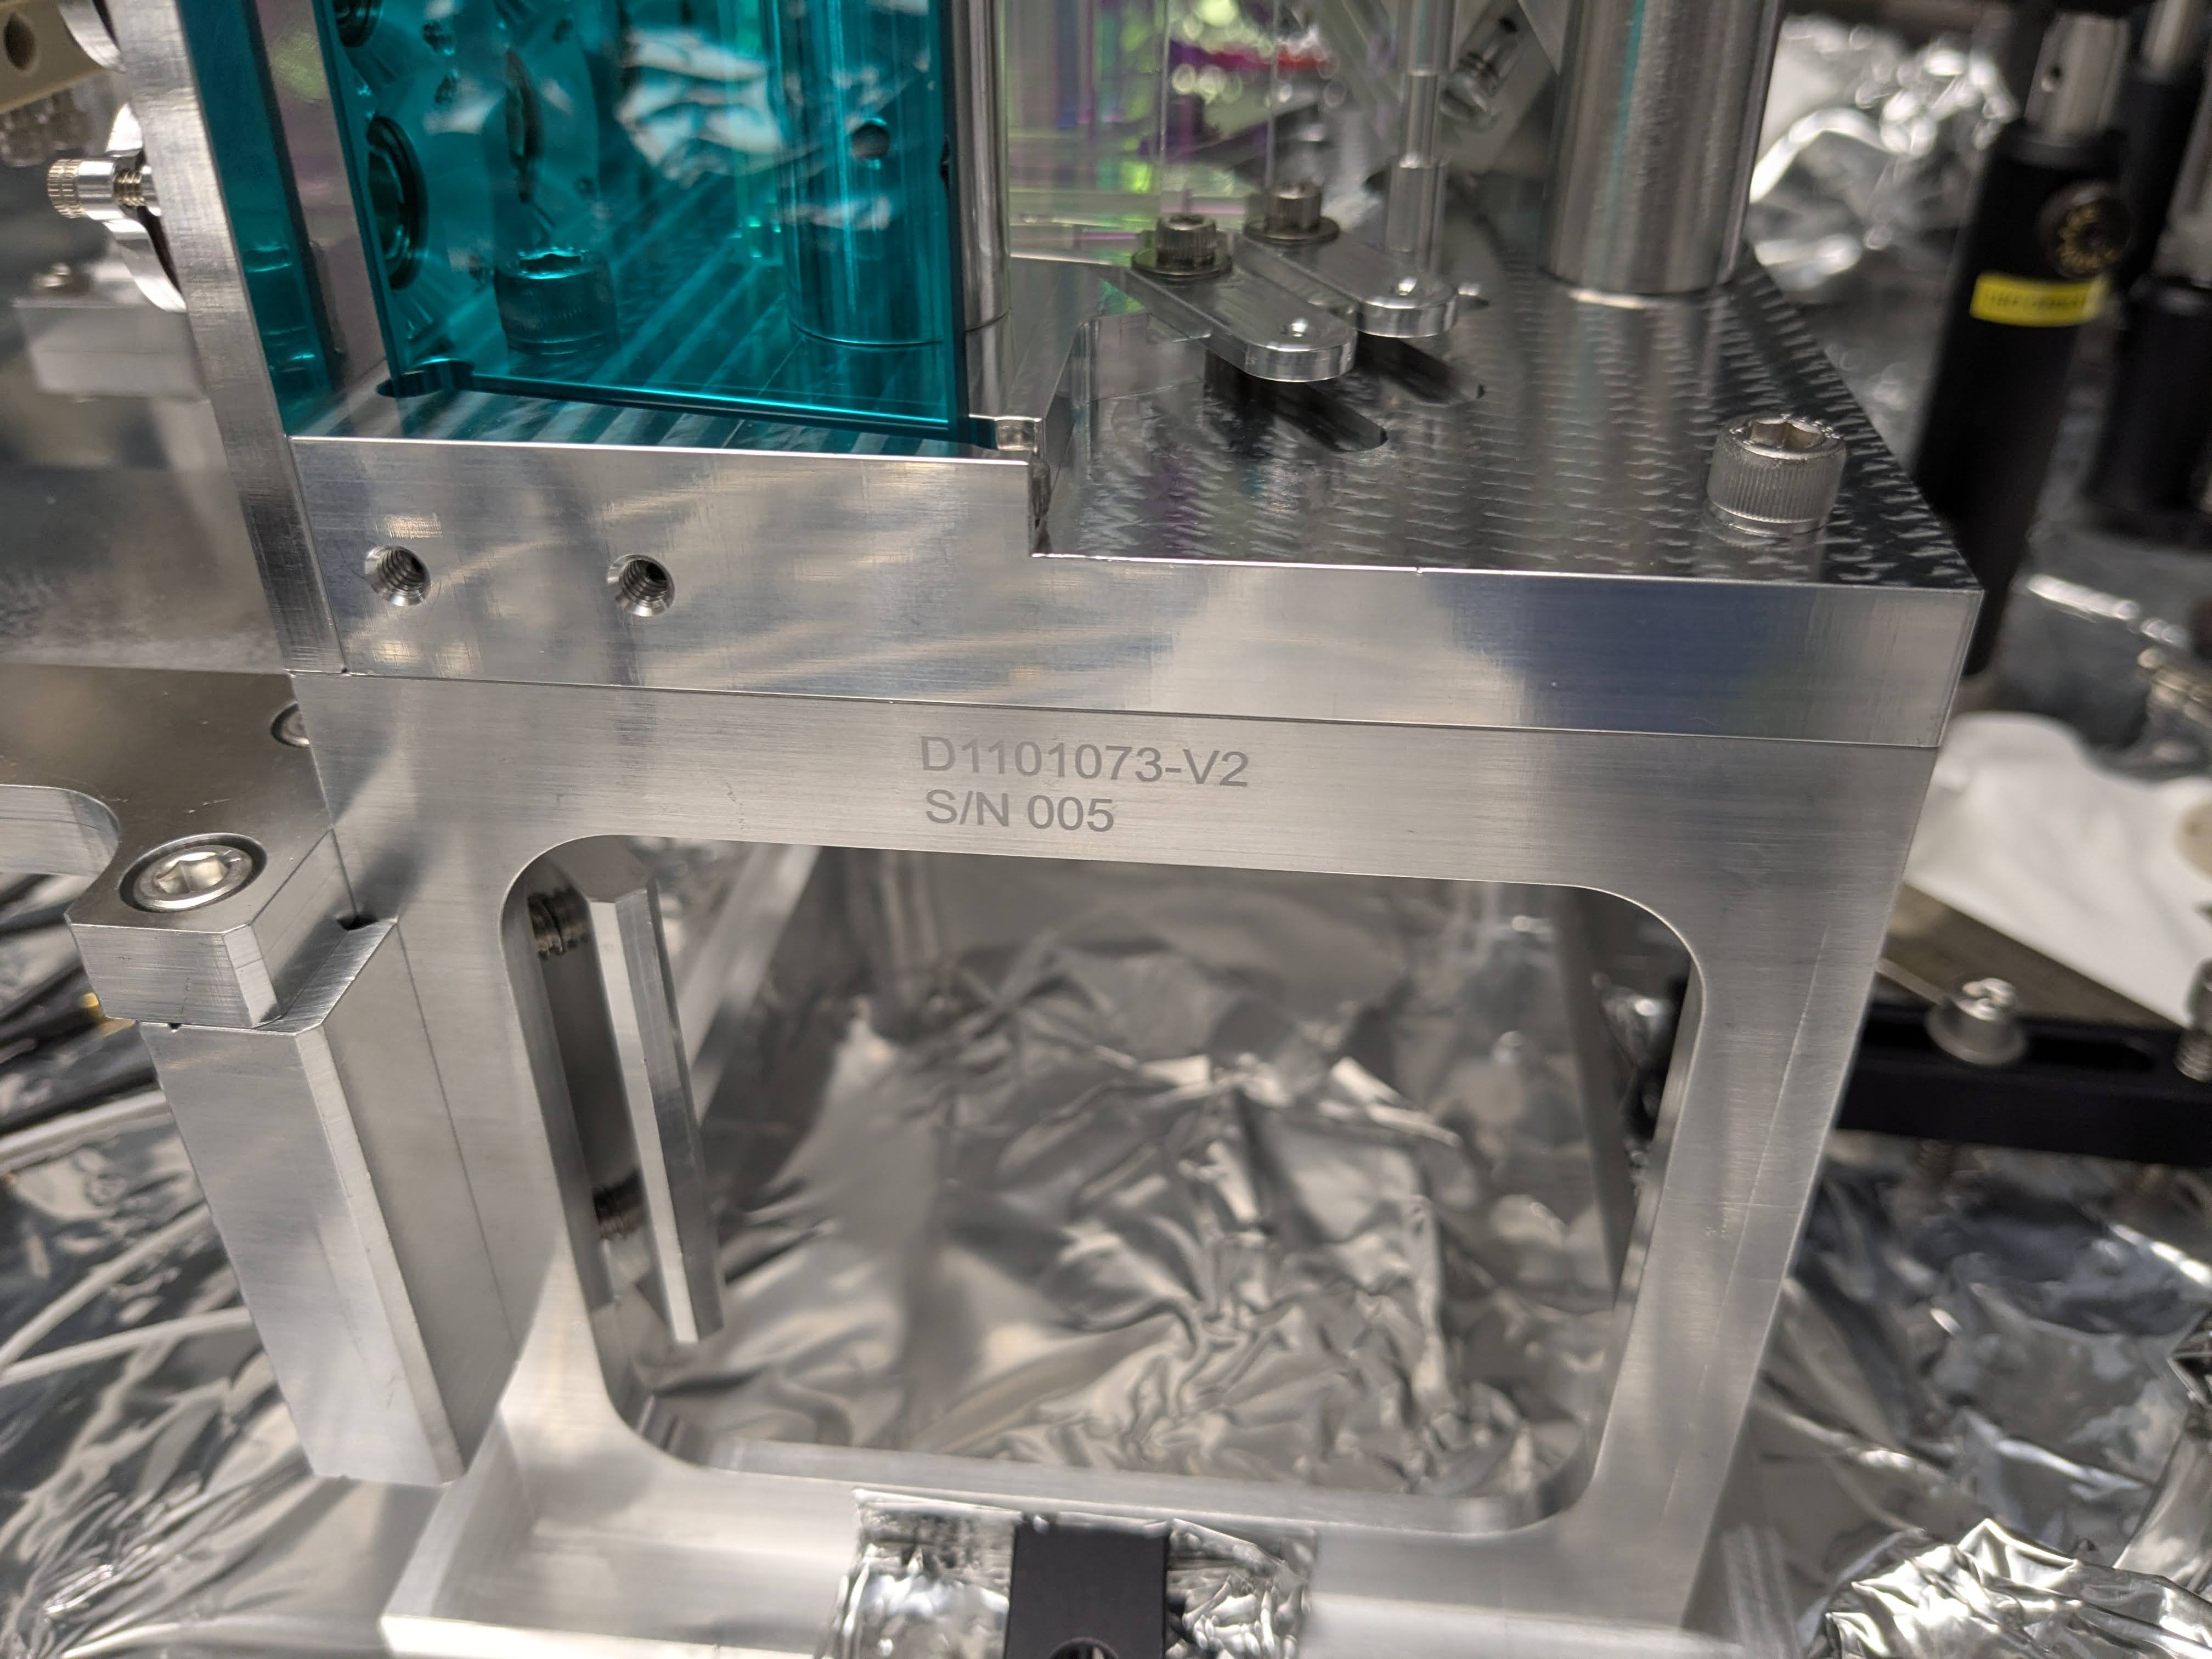
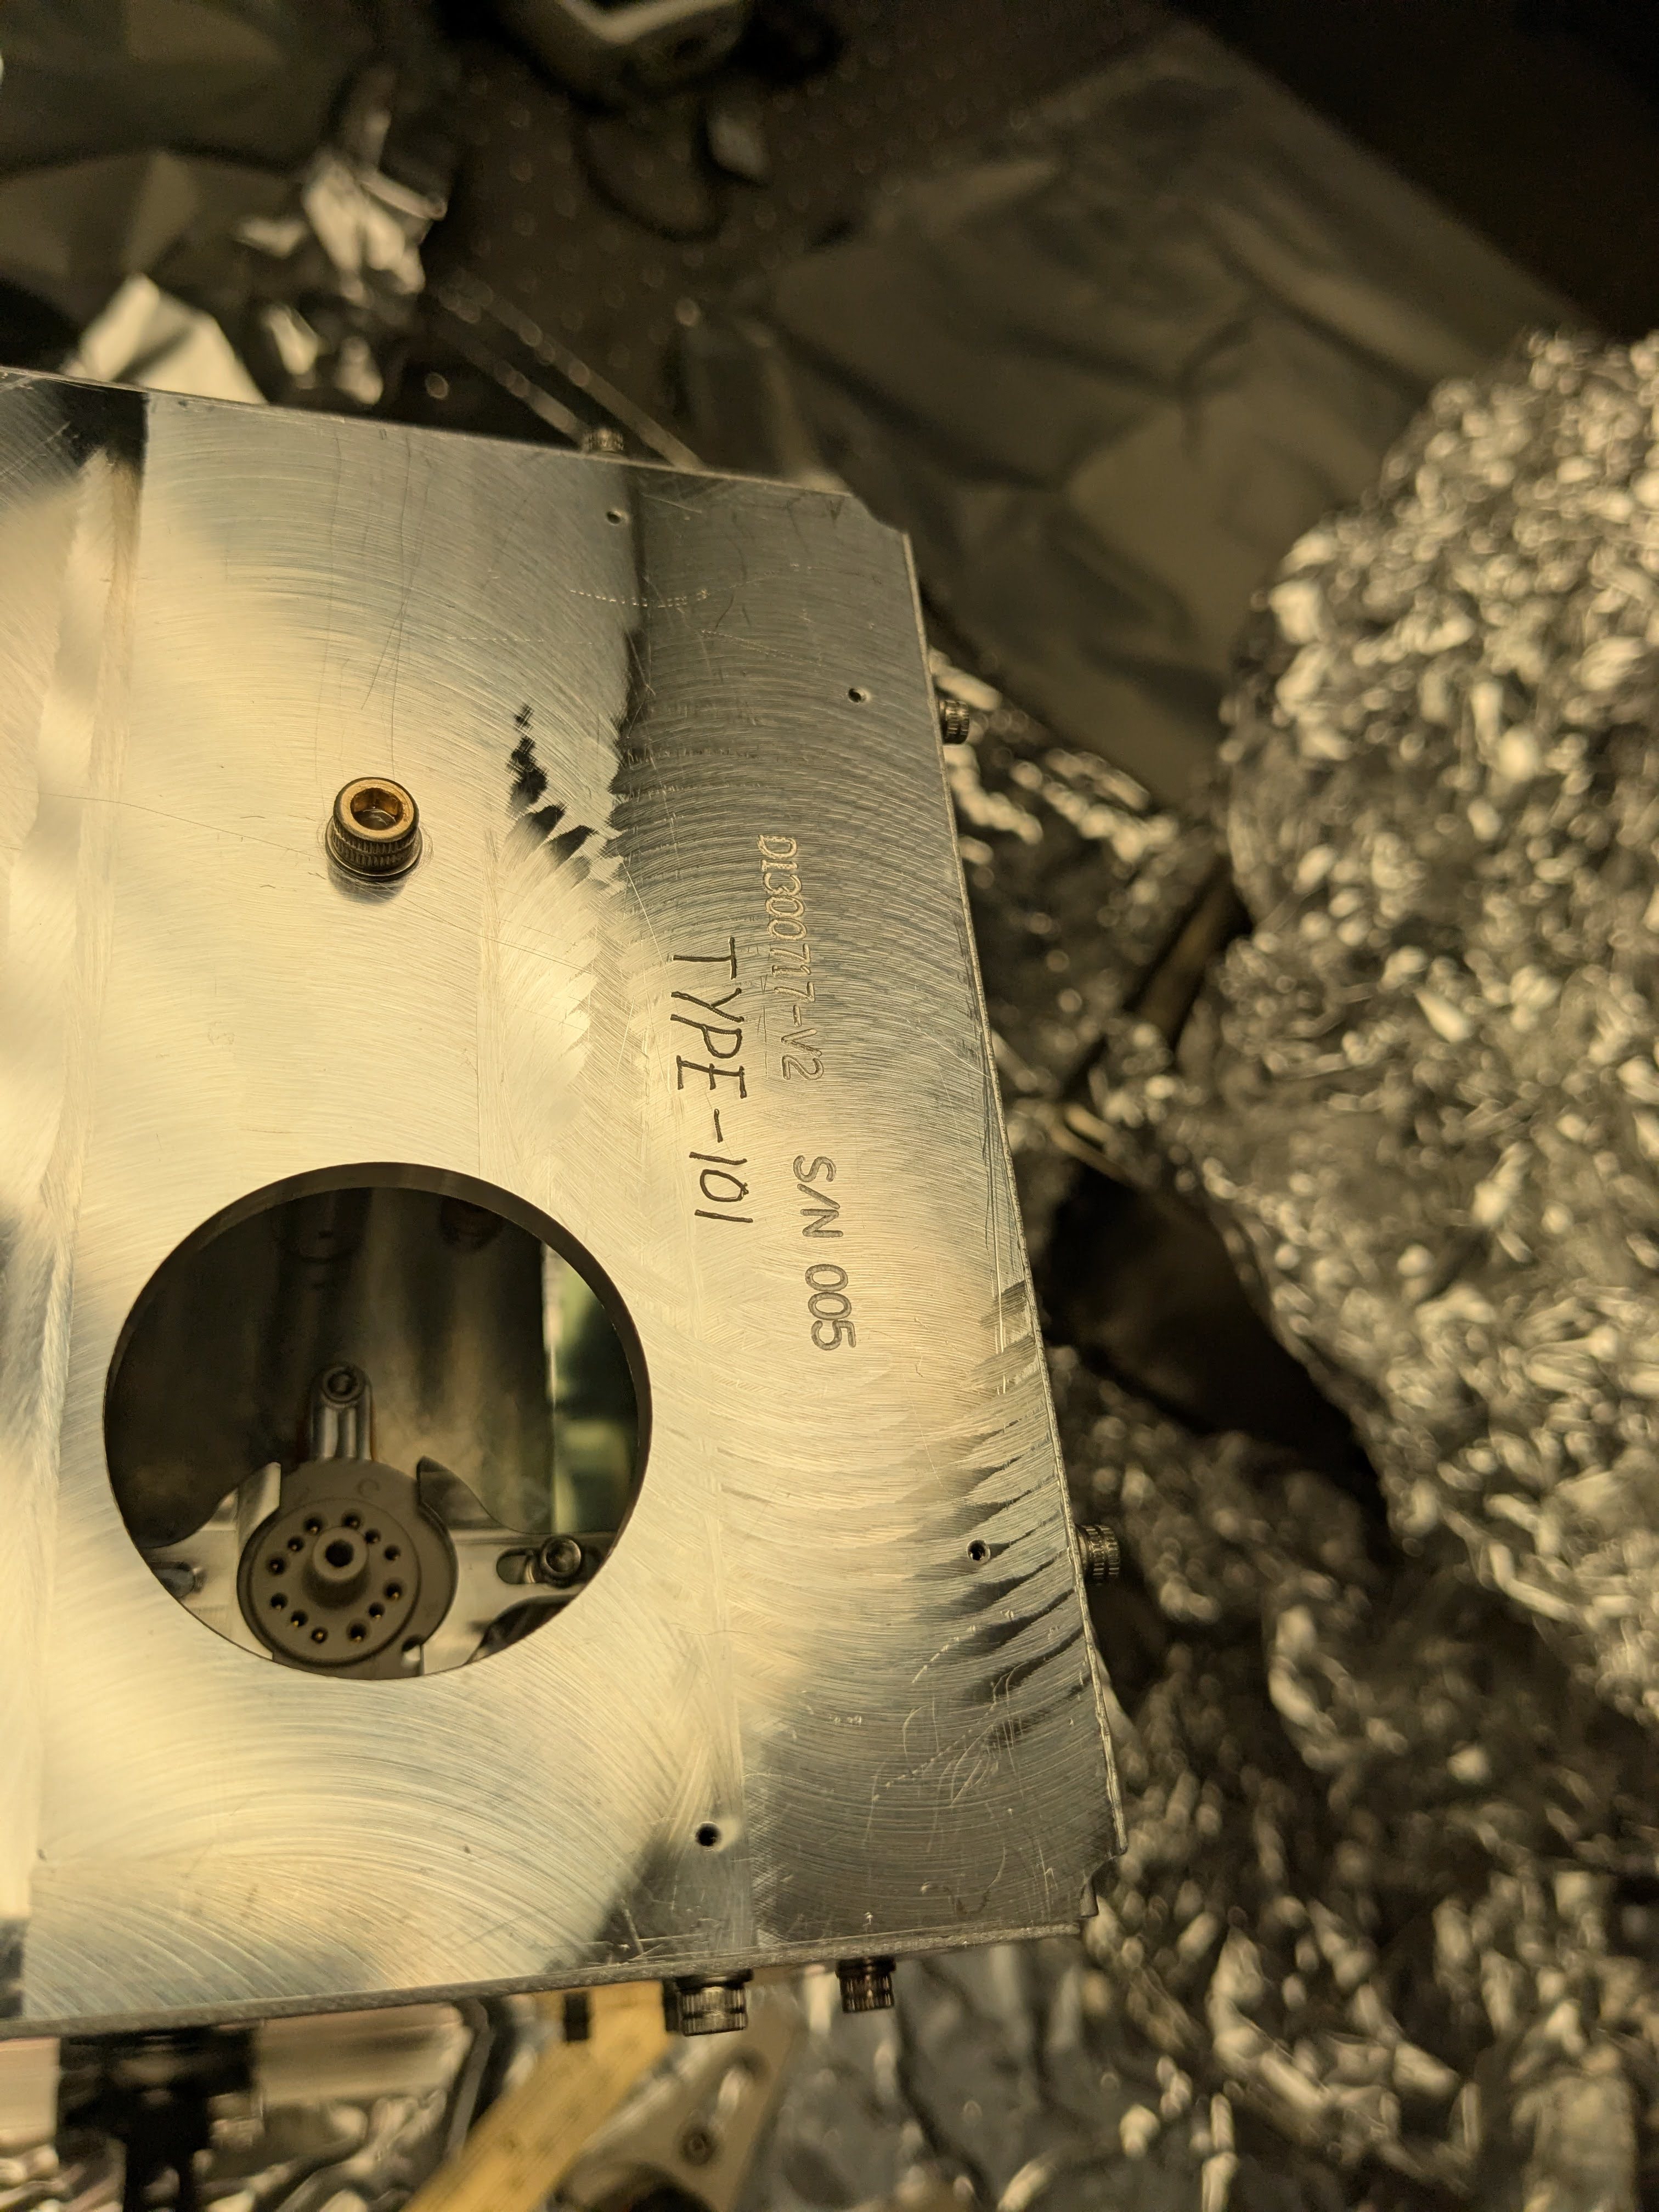
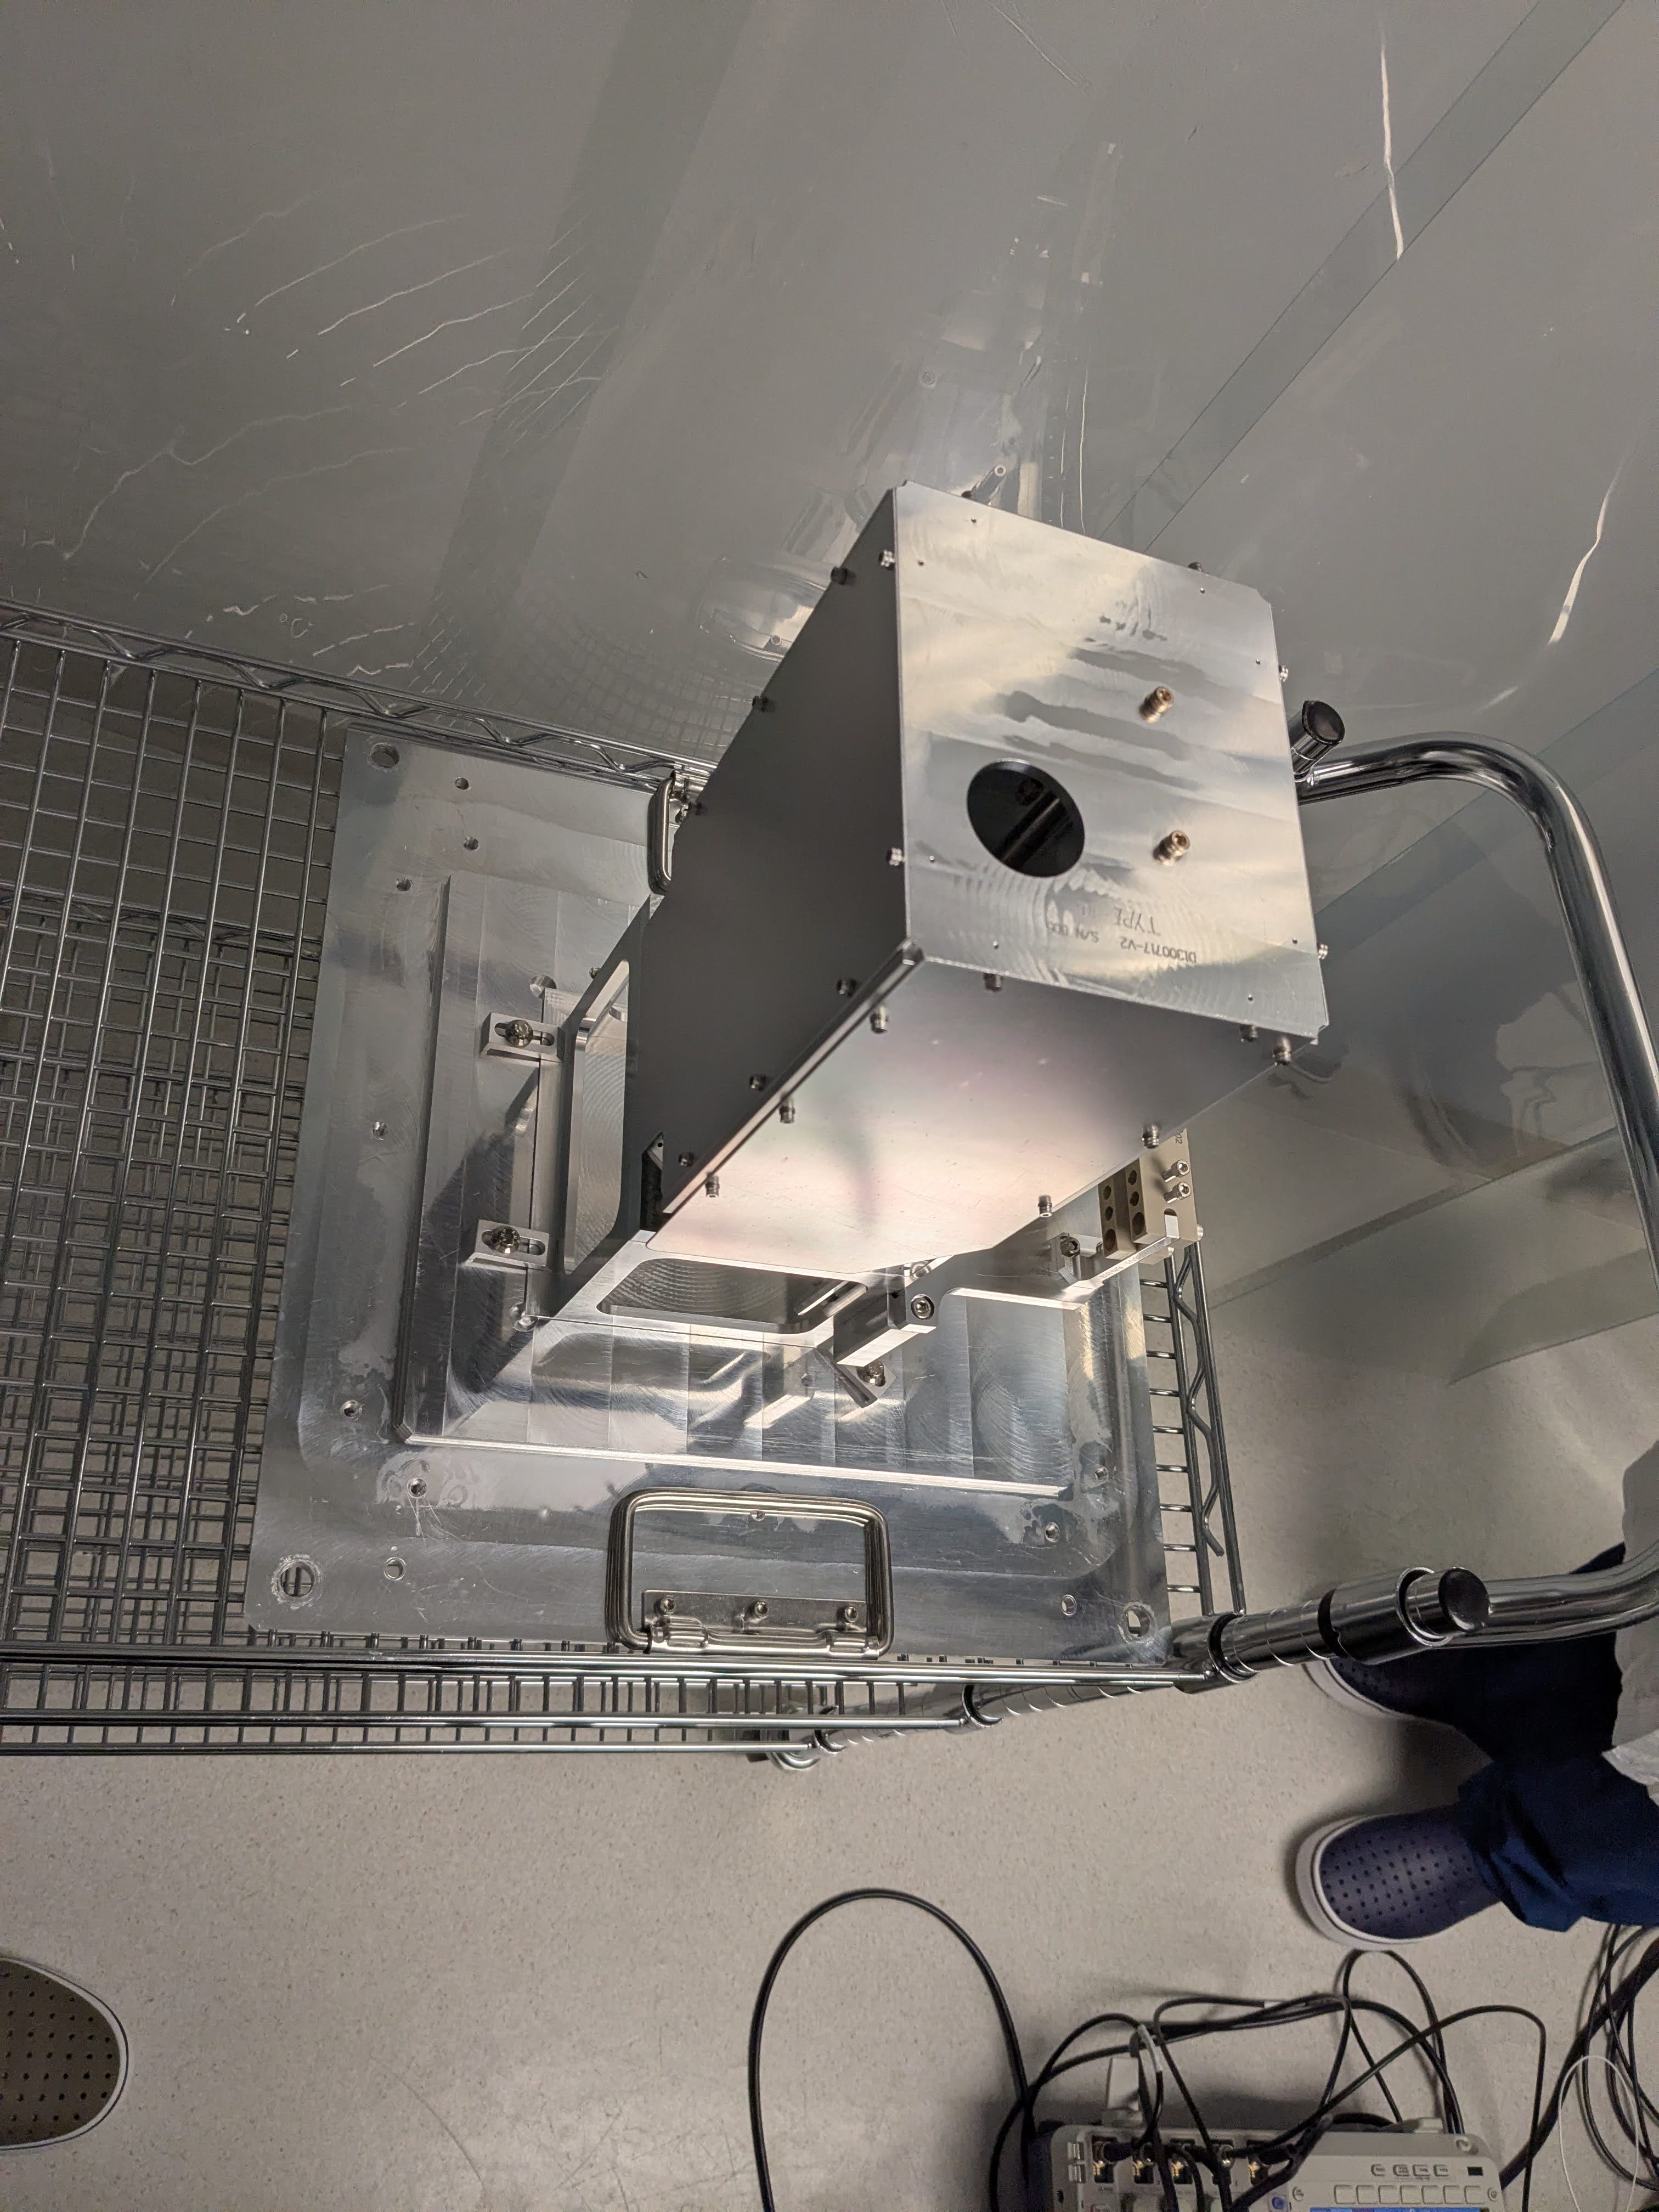
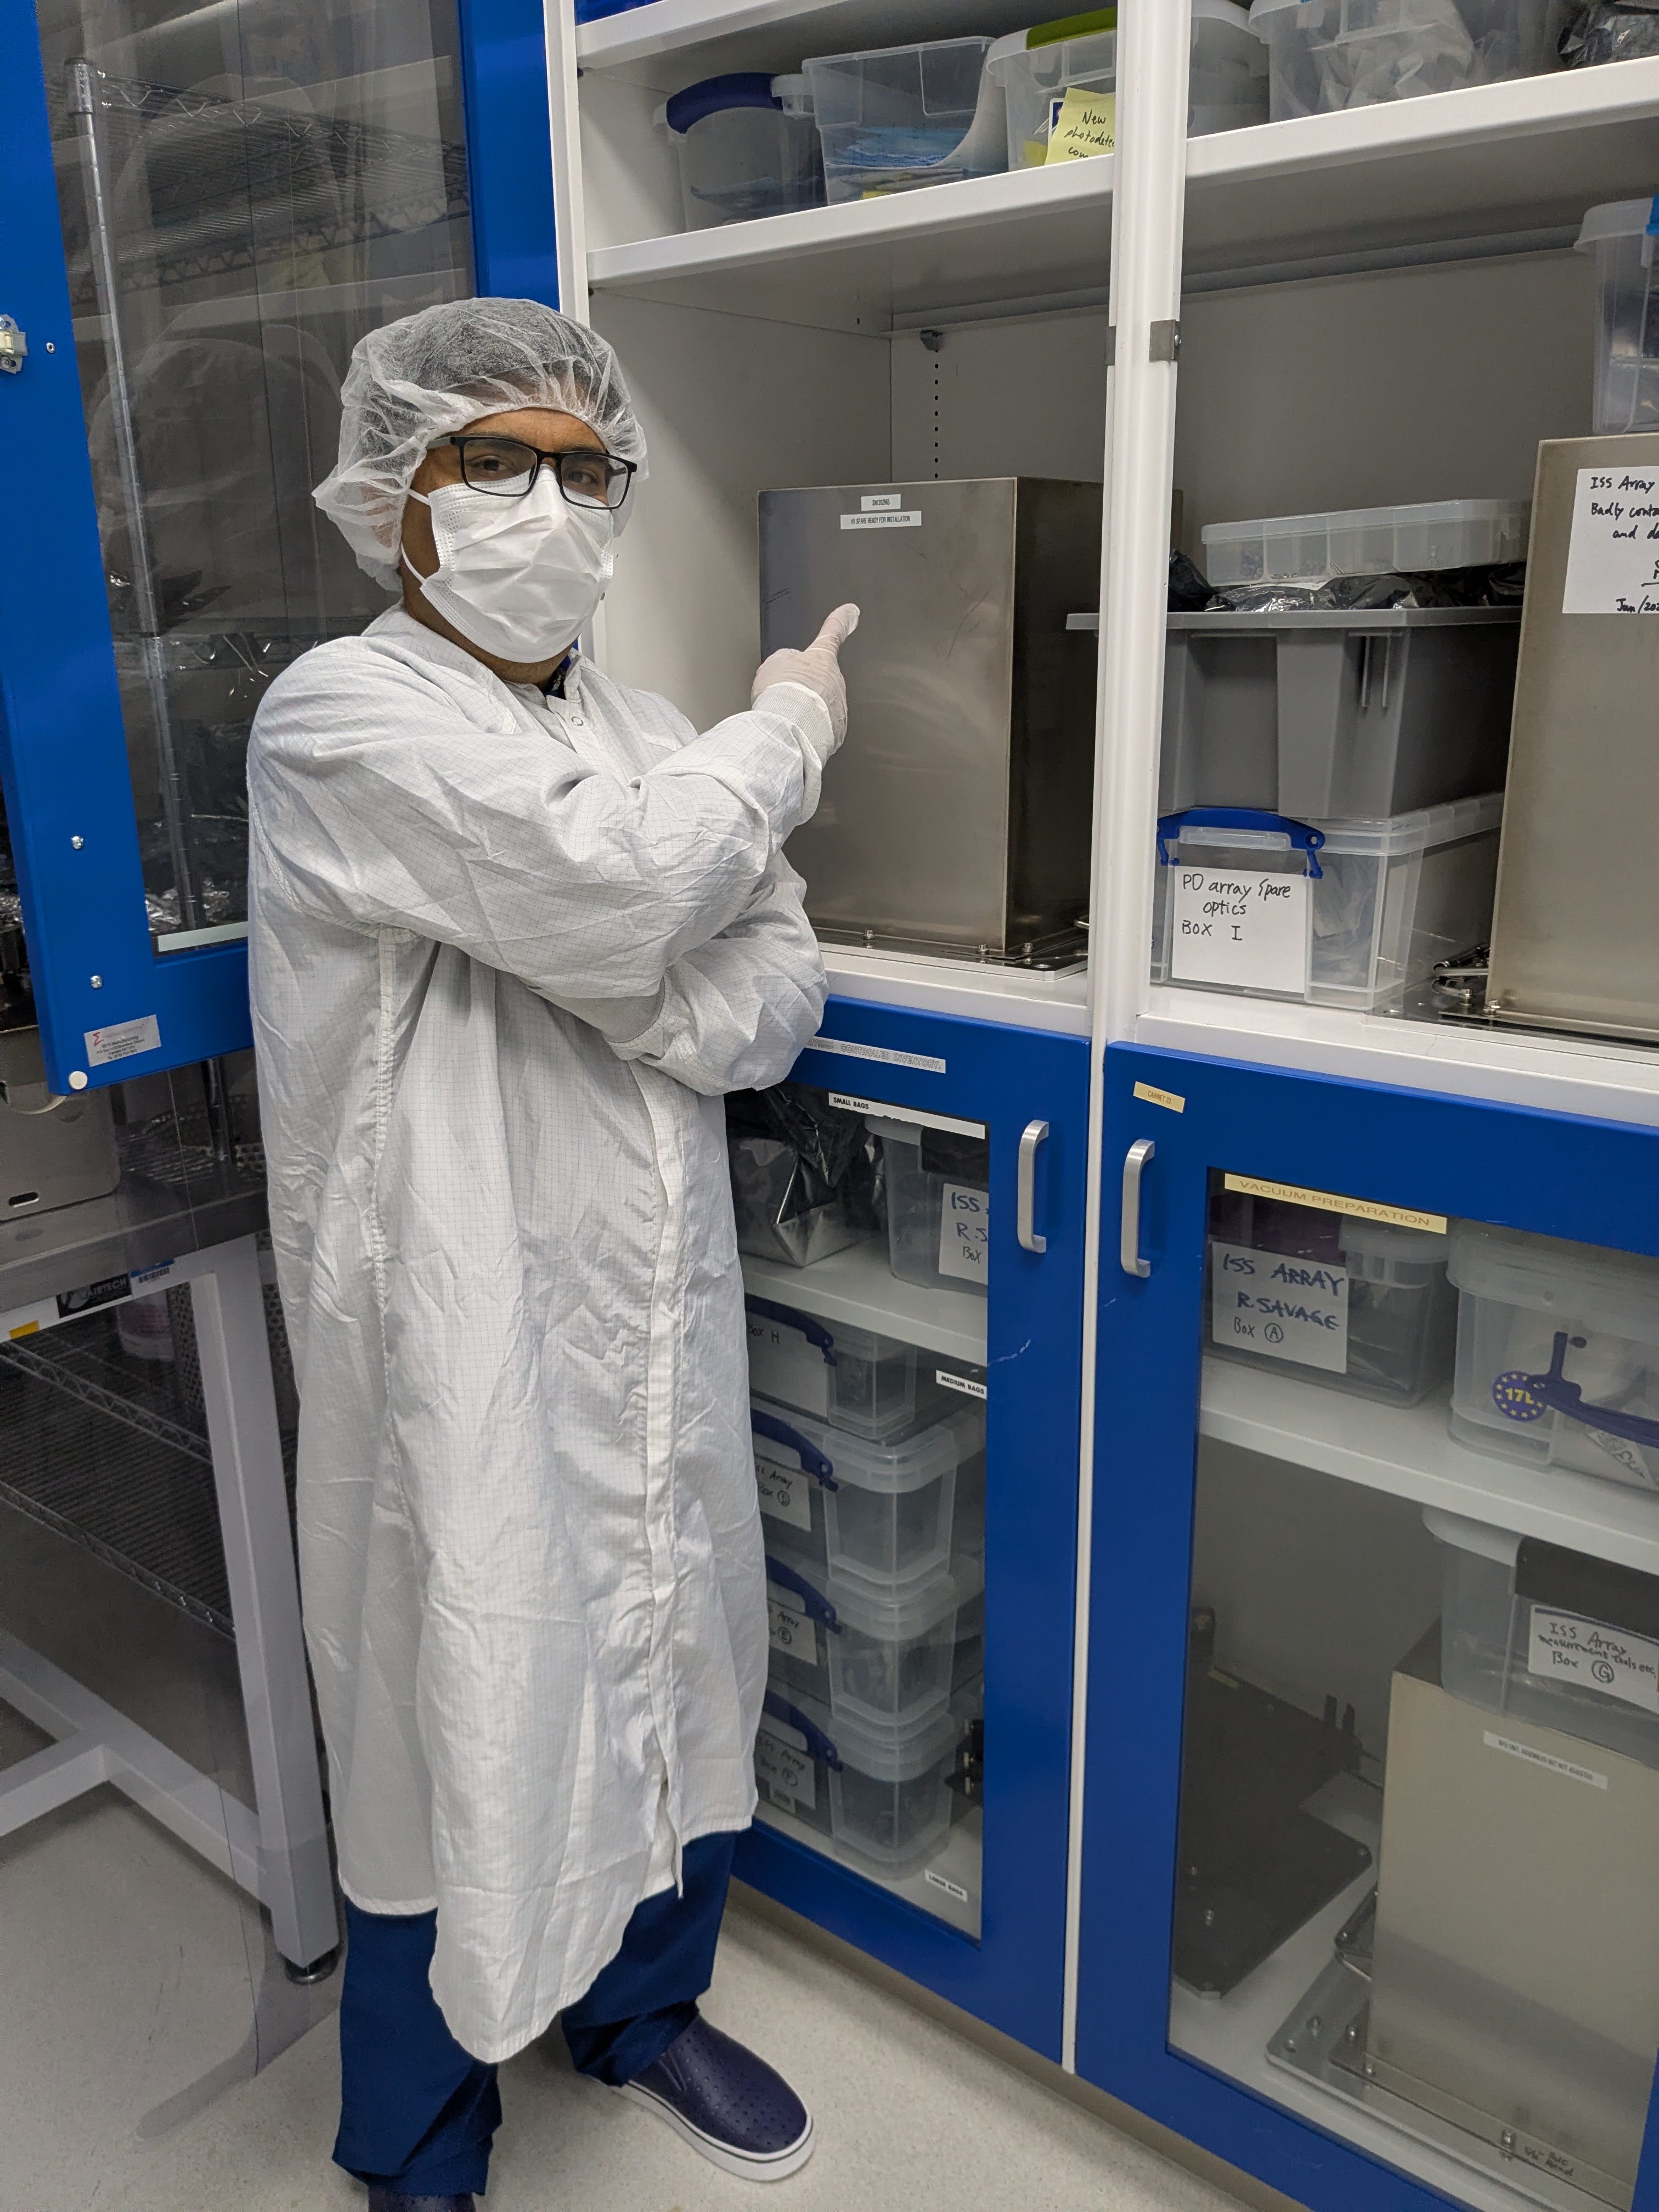
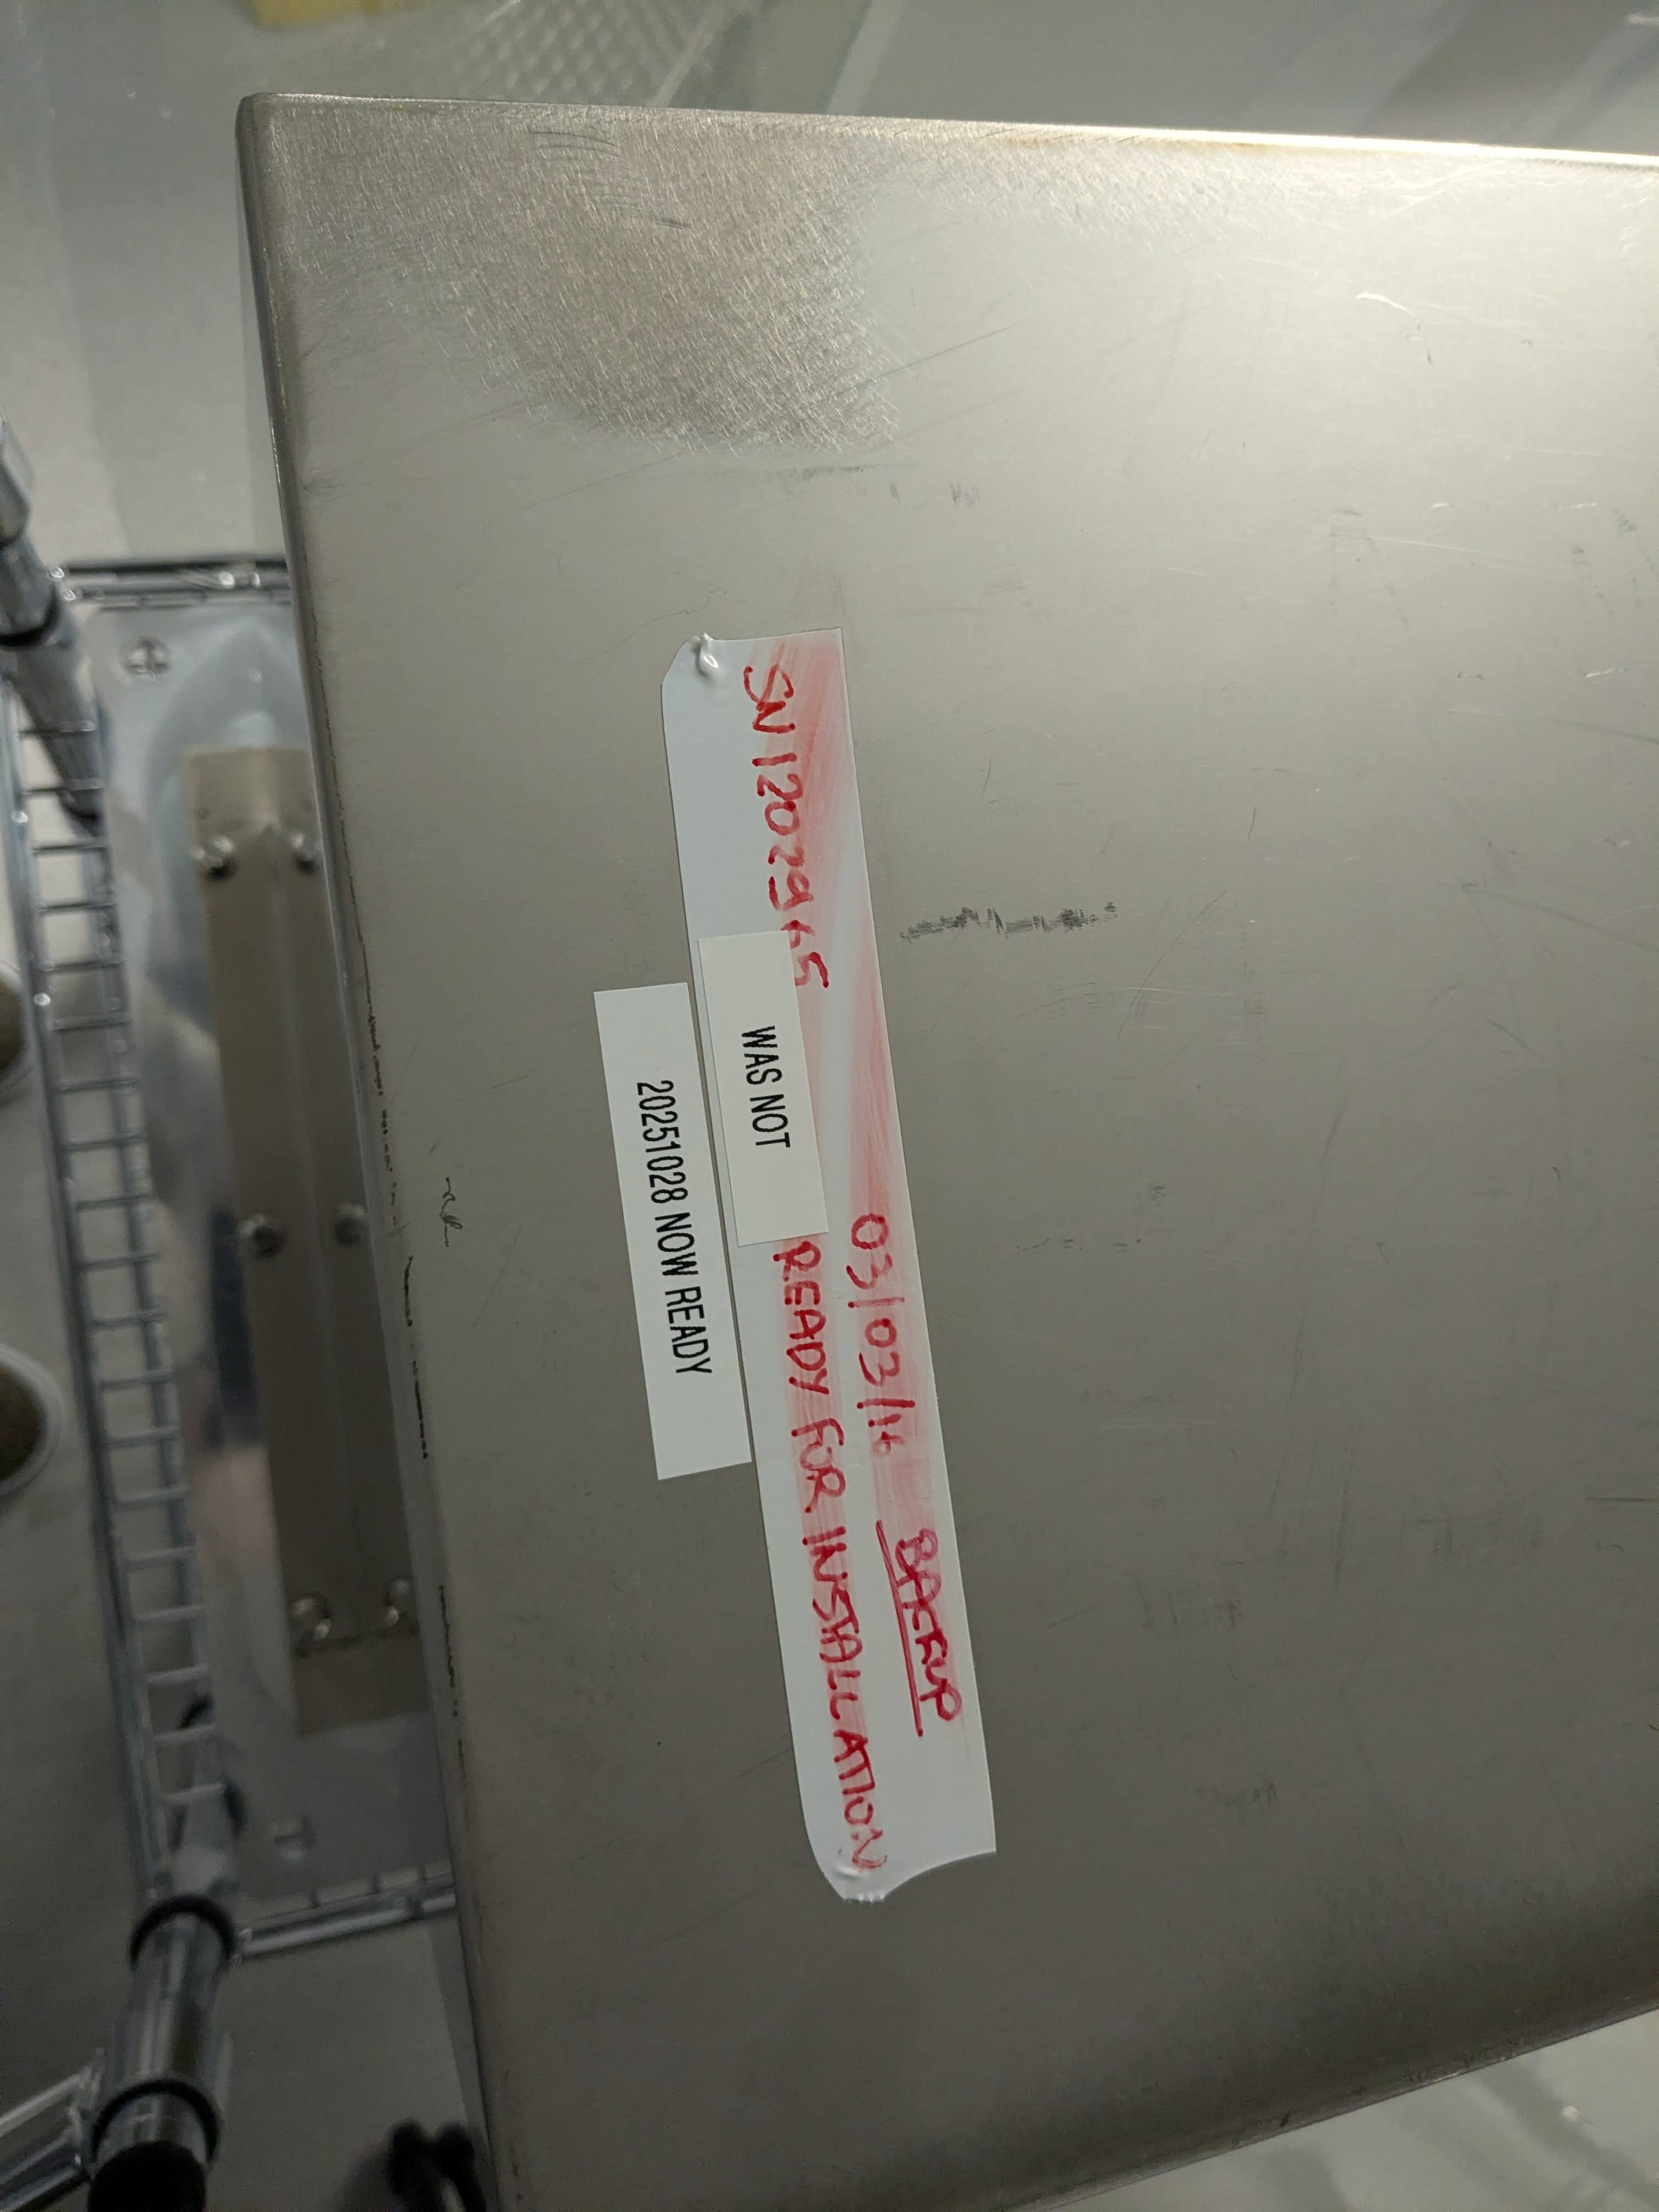
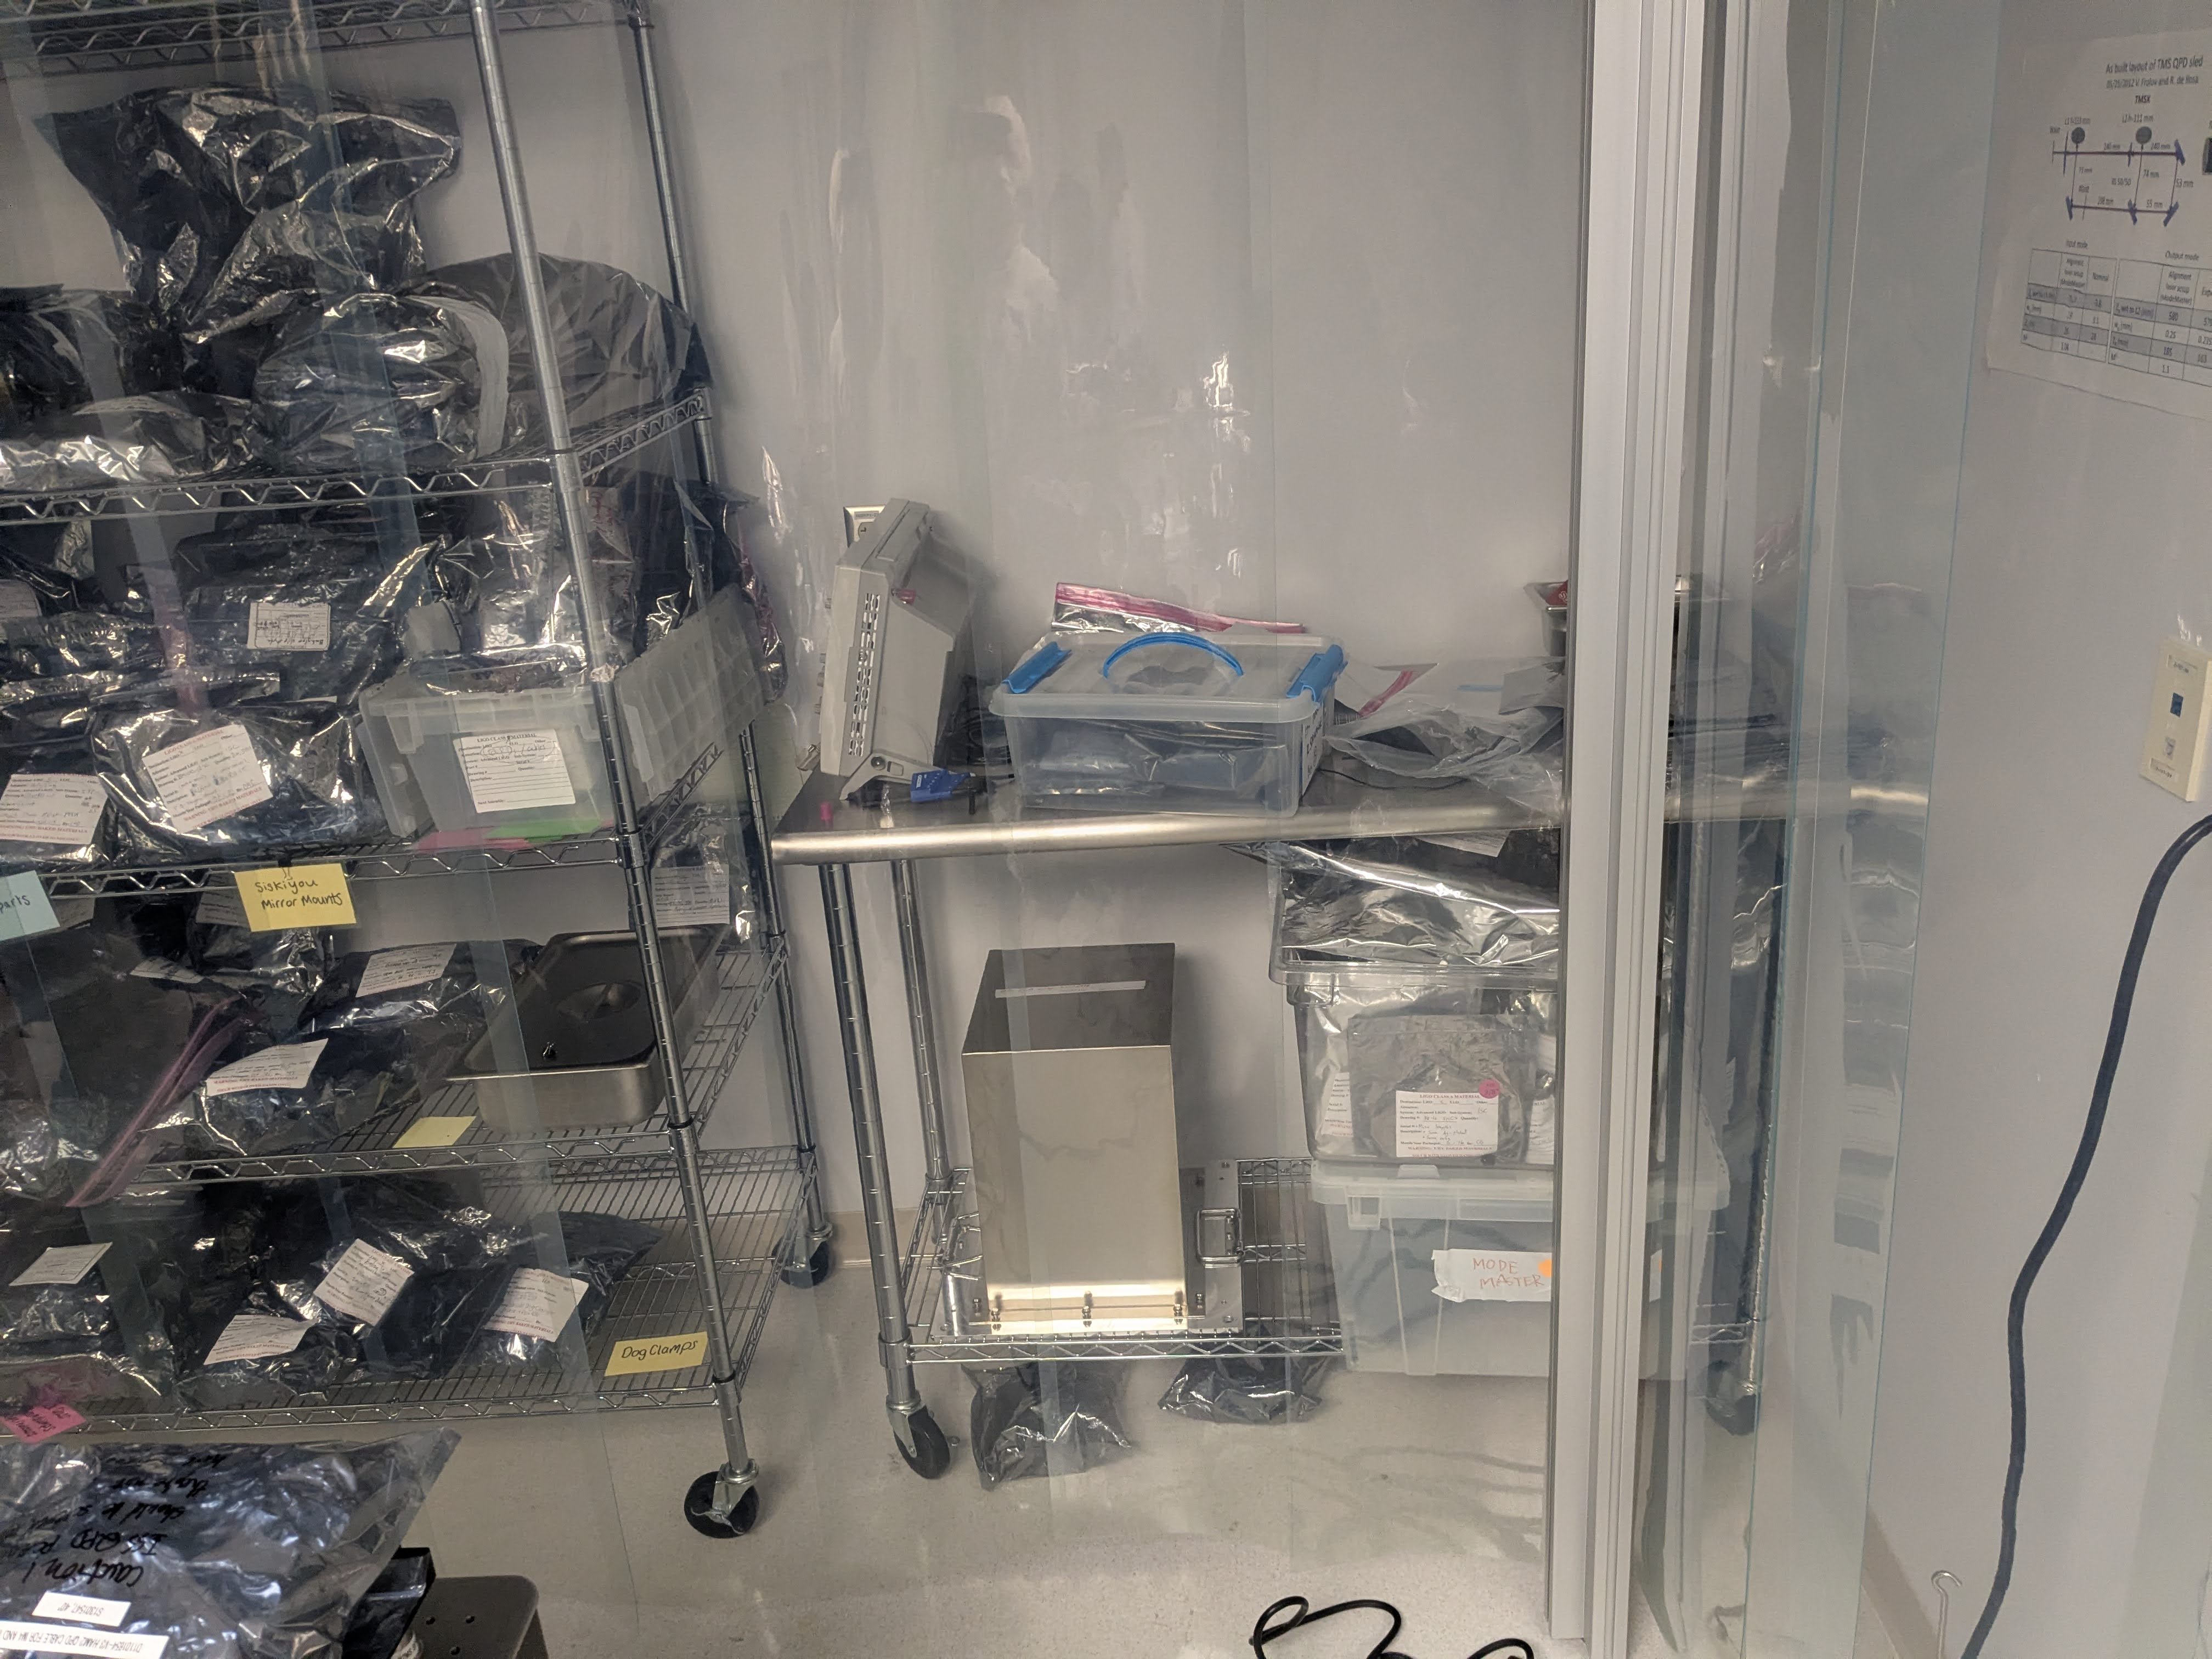
We disconnected everything from the ISS array installation spare unit S1202965 and stored it in the ISS array cabinet in the vac prep area next to the OSB optics lab. See the first 8 pictures.
The incomplete spare ISS array assy originally removed from LLO HAM2 (S1202966) was moved to a shelf under the work table right next to the clean loom in the optics lab (see the 9th picture). Note that one PD was pulled from that and was transplanted to our installation spare S1202965.
Metadata for both 2965 and 2966 were updated.
ISS second array parts inventory https://dcc.ligo.org/E2500191 is being updated.
Rahul and I cleared the optics table so Josh and Jeff can do their SPI work.
Optics mounts and things were put in the blue cabinet. Mirrors, PBS and lenses were put back into labeled containers and in the cabinet in front of the door to the change area.
Butterfly module laser, the LD driver and TEC controller were put back in the gray plastic bin. There was no space in the cabinets/shelves so it's put under the optics table closer to the flow bench area.
Single channel PZT drivers were put back in the cabinet on the northwest wall in the optics lab. Two channel PZT driver, oscilloscopes, a function generator and DC supplies went back to the EE shop.
OnTrack QPD preamp, its dedicated power transformer, LIGO's LCD interface for QPD and its power supply were put in a corner of one of the bottom shelf of the cabinet on the southwest wall.
Thorlabs M2 profiler and a special lens kit for that were given to Tony who stored them in the Pcal lab.
aLIGO PSL ISS PD array spare parts inventory E2500191 was updated.
I was baffled to find that I haven't made an alog about it, so here it is. These as well as other alogs written by Jennie, Rahul or myself in since May-ish 2025 will be added to https://dcc.ligo.org/LIGO-T2500077.
Multiple PDs were moved so that there's no huge outlier in the position of the PDs relative to the beam. When Mayank and Siva were here, we used to do this using an IR camera to see the beam spot position. However, since then we have found that the PD output itself to search for the edge of the active area is easier.
After the adjustments were made, the beam going into the ISS array was scanned vertically as well as horizontally while the PD outputs were recorded. See the first attachment. There are two noteworthy points.
1. PDs "look" much narrower in YAW than in PIT due to 45 degrees AOI only in YAW.
Relative alignment matters more for YAW because of this.
2. YAW scan shows the second peak for most of PDs but only in one direction.
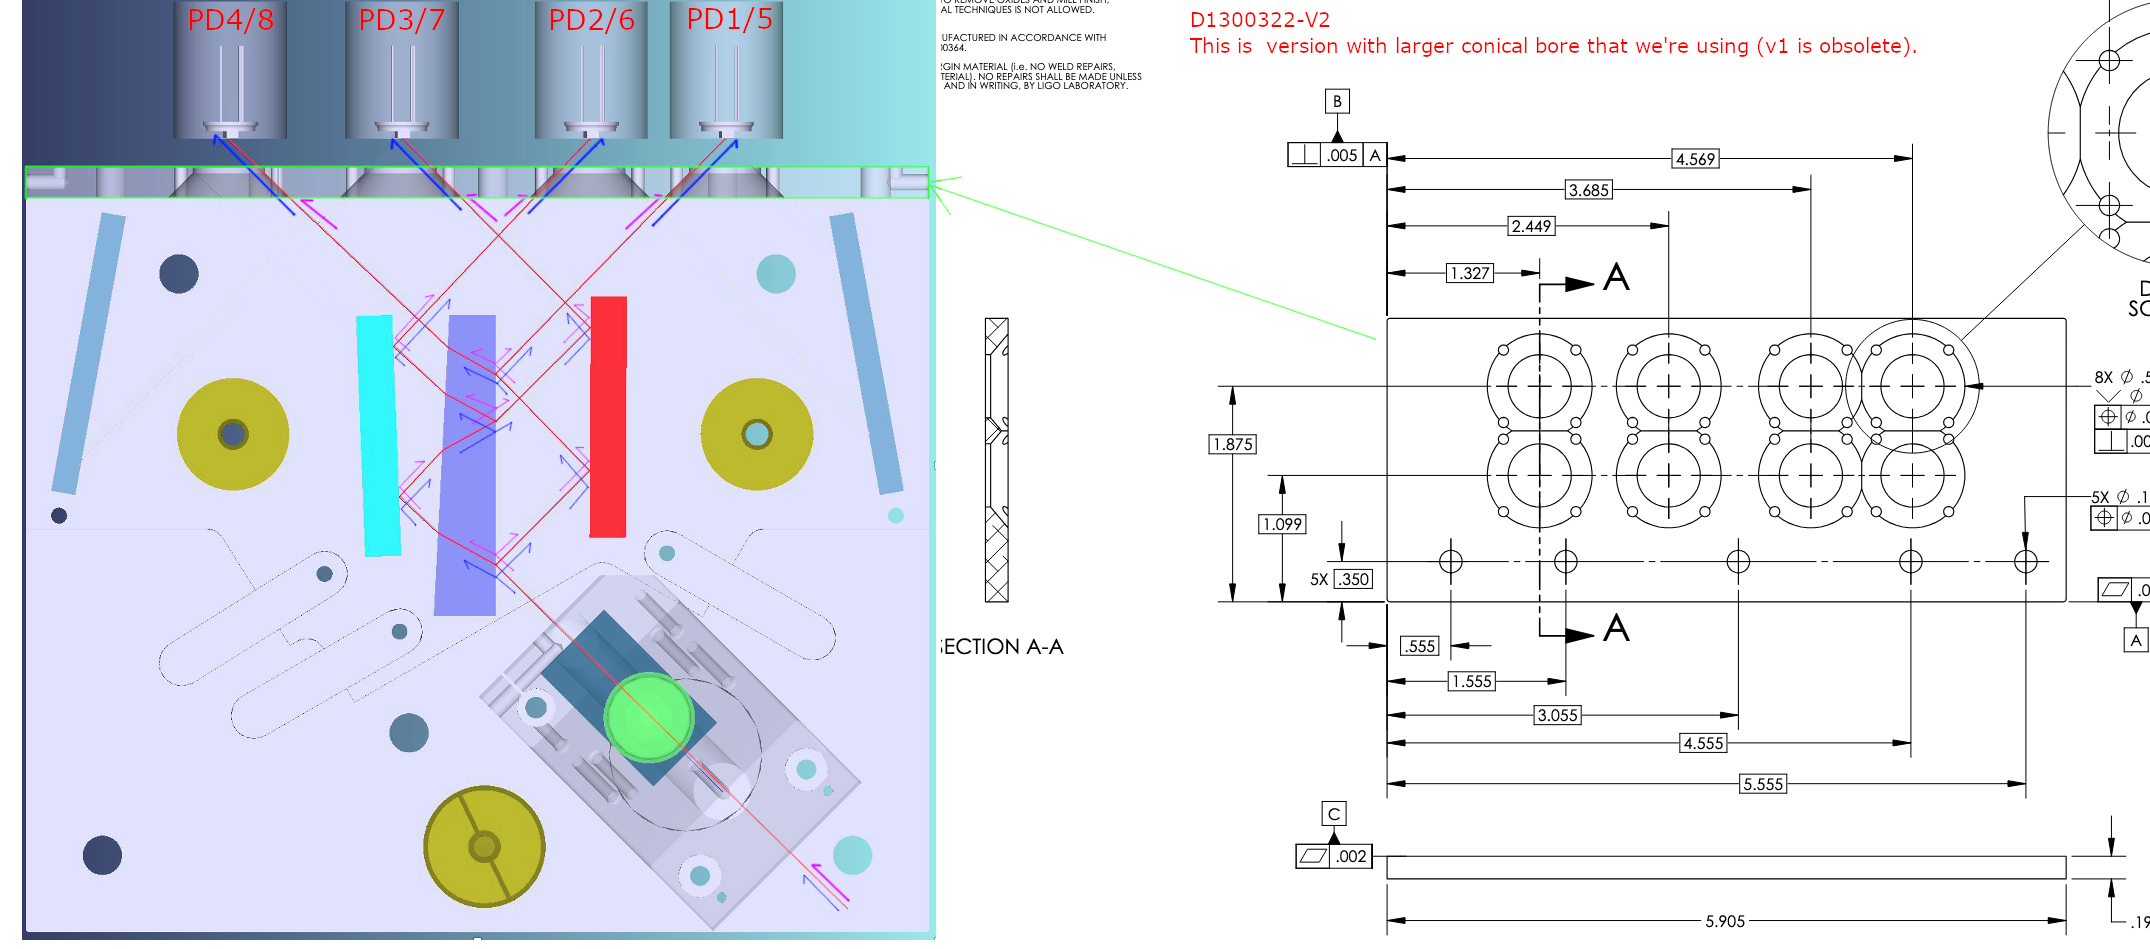
This was observed in Mayank/Siva data too but it wasn't understood back then. This is the design feature. The PDs are behind an array plate like in the second attachment (the plate itself is https://dcc.ligo.org/D1300322). Red lines show the nominal beam lines and they're pretty close to one side of the conical bores on the plate. Pink and blue arrows represent the shifted beam in YAW.
If the beam is shifted too much "to the right" on the figure (i.e. pink), the beam is blocked by the plate, but if the shift is "to the left" (i.e. blue) the beam is not blocked. It turns out that it's possible that the beam grazes along the bore, and when that happens, a part of the broad specular reflection hits the diode.
See the third attachment, this was shot when PD1 (the rightmost in the picture) was showing the second peak while PD2 didn't.
(Note that the v2 plate which we use is an improvement over the v1 that actually blocked the beam when the beam is correctly aligned. However, there's no reason things are designed this way.)
We used a PZT-driven mirror to modulate the beam position, which was measured by the array QPD connected to ON-TRAK OT-301 preamp as explained in this document in T2500077 (though it is misidentified as OT-310).
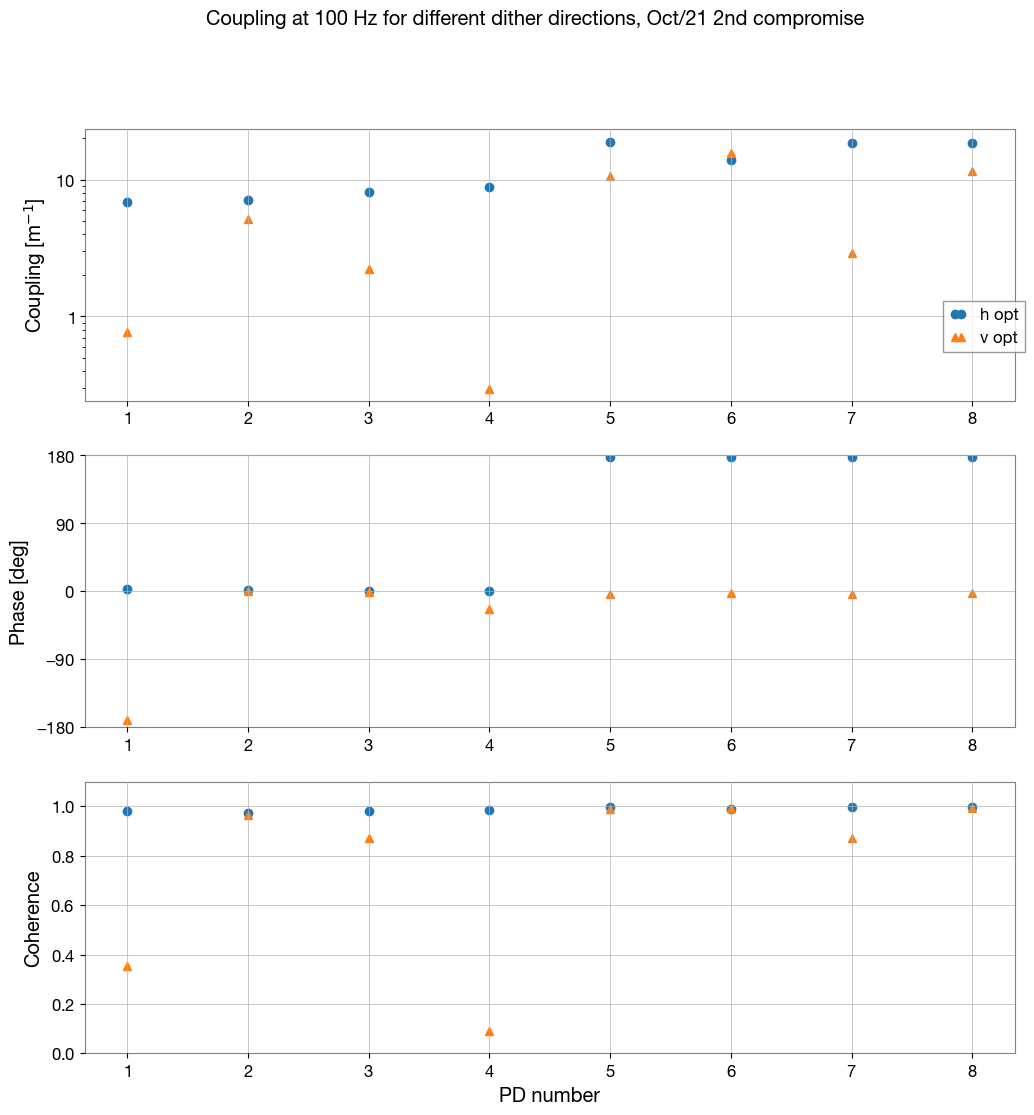
See the fourth attachment where relatively good (small/acceptable) coupling was obtained. The numbers measured this time VS April 2025 (Mayank/Siva numbers) VS February 2016 (T1600063-V2) are listed below. All in all, horizontal coupling was better in April but vertical is better now. Both now and Apr/2025 are better than Feb/2016.
| PD number |
Horizontal [RIN/m] |
Vertical [RIN/m] |
||||
| Now |
Apr/2025 (phase NA) |
Feb/2016 (phase NA) |
Now |
Apr/2025 (phase NA) |
Feb/2016 (phase NA) |
|
|
1 |
6.9 | 0.8 | 20 | -0.77 | 34.1 | 11 |
| 2 | 7.1 | 2.7 | 83 | 5.1 | 2 | 25 |
| 3 | 8.2 | 5.5 | 59 | 2.2 | 4.4 | 80 |
| 4 | 8.8 | 2.3 | 33 | 0.30 | 1.1 | 21 |
| 5 | -19 | 5.1 | 22 | 11 | 12.3 | 56 |
| 6 | -14 | 12.9 | 67 | 16 | 30.4 | 44 |
| 7 | -18 | 10.2 | 27 | 2.9 | 42.7 | 51 |
| 8 | -19 | 5.3 | 11 | 12 | 52.1 | 54 |
Phase of the jitter coupling: You can mix and match to potentially lower jitter coupling further.
Only in "Now" column, the coupling is expressed as signed numbers as we measured the phase of the array PD output relative to the QPD output. Absolute phase is not that important but relative phase between the array PDs is important. The phase is not uniform across all diodes when the beam is well aligned. This means that you can potentially mix and match PDs to further minimize the jitter coupling.
Using the example of this particular measurement, if you choose PD1/2/3/4 as the in-loop PD, the jitter coupling of the combined signal is roughly mean(6.9,7.1,8.2,8.8)=7.8 RIN/m horizontally and mean(-0.77, 5.1, 2.2, 0.3) = 1.7.
However, if you choose PD1/3/4/7 (in analog land), the coupling is reduced to mean(6.9, 8.2, 8.8, -18)=1.5 horizontally and mean(-0.77, 2.2, 0.3, 2.9)=1.2.
You don't pre-determine the combination now, you should tune the alignment and measure the coupling in chamber to decide if you want a different combination than 1/2/3/4.
Note, when monotonically scanning the beam position in YAW (or PIT) edge to edge of PDs, some PDs showed more than one phase flips. When the beam is apparently clipped at the edge (thus the coupling is huge), all diodes show the same phase as expected. But that's not necessarily the case when the beam is well aligned as you saw above.The reason of the sign flips when the beam is far from the edge of the PD is unknown but there should be something like particulates on the PD surface.
The QPD was physically moved so the beam is very close to the center of the QPD. This can be used as a reference in chamber when aligning the beam to the ISS array.
After this, we manually scanned the beam horizontally and measured the QPD output. See the 5th attachment, vertical axis is directly comparable to the normalized PIT/YAW of the CDS QPD module, assuming that the beam size on the QPD in the lab is close enough to the real beam in chamber (which it should be).


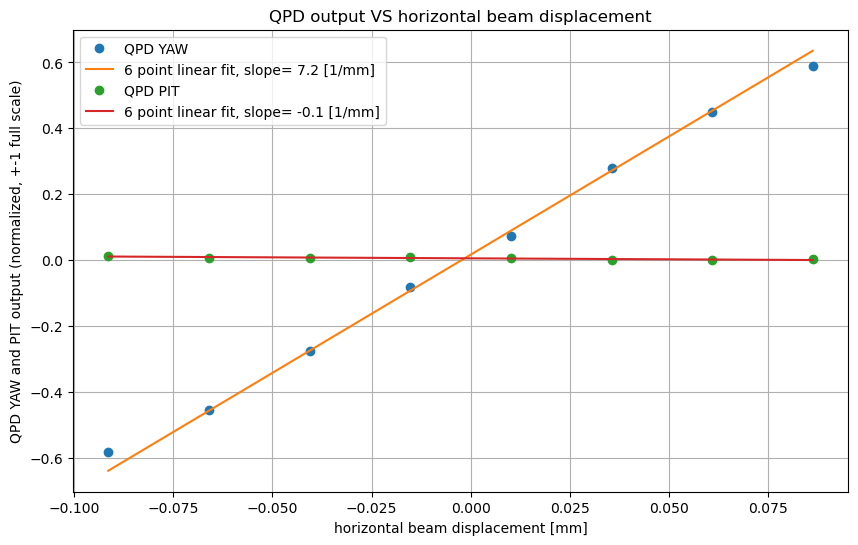
EPO-tagging for ISS Array work
