david.barker@LIGO.ORG - posted 16:47, Monday 15 December 2025 (88526)
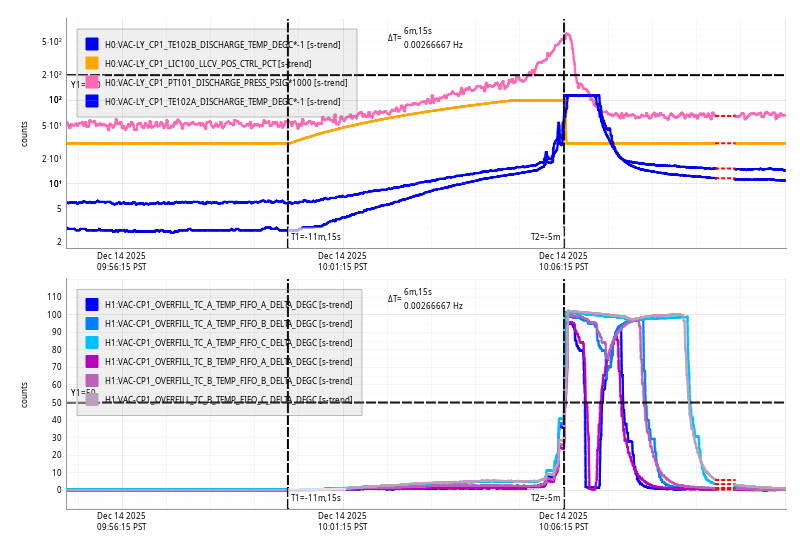
Mon CP1 Fill
Mon Dec 15 10:07:40 2025 INFO: Fill completed in 7min 37secs
Images attached to this report
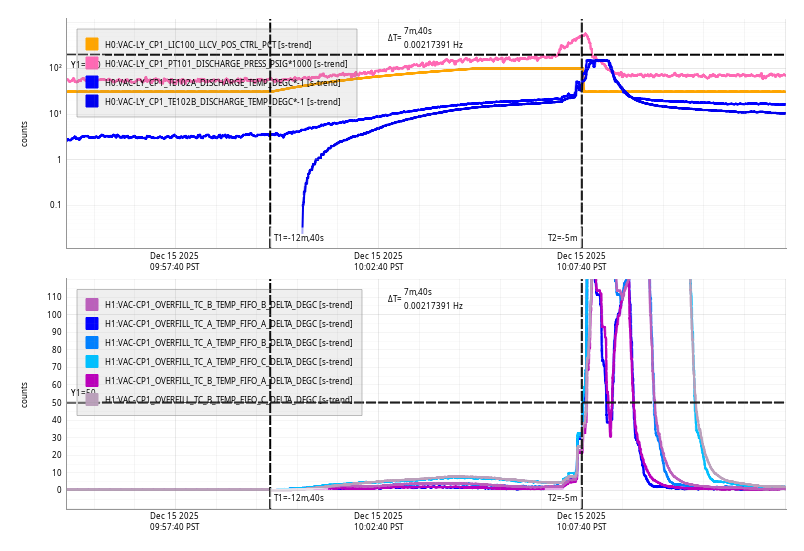
Mon Dec 15 10:07:40 2025 INFO: Fill completed in 7min 37secs
TITLE: 12/16 Day Shift: 1530-0030 UTC (0730-1630 PST), all times posted in UTC
STATE of H1: Planned Engineering
INCOMING OPERATOR: None
SHIFT SUMMARY: Both HAM1 doors off, the ISI is locked, and table masses are being moved. the sush12 front end has been swapped and is back up but the single suspensions aren't quite right yet. HAM7 OPO work continued. Norco came this afternoon and filled CP5. Corner station is still under vacuum. Also, it's windy.
LOG:
| Start Time | System | Name | Location | Lazer_Haz | Task | Time End |
|---|---|---|---|---|---|---|
| 15:57 | SAF | LASER | LVEA | N | LVEA is Upgrade Phase LASER SAFE \u0d26\u0d4d\u0d26\u0d3f (\u2022_\u2022) | 10:51 |
| 16:03 | SYS | Randy | LVEA | n | Craning pallets, prepping areas for doors off | 18:13 |
| 16:47 | SYS | Jason | LVEA | n | Check in with Randy and help out there | 18:19 |
| 16:48 | SUS | Rahul | Opt Lab | n | Checking on parts | 16:49 |
| 16:53 | CDS | Fil | LVEA | N | Disconnecting ISCT1 | 17:49 |
| 16:55 | PEM | TJ | LVEA | N | Turning on HAM1 DM and checking HAM6 DM | 17:24 |
| 17:00 | AOS | Betsy | LVEA | N | Bellows removal prep | 18:50 |
| 17:04 | VAC | Jordan, Travis | LVEA | N | HAM1 vent prep, CS vent | 20:11 |
| 17:07 | CAL | Tony | PCal Lab | Local | Setting up measurement | 17:14 |
| 17:13 | PEM | Robert | LVEA | N | Investigating cable | 17:19 |
| 17:21 | SAF | RyanS | LVEA | n | Transitioning to Upgrade SAFE | 17:37 |
| 17:49 | SUS | Jeff | CER | n | Helping Fil with SUS chassis | 23:18 |
| 17:49 | CDS | Fil | CER | n | SUS h12 chassis work | 00:58 |
| 17:57 | FAC | Kim, Nellie | LVEA | n | Tech clean | 17:58 |
| 18:14 | TCS | Matt, Louis, Gabriele | Prep lab | n | Cheta table prep | 19:58 |
| 18:25 | FAC | Kim, Nellie | LVEA | n | HAM1/2 cleaning | 19:38 |
| 18:35 | SQZ | Jennie | LVEA | n | SQZ table peek | 19:20 |
| 18:39 | SEI | Jim | LVEA | n | Locking HAM1 HEPI | 19:03 |
| 18:50 | SYS | Randy | LVEA | n | Checking in at HAM1 | 22:52 |
| 18:53 | SQZ | Sheila, Kar Meng, Eric O., Daniel D. | LVEA | N | OPO installation in HAM7 | 20:11 |
| 19:02 | VAC | Gerardo | LVEA | N | HAM1 venting | 20:11 |
| 19:22 | SEI | Jim | LVEA | N | Prepping for chamber work; looking at parts | 19:28 |
| 19:37 | AOS | Betsy | LVEA | N | Checking on things | 19:41 |
| 20:42 | SYS | Betsy | LVEA | n | Checking on cleanroom | 21:23 |
| 21:10 | VAC | Gerardo, Travis, Jordan | LVEA | n | HAM1 Doors (Travis out at 2258) | 23:14 |
| 21:22 | CDS | Daniel | CER,CR | n | Beckhoff work | 00:05 |
| 21:25 | CDS | Erik | FCES | n | Looking for Wifi | 21:46 |
| 21:36 | ISC | Corey | Opt Lab | n | Looking for peek zip ties | 21:45 |
| 21:38 | SQZ | Sheila, Kar Meng, Eric O, Daniel D | LVEA | n | HAM7 OPO work (Sheila out at 0006) | 00:14 |
| 21:42 | OPS | Richard | LVEA | n | Checking on teams | 00:10 |
| 21:46 | IO | Jennie, Masayuki | Opt Lab | n | JAC prep | 01:06 |
| 22:08 | VAC | Norco | MX | n | LN2 fill | 00:23 |
| 22:10 | SUS | Rahul | Opt Lab | n | Optics cleaning and setting down JMs | 22:31 |
| 22:25 | SYS | Betsy | LVEA | n | Check on HAM1 | 22:52 |
| 22:25 | SQZ | Jim | LVEA | n | HAM7 help | 02:11 |
| 22:50 | FAC | Tyler | LVEA | n | HAM1 help | 22:51 |
| 22:59 | SYS | Betsy | LVEA | n | Checking on vent teams | 00:51 |
| 23:03 | SEI | Mitchell | LVEA | n | HAM1 locking with Jim | 01:03 |
| 23:29 | VAC | Jordan, Travis | LVEA | N | Relay tube vent prep | 00:05 |
| 23:57 | SUS | Rahul | Opt Lab | n | Dropping off parts | 00:00 |
| 23:58 | FAC | Tyler | Xarm | n | Tumbleweed clearing | 00:58 |
| 00:06 | PCAL | Tony | PCAL lab | local | Sphere swap | 01:06 |
| 00:16 | CDS | Marc | LVEA | n | Installing JAC heater cable | 01:16 |
[Sheila, Eric, Jim, Kar Meng, Daniel D.]
When we started working this morning, the particle counts were 20/10/10 per cubic foot
It looked like the old cable for the PZT that needs to be replaced was routed to back into the chamber to a cable bracket which was far from reach. Before we can remove it, we need to find the cable harness plan for HAM7.
In the mean time, we were able to re-route the TEC cable using photos from this alog.
### Broke for lunch ###
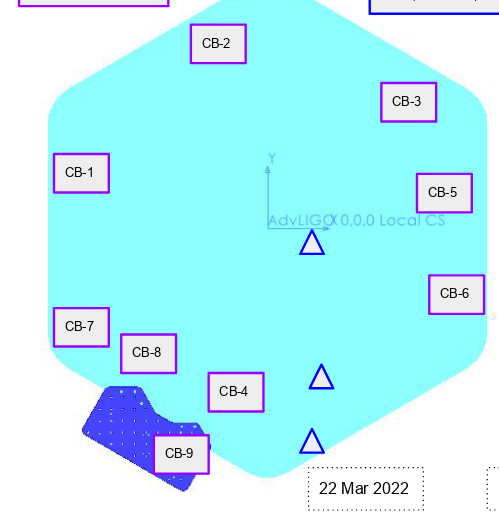
Over lunch, we determined the correct connector for the PZT/translation stage was on CB5 in HAM7. It's labeled cable #4 according to the wiring diagram. We also verified the correct operation of the TEC controller and the oven from CDS
After we returned, the particle counts were 0/0/0 per cubic foot and we uncovered the chamber to finish replacing the cables.
Unfortunately, cable #4 between CB5 (see image) and the OPO is terminated in a male molded connector, which is screwed into the connector bracket. This meant that we needed to remove the female cable (from the flange) from the rear of the connector and then remove the male connector (to OPO) from the cable bracket. Jim came in to help us reach the connector and he decided that it would be easier to remove the top and second-from-top connectors (3rd and 4th on CB5 in the wiring plan) from the bracket to make it easier to reach the ones for cable #4. Jim was able to remove the old cable and replace it with the new one in the bracket.
After Jim left, we were able to continue reinstalling the new cable. The longest DB-9 tentacle on the new cable is for the VOPO PZTs, the DB-15 is for the stage control, and the short DB-9 is a spare which was coiled to the side. We were then able to connect the piezo and stage control connectors to the OPO and roughly re-route the cabling on the ISI table. Final routing and securing of these new cables/checking for mistakes is still required.
Cable removed was D1700438-V2-00-S2101231
A 5 dB attenuator was added at the input of the RF doubler for the JAC 43 MHz generation. This brought the input level to a nominal 10 dBm.
Checked the 43MHz RF distribution from the CER to ISC-R2 and the WFS demodulators. The demod for the length sensor is shared with the IMC demod. All slow comtrols readbacks are now working.
Added the cabling for the new whitening concentrators. This also required a software upgrade.
The following QPD whitening channels were affected:
Instead of 4 x 8-bits, only 1 x 8 bits are used and all 4 segments are switched simulatanously. There is no change in the whitening interface for these QPDs, since the software already tied the segments together. The only change is in the readnback bits where only the last 8-bits are still significant.
This allowed us to add the whitening for the JAC WFS as well as dewhitening for the JAC PZT driver.
F. Clara, J. Figueroa, J. Kissel, M. Pirello
ECR E2400409 and E2500296 (IIET 35739 and 35706, respectively)
WP 12901
DWG D0902810-v12
DCN E2500341

Today we've gone forward with merging the sush2a and sush2b IO chassis, facilitated by upgrading those SUS's DAC cards to 32 CH, 28- bit DACs (D2200368). This entry covers the analog electronics and cabling that were impacted by the change, covering that all of the suspensions in, or soon to be in HAM1 and HAM2 -- MC1, MC3, PRM, PR3, IM1, IM2, IM3, IM4, RM1, RM2, PM1, JM1, and JM3.

We followed changes outlined in E2500341 which highlights the changes in the sush12 SUS electronics system drawing from D0902810-v11 to D0902810-v12.
That required
    - disconnecting all affected AI output cables in SUS-C3 and SUS-C4,
    - Removing the existing 6x 2x 8CH DAC AI chassis (D1000305),
    - modifying them to become D2500353 1x 32CH AI chassis
        . replacing the 2x 8CH AI rear panel with WD relays (D1000551) with 1x 32CH AI rear panel without WD relays (D2500097)
        . replacing the 2x 8CH back panel (https://dcc.ligo.org/LIGO-D1000552 with 1x 32CH back panel (D2400308)
    - re-installing, then
    - cabling everything up according to the D0902810-v12 version of the wiring diagram.

Here's the list of modified AI chassis serial numbers and assignment:
                                                     D1000305 > D2500353     D2500097
SUS Chain                     Rack / Position        Chassis S/N             Rear Board S/N          32CH DAC Card / IO Slot      Channels (Counting from 0)
MC1, MC3, PRM TOPs            SUS-C4 / U30           S1104370                S2501311                DAC0 / #2                     0-15
PRM, PR3 TOPs MC1 MID BOT     SUS-C4 / U29           S1104374                S2501315                DAC0 / #2                    16-31

MC3, PRM MID/BOT              SUS-C4 / U22           S1104375                S2501310                DAC1 / #4                     0-15
PR3 MID/BOT, RM1, RM2         SUS-C4 / U21           S1104378                S2501312                DAC1 / #4                    16-31

IM1, IM2, IM3, IM4            SUS-C4 / U10           S1104377                S2501314                DAC2 / #5                     0-15
PM1, JM1, and JM3             SUS-C4 /  U2           S1102760**              S2501313                DAC2 / #5                    16-31

** Technically, the (now) PM1, JM1, and JM3 AI chassis S1102760 was a 16-bit DAC AI chassis (D1101521) instead of a D1000305 at the start of today, and it didn't *need* the additional 16CH pass-through SCSI connection, but in the spirit of making everything the same, we elected to make it a full "new normal" D2500353 chassis.
Pictures of the now-D2500353 AI chassis rear boards and their connections. They're attached in the order of rear board serial numbers; the corresponding chassis number is listed above.


Updated H1-SUSH12 Timing FPGA code to latest firmware version 1589 V5
Updated H1-SUSH2AUX timing FPGA code to latest firmware version 1589 V5
Rebooted both chassis and they are now reporting correctly according to Dave.
For reference: The 16-chn/16-bit AI chassis with interface boards D070101 are not compatible with the new 32-chn DACs. Both have a 68-pin SCSI connector but the pinout isn't compatible.
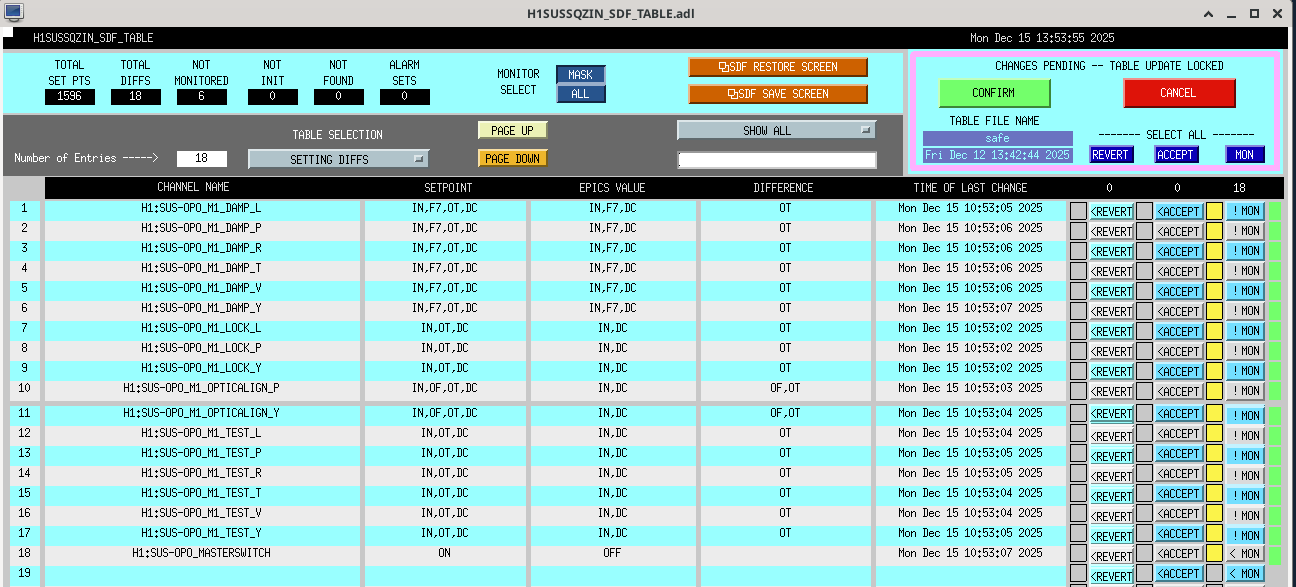
While I was checking the suspensions this morning I noticed that the OPO sus guardian was in SAFE but there was still output going to the suspension. Trending the channels it looks like SDF revert was reverting the channels that the node had set in its SAFE state. I unmonitored these channels, see attached.
It looks like all other suspensions on this model are in a similar situation, but I'll wait to do those when the SQZ team isn't actively working in HAM7
Because CDS got an early start on SUSH12 work, we had to bypass the IOP wd to reisolate HAM1 HEPI to lock. Otherwise this went as normal. Angular deviations are all still <5 urad, location deviations are all slightly larger, still below 10um though.
Jennie W
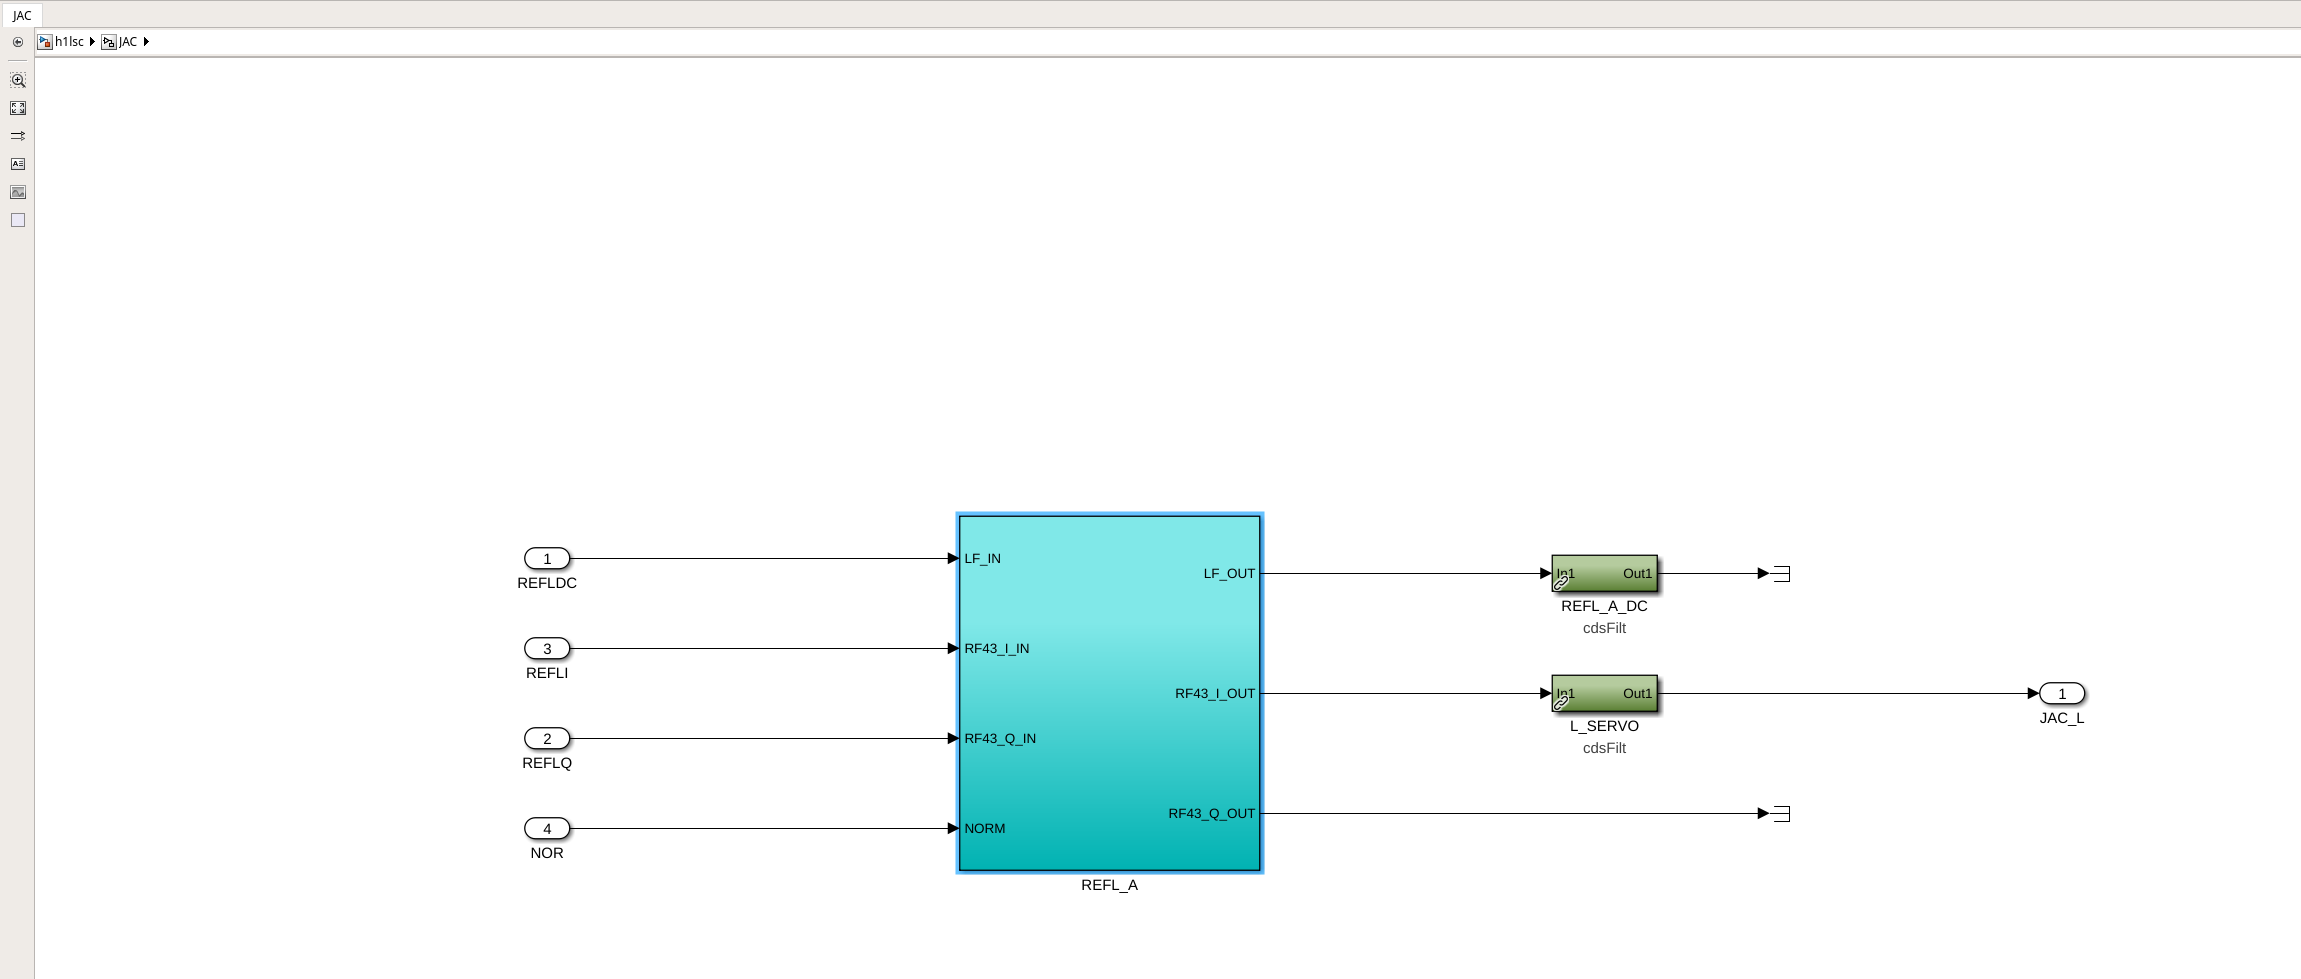
I made a mistake in naming the block for the JAC LSC PD. It should be "REFL_A" and instead I named it "RF43" since there is also a RF43 block inside the "REFL_A block", this made the channel names "H1:JAC-REFL_A_RF43_RF43" which is unwieldy. Fixed it in the h1lsc model, built it on the h1build computer and not its committed to the svn at userapps/lsc/h1/models/
The RFPD block is shown in this picture with its new name. and the contents of this block is shown here.

J. Kissel

After offloading the IMC WFS (LHO:88510), and saving alignment offsets in respective safe.snaps (LHO:88511 and LHO:88512), I've brought all SUS on the h1sush2a and hsush2b computers to SAFE (that's MC1, MC3, PRM, PR3 and IM1, IM2, IM3, IM4, RM1, RM2, PM1, respectively). I've also brought the HAM1 and HAM2 SEI systems to ISI_DAMPED_HEPI_OFFLINE.

This is all in prep for the h1sush2a and h1sush2b merge into h1sush12, which is coincident with the DACs in these chassis getting upgraded to 32 CH 28-bit DACs per ECRs E2400409 and E2500296 scheduled via WP 12901.
J. Kissel


Saved opticalign alignment sliders for SUS on the h1sush2b computer in the h1susim and h1sushtts models;
    h1susim
        H1SUSIM1
        H1SUSIM1
        H1SUSIM1
        H1SUSIM1
    h1sushtts (which will become h1susham1)
        H1SUSRM1
        H1SUSRM2
        H1SUSPM1

Ready for the h1sush2a + h1sush2b = h1sush12 IO chassis merge!

J. Kissel

Saved opticalign alignment sliders in H1SUSMC1, MC3, PRM, and PR3 models. In particular, after I offloaded the IMC WFS (see LHO:88510).

J. Kissel

In prep for for the sush12 upgrade, I've offloaded the IMC WFS to the MC1, MC2, and MC3 OPTICALIGN sliders. This was done with the built in "MCWFS_OFFLOADED" state in the IMC_LOCK guardian. There wasn't too much alignment change requested by the WFS's control signal; just ~5 counts on MC1 and MC3.
I'll now save the alignment offsets into the SUS safe.snaps.
TITLE: 12/15 Day Shift: 1530-0030 UTC (0730-1630 PST), all times posted in UTC
STATE of H1: Planned Engineering
OUTGOING OPERATOR: None
CURRENT ENVIRONMENT:
SEI_ENV state: MAINTENANCE
Wind: 25mph Gusts, 19mph 3min avg
Primary useism: 0.05 μm/s
Secondary useism: 0.44 μm/s
QUICK SUMMARY: Gate valves 5 & 7 closed, plan is to vent the CS and start the SUS CDS upgrade. Vent meeting at 830 in the control room today to coordinate.
Noting the current state of the select systems:
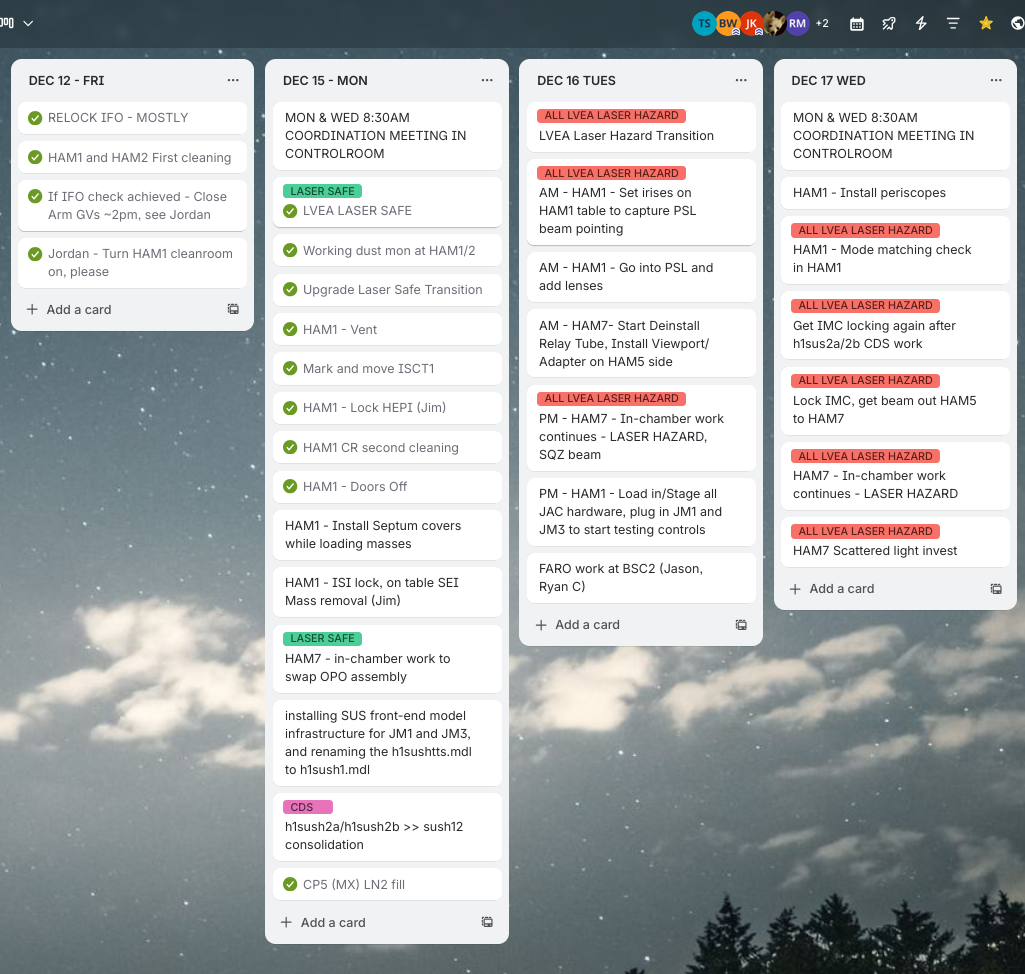
Full into Vent Mode now, here is the current plan for the next few days.

Sun Dec 14 10:06:15 2025 INFO: Fill completed in 6min 11secs
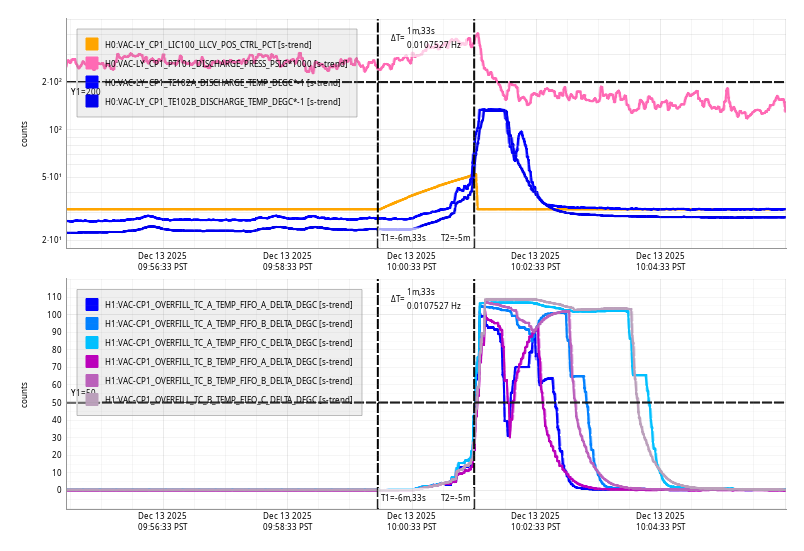
Sat Dec 13 10:01:33 2025 INFO: Fill completed in 1min 32secs
Quick fill, has been burping LN2 over past day.